http://fasb.org/us-gaap/2024#InterestReceivable0.66670.500.500.500.500.66670.500.500.500.500.66670.500.500.500.50http://fasb.org/us-gaap/2024#OtherLiabilitieshttp://fasb.org/us-gaap/2024#OtherAssets00015776702025Q1FALSE12/31xbrli:sharesiso4217:USDiso4217:USDxbrli:sharesxbrli:pureladr:unconsolidatedVentureladr:loansladr:propertyladr:loanladr:securityladr:agreementladr:optionladr:jointVentureladr:installmentladr:segment00015776702025-01-012025-03-310001577670us-gaap:CommonClassAMember2025-04-180001577670us-gaap:CommonClassBMember2025-04-1800015776702025-03-3100015776702024-12-310001577670us-gaap:CommonClassAMember2025-03-310001577670us-gaap:CommonClassAMember2024-12-3100015776702024-01-012024-03-310001577670us-gaap:CommonClassAMember2025-01-012025-03-310001577670us-gaap:CommonClassAMember2024-01-012024-03-310001577670us-gaap:CommonStockMemberus-gaap:CommonClassAMember2024-12-310001577670us-gaap:AdditionalPaidInCapitalMember2024-12-310001577670us-gaap:TreasuryStockCommonMember2024-12-310001577670us-gaap:RetainedEarningsMember2024-12-310001577670us-gaap:AccumulatedOtherComprehensiveIncomeMember2024-12-310001577670ladr:NoncontrollingInterestInConsolidatedVenturesMember2024-12-310001577670us-gaap:AdditionalPaidInCapitalMember2025-01-012025-03-310001577670us-gaap:CommonStockMemberus-gaap:CommonClassAMember2025-01-012025-03-310001577670us-gaap:TreasuryStockCommonMember2025-01-012025-03-310001577670us-gaap:RetainedEarningsMember2025-01-012025-03-310001577670ladr:NoncontrollingInterestInConsolidatedVenturesMember2025-01-012025-03-310001577670us-gaap:AccumulatedOtherComprehensiveIncomeMember2025-01-012025-03-310001577670us-gaap:CommonStockMemberus-gaap:CommonClassAMember2025-03-310001577670us-gaap:AdditionalPaidInCapitalMember2025-03-310001577670us-gaap:TreasuryStockCommonMember2025-03-310001577670us-gaap:RetainedEarningsMember2025-03-310001577670us-gaap:AccumulatedOtherComprehensiveIncomeMember2025-03-310001577670ladr:NoncontrollingInterestInConsolidatedVenturesMember2025-03-310001577670us-gaap:CommonStockMemberus-gaap:CommonClassAMember2023-12-310001577670us-gaap:AdditionalPaidInCapitalMember2023-12-310001577670us-gaap:TreasuryStockCommonMember2023-12-310001577670us-gaap:RetainedEarningsMember2023-12-310001577670us-gaap:AccumulatedOtherComprehensiveIncomeMember2023-12-310001577670ladr:NoncontrollingInterestInConsolidatedVenturesMember2023-12-3100015776702023-12-310001577670ladr:NoncontrollingInterestInConsolidatedVenturesMember2024-01-012024-03-310001577670us-gaap:AdditionalPaidInCapitalMember2024-01-012024-03-310001577670us-gaap:CommonStockMemberus-gaap:CommonClassAMember2024-01-012024-03-310001577670us-gaap:TreasuryStockCommonMember2024-01-012024-03-310001577670us-gaap:RetainedEarningsMember2024-01-012024-03-310001577670us-gaap:AccumulatedOtherComprehensiveIncomeMember2024-01-012024-03-310001577670us-gaap:CommonStockMemberus-gaap:CommonClassAMember2024-03-310001577670us-gaap:AdditionalPaidInCapitalMember2024-03-310001577670us-gaap:TreasuryStockCommonMember2024-03-310001577670us-gaap:RetainedEarningsMember2024-03-310001577670us-gaap:AccumulatedOtherComprehensiveIncomeMember2024-03-310001577670ladr:NoncontrollingInterestInConsolidatedVenturesMember2024-03-3100015776702024-03-310001577670ladr:LadderCapitalFinanceHoldingsLLLPMember2025-03-310001577670ladr:FirstMortgageHeldForInvestmentMember2025-03-310001577670ladr:FirstMortgageHeldForInvestmentMember2025-01-012025-03-310001577670ladr:MezzanineLoanMember2025-03-310001577670ladr:MezzanineLoanMember2025-01-012025-03-310001577670ladr:MortgageLoansHeldByConsolidatedSubsidiariesMember2025-03-310001577670ladr:MortgageLoansHeldByConsolidatedSubsidiariesMember2025-01-012025-03-310001577670ladr:MortgageLoanReceivablesHeldForInvestmentMember2025-03-310001577670ladr:MortgageLoanReceivablesHeldForSaleMember2025-03-310001577670ladr:MortgageLoanReceivablesHeldForSaleMember2025-01-012025-03-310001577670ladr:MortgageLoanReceivablesHeldForInvestmentMember2025-01-012025-03-310001577670ladr:FirstMortgageHeldForInvestmentMember2024-12-310001577670ladr:FirstMortgageHeldForInvestmentMember2024-01-012024-12-310001577670ladr:MezzanineLoanMember2024-12-310001577670ladr:MezzanineLoanMember2024-01-012024-12-310001577670ladr:MortgageLoansHeldByConsolidatedSubsidiariesMember2024-12-310001577670ladr:MortgageLoansHeldByConsolidatedSubsidiariesMember2024-01-012024-12-310001577670ladr:MortgageLoanReceivablesHeldForInvestmentMember2024-12-310001577670ladr:MortgageLoanReceivablesHeldForSaleMember2024-12-310001577670ladr:MortgageLoanReceivablesHeldForSaleMember2024-01-012024-12-3100015776702024-01-012024-12-310001577670ladr:MortgageLoanReceivablesHeldForInvestmentMember2024-01-012024-12-310001577670ladr:MortgageLoanReceivablesHeldForInvestmentMember2023-12-310001577670ladr:MortgageLoanReceivablesHeldForSaleMember2023-12-310001577670ladr:MortgageLoanReceivablesHeldForInvestmentMember2024-01-012024-03-310001577670ladr:MortgageLoanReceivablesHeldForSaleMember2024-01-012024-03-310001577670ladr:MortgageLoanReceivablesHeldForInvestmentMember2024-03-310001577670ladr:MortgageLoanReceivablesHeldForSaleMember2024-03-310001577670ladr:ConduitMortgageLoansMember2024-01-012024-03-310001577670ladr:AssetSpecificReserveCompanyLoanMember2025-01-012025-03-310001577670ladr:AssetSpecificReserveCompanyLoanMember2024-01-012024-03-310001577670ladr:MortgageLoanReceivablesHeldForInvestmentMemberladr:MultifamilyLoanMemberladr:OneOfCompanyLoansMember2025-01-012025-03-310001577670ladr:MortgageLoanReceivablesHeldForInvestmentMemberladr:MultifamilyLoanMemberladr:OneOfCompanyLoansMember2025-03-310001577670ladr:MortgageLoanReceivablesHeldForInvestmentMemberladr:MixedUseLoanMemberladr:OneOfCompanyLoansMember2025-01-012025-03-310001577670ladr:MortgageLoanReceivablesHeldForInvestmentMemberladr:MixedUseLoanMemberladr:OneOfCompanyLoansMember2025-03-310001577670ladr:MortgageLoanReceivablesHeldForInvestmentMemberladr:OfficeLoanMemberladr:OneOfCompanyLoansMember2025-01-012025-03-310001577670ladr:MortgageLoanReceivablesHeldForInvestmentMemberladr:OfficeLoanMemberladr:OneOfCompanyLoansMember2025-03-310001577670ladr:MortgageLoanReceivablesHeldForInvestmentMemberladr:HotelLoanMemberladr:OneOfCompanyLoansMember2025-01-012025-03-310001577670ladr:MortgageLoanReceivablesHeldForInvestmentMemberladr:HotelLoanMemberladr:OneOfCompanyLoansMember2025-03-310001577670ladr:MortgageLoanReceivablesHeldForInvestmentMemberladr:MultifamilyLoanMemberladr:OneOfCompanyLoansMember2024-01-012024-12-310001577670ladr:MortgageLoanReceivablesHeldForInvestmentMemberladr:MultifamilyLoanMemberladr:OneOfCompanyLoansMember2024-12-310001577670ladr:MortgageLoanReceivablesHeldForInvestmentMemberladr:MixedUseLoanMemberladr:OneOfCompanyLoansMember2024-01-012024-12-310001577670ladr:MortgageLoanReceivablesHeldForInvestmentMemberladr:MixedUseLoanMemberladr:OneOfCompanyLoansMember2024-12-310001577670srt:OfficeBuildingMember2025-03-310001577670srt:MultifamilyMember2025-03-310001577670ladr:MixedUseMember2025-03-310001577670srt:IndustrialPropertyMember2025-03-310001577670ladr:OtherMember2025-03-310001577670srt:RetailSiteMember2025-03-310001577670ladr:HospitalityMember2025-03-310001577670srt:OfficeBuildingMember2024-12-310001577670srt:MultifamilyMember2024-12-310001577670ladr:MixedUseMember2024-12-310001577670srt:RetailSiteMember2024-12-310001577670ladr:HospitalityMember2024-12-310001577670srt:IndustrialPropertyMember2024-12-310001577670ladr:OtherMember2024-12-310001577670ladr:OaklandCAMember2024-01-012024-12-310001577670ladr:OaklandCAMember2024-12-310001577670us-gaap:CommercialMortgageBackedSecuritiesMember2025-03-310001577670us-gaap:CommercialMortgageBackedSecuritiesMember2025-01-012025-03-310001577670ladr:CommercialMortgageBackedSecuritiesInterestOnlyMember2025-03-310001577670ladr:CommercialMortgageBackedSecuritiesInterestOnlyMember2025-01-012025-03-310001577670ladr:GovernmentNationalMortgageAssociationCertificatesAndObligationsGNMAInterestOnlyMember2025-03-310001577670ladr:GovernmentNationalMortgageAssociationCertificatesAndObligationsGNMAInterestOnlyMember2025-01-012025-03-310001577670us-gaap:USGovernmentAgenciesDebtSecuritiesMember2025-03-310001577670us-gaap:USGovernmentAgenciesDebtSecuritiesMember2025-01-012025-03-310001577670us-gaap:CommonStockMember2025-03-310001577670us-gaap:CommercialMortgageBackedSecuritiesMember2024-12-310001577670us-gaap:CommercialMortgageBackedSecuritiesMember2024-01-012024-12-310001577670ladr:CommercialMortgageBackedSecuritiesInterestOnlyMember2024-12-310001577670ladr:CommercialMortgageBackedSecuritiesInterestOnlyMember2024-01-012024-12-310001577670ladr:GovernmentNationalMortgageAssociationCertificatesAndObligationsGNMAInterestOnlyMember2024-12-310001577670ladr:GovernmentNationalMortgageAssociationCertificatesAndObligationsGNMAInterestOnlyMember2024-01-012024-12-310001577670us-gaap:USGovernmentAgenciesDebtSecuritiesMember2024-12-310001577670us-gaap:USGovernmentAgenciesDebtSecuritiesMember2024-01-012024-12-310001577670us-gaap:CommonStockMember2024-12-310001577670us-gaap:USTreasurySecuritiesMember2024-12-310001577670us-gaap:LandMember2025-03-310001577670us-gaap:LandMember2024-12-310001577670us-gaap:BuildingMember2025-03-310001577670us-gaap:BuildingMember2024-12-310001577670ladr:InPlaceLeasesAndOtherIntangiblesMember2025-03-310001577670ladr:InPlaceLeasesAndOtherIntangiblesMember2024-12-310001577670ladr:UndepreciatedRealEstateAndRelatedLeaseIntangiblesMember2025-03-310001577670ladr:UndepreciatedRealEstateAndRelatedLeaseIntangiblesMember2024-12-310001577670us-gaap:DisposalGroupHeldforsaleNotDiscontinuedOperationsMember2025-03-310001577670us-gaap:DisposalGroupHeldforsaleNotDiscontinuedOperationsMember2024-12-310001577670us-gaap:AboveMarketLeasesMember2025-01-012025-03-310001577670us-gaap:AboveMarketLeasesMember2024-01-012024-03-310001577670ladr:InplaceLeasesIntangiblesMember2025-03-310001577670ladr:AmortizationExpenseMember2025-03-310001577670ladr:LosAngelesCaliforniaMembersrt:MultifamilyMember2024-02-290001577670ladr:LosAngelesCaliforniaMembersrt:MultifamilyMember2024-02-012024-02-290001577670ladr:LosAngelesCaliforniaMembersrt:MultifamilyMemberus-gaap:RealEstateAcquiredInSatisfactionOfDebtMember2024-02-012024-02-290001577670ladr:JenksOklahomaMembersrt:RetailSiteMemberladr:DisposalProperties2024Member2025-03-012025-03-310001577670ladr:JenksOklahomaMembersrt:RetailSiteMemberladr:DisposalProperties2024Member2025-03-310001577670ladr:DisposalProperties2024Member2025-01-012025-03-310001577670ladr:DisposalProperties2024Member2025-03-310001577670ladr:CommittedMasterRepurchaseAgreementsMemberladr:MaturingOn27September2025Member2025-03-310001577670ladr:CommittedMasterRepurchaseAgreementsMemberladr:MaturingOn21October2027Member2025-03-310001577670ladr:CommittedMasterRepurchaseAgreementsMemberladr:MaturingOn3October2025Member2025-03-310001577670ladr:CommittedMasterRepurchaseAgreementsMemberladr:MaturingOn30April2026Member2025-03-310001577670ladr:CommittedMasterRepurchaseAgreementsMember2025-03-310001577670us-gaap:MortgagesMemberladr:MaturingOnVariousDateMember2025-03-310001577670us-gaap:CollateralizedLoanObligationsMemberladr:MaturingOnVariousDateMember2025-03-310001577670us-gaap:RevolvingCreditFacilityMemberladr:MaturingOn20December2028Member2025-03-310001577670ladr:SeniorUnsecuredNotesMemberladr:MaturingOnVariousDateMember2025-03-310001577670ladr:DebtObligationsMember2025-03-310001577670ladr:CommittedMasterRepurchaseAgreementsMemberladr:MaturingOn27September2025Member2024-12-310001577670ladr:CommittedMasterRepurchaseAgreementsMemberladr:MaturingOn21October2027Member2024-12-310001577670ladr:CommittedMasterRepurchaseAgreementsMemberladr:MaturingOn3October2025Member2024-12-310001577670ladr:CommittedMasterRepurchaseAgreementsMemberladr:MaturingOn22January2025Member2024-12-310001577670ladr:CommittedMasterRepurchaseAgreementsMemberladr:MaturingOn30April2026Member2024-12-310001577670ladr:CommittedMasterRepurchaseAgreementsMember2024-12-310001577670us-gaap:MortgagesMemberladr:MaturingOnVariousDateMember2024-12-310001577670us-gaap:CollateralizedLoanObligationsMemberladr:MaturingOnVariousDateMember2024-12-310001577670us-gaap:RevolvingCreditFacilityMemberladr:MaturingOn20December2028Member2024-12-310001577670ladr:SeniorUnsecuredNotesMemberladr:MaturingOnVariousDateMember2024-12-310001577670ladr:DebtObligationsMember2024-12-310001577670us-gaap:UnsecuredDebtMember2025-03-310001577670ladr:SeniorNotesDue2025Memberus-gaap:UnsecuredDebtMember2025-03-310001577670ladr:SeniorNotesDue2027Memberus-gaap:UnsecuredDebtMember2025-03-310001577670ladr:SeniorNotesDue2029Memberus-gaap:UnsecuredDebtMember2025-03-310001577670ladr:A7.00SeniorNoteDue2031Memberus-gaap:UnsecuredDebtMember2025-03-310001577670ladr:SeniorNotesDue2025Memberus-gaap:UnsecuredDebtMember2025-01-012025-03-310001577670ladr:SeniorNotesDue2027Memberus-gaap:UnsecuredDebtMember2025-01-012025-03-310001577670us-gaap:RevolvingCreditFacilityMember2025-01-020001577670us-gaap:RevolvingCreditFacilityMember2024-12-200001577670srt:MinimumMemberus-gaap:RevolvingCreditFacilityMember2024-12-202024-12-200001577670srt:MaximumMemberus-gaap:RevolvingCreditFacilityMember2024-12-202024-12-200001577670us-gaap:RevolvingCreditFacilityMemberus-gaap:LineOfCreditMember2025-03-310001577670ladr:NonRecourseNotesMemberus-gaap:CollateralizedLoanObligationsMember2021-07-132021-07-130001577670ladr:NonRecourseNotesMemberus-gaap:CollateralizedLoanObligationsMember2021-07-130001577670ladr:NonRecourseNotesMemberus-gaap:CollateralizedLoanObligationsMember2021-12-022021-12-020001577670ladr:NonRecourseNotesMemberus-gaap:CollateralizedLoanObligationsMember2021-12-020001577670ladr:CommittedMasterRepurchaseAgreementsMember2025-01-012025-03-310001577670ladr:UncommittedSecuritiesRepurchaseFacilitiesMember2025-03-310001577670us-gaap:MortgagesMember2025-03-310001577670us-gaap:MortgagesMember2024-12-310001577670us-gaap:MortgagesMember2024-01-012024-03-310001577670us-gaap:MortgagesMember2025-01-012025-03-310001577670ladr:MortgagesExecutedYMemberus-gaap:MortgagesMember2024-03-310001577670ladr:SeniorUnsecuredNotesMember2025-03-310001577670ladr:MortgageLoanReceivableFinancingMember2025-03-310001577670us-gaap:CollateralizedLoanObligationsMember2025-03-310001577670us-gaap:InterestRateCapMember2025-03-310001577670ladr:InterestRateFutureTenYearUSTreasuryNoteMember2025-03-310001577670us-gaap:FutureMember2025-03-310001577670us-gaap:InterestRateCapMember2024-12-310001577670us-gaap:PutOptionMember2024-12-310001577670us-gaap:CreditRiskContractMember2024-12-310001577670us-gaap:InterestRateCapMember2025-01-012025-03-310001577670us-gaap:FutureMember2025-01-012025-03-310001577670us-gaap:PutOptionMember2025-01-012025-03-310001577670us-gaap:InterestRateCapMember2024-01-012024-03-310001577670us-gaap:FutureMember2024-01-012024-03-310001577670us-gaap:PutOptionMember2024-01-012024-03-310001577670us-gaap:VariableInterestEntityPrimaryBeneficiaryMember2025-03-310001577670us-gaap:VariableInterestEntityPrimaryBeneficiaryMember2024-12-310001577670ladr:A2014ShareRepurchaseAuthorizationProgramMemberus-gaap:CommonClassAMember2024-04-240001577670ladr:A2014ShareRepurchaseAuthorizationProgramMemberus-gaap:CommonClassAMember2024-04-230001577670ladr:A2014ShareRepurchaseAuthorizationProgramMember2025-03-310001577670ladr:A2014ShareRepurchaseAuthorizationProgramMemberus-gaap:CommonClassAMemberus-gaap:SubsequentEventMember2025-04-230001577670ladr:A2014ShareRepurchaseAuthorizationProgramMemberus-gaap:CommonClassAMemberus-gaap:SubsequentEventMember2025-04-220001577670ladr:A2014ShareRepurchaseAuthorizationProgramMemberus-gaap:CommonClassAMember2024-12-310001577670ladr:A2014ShareRepurchaseAuthorizationProgramMemberus-gaap:CommonClassAMember2025-03-012025-03-310001577670ladr:A2014ShareRepurchaseAuthorizationProgramMemberus-gaap:CommonClassAMember2025-03-310001577670ladr:A2014ShareRepurchaseAuthorizationProgramMemberus-gaap:CommonClassAMember2023-12-310001577670ladr:A2014ShareRepurchaseAuthorizationProgramMemberus-gaap:CommonClassAMember2024-03-012024-03-310001577670ladr:A2014ShareRepurchaseAuthorizationProgramMemberus-gaap:CommonClassAMember2024-03-310001577670us-gaap:CorporateJointVentureMember2025-03-310001577670ladr:NoncontrollingInterestInConsolidatedVenturesMemberus-gaap:CorporateJointVentureMembersrt:MinimumMember2025-03-310001577670ladr:NoncontrollingInterestInConsolidatedVenturesMemberus-gaap:CorporateJointVentureMembersrt:MaximumMember2025-03-310001577670ladr:IslaVistaCaliforniaMemberladr:StudentHousingMemberus-gaap:CorporateJointVentureMember2025-03-310001577670ladr:OaklandCountyMichiganMembersrt:OfficeBuildingMemberus-gaap:CorporateJointVentureMember2025-03-310001577670us-gaap:RestrictedStockMemberus-gaap:CommonClassAMember2025-01-012025-03-310001577670us-gaap:RestrictedStockMemberus-gaap:CommonClassAMember2024-01-012024-03-310001577670us-gaap:RestrictedStockMember2024-12-310001577670us-gaap:EmployeeStockOptionMember2024-12-310001577670us-gaap:RestrictedStockMember2025-01-012025-03-310001577670us-gaap:EmployeeStockOptionMember2025-01-012025-03-310001577670us-gaap:RestrictedStockMember2025-03-310001577670us-gaap:EmployeeStockOptionMember2025-03-310001577670ladr:StockOptionsWarrantsAndRightsMember2025-03-310001577670ladr:OmnibusIncentivePlan2023Member2023-06-060001577670ladr:OmnibusIncentivePlan2014Member2023-06-060001577670ladr:OmnibusIncentivePlan2023Memberus-gaap:RestrictedStockMemberladr:NonManagementGranteeMember2025-02-280001577670ladr:OmnibusIncentivePlan2023Memberus-gaap:RestrictedStockMemberladr:PerformanceBasedVestingMemberladr:ManagementGranteesMember2025-02-012025-02-2800015776702025-02-182025-02-180001577670ladr:OmnibusIncentivePlan2023Memberus-gaap:RestrictedStockMemberladr:ManagementGranteesMemberus-gaap:CommonClassAMember2025-02-182025-02-180001577670ladr:ManagementGranteesMemberus-gaap:CommonClassAMemberladr:OmnibusIncentivePlan2023Memberus-gaap:RestrictedStockMemberladr:TimeAndPerformanceBasedVestingMember2025-02-182025-02-180001577670us-gaap:RestrictedStockMemberladr:TimeAndPerformanceBasedVestingMemberladr:ManagementGranteesMemberus-gaap:CommonClassAMember2025-02-182025-02-180001577670us-gaap:RestrictedStockMemberladr:NonManagementGranteeMemberus-gaap:CommonClassAMember2025-02-182025-02-180001577670ladr:NonManagementGranteeMemberladr:MrMiceliAndMsPorcellaMember2025-02-182025-02-180001577670ladr:TimeBasedVestingMemberladr:NonManagementGranteeMemberladr:OtherNonManagementGranteesMember2025-02-182025-02-180001577670ladr:PerformanceBasedVestingMemberladr:NonManagementGranteeMemberladr:OtherNonManagementGranteesMember2025-02-182025-02-180001577670us-gaap:RestrictedStockMemberladr:BoardOfDirectorsMemberus-gaap:CommonClassAMember2025-02-182025-02-180001577670ladr:OmnibusIncentivePlan2014Memberus-gaap:RestrictedStockMemberladr:NonManagementGranteeMember2024-02-290001577670ladr:OmnibusIncentivePlan2014Memberus-gaap:RestrictedStockMemberladr:NonManagementGranteeMember2023-02-2800015776702024-02-182024-02-180001577670ladr:OmnibusIncentivePlan2014Memberus-gaap:RestrictedStockMemberladr:ManagementGranteesMemberus-gaap:CommonClassAMember2024-02-182024-02-180001577670ladr:ManagementGranteesMemberus-gaap:CommonClassAMemberladr:OmnibusIncentivePlan2014Memberus-gaap:RestrictedStockMemberladr:TimeAndPerformanceBasedVestingMember2024-02-182024-02-180001577670us-gaap:RestrictedStockMemberladr:TimeAndPerformanceBasedVestingMemberladr:ManagementGranteesMemberus-gaap:CommonClassAMember2024-02-182024-02-180001577670us-gaap:RestrictedStockMemberladr:NonManagementGranteeMemberus-gaap:CommonClassAMember2024-02-182024-02-180001577670ladr:NonManagementGranteeMemberladr:MrMiceliAndMsPorcellaMember2024-02-182024-02-180001577670ladr:TimeBasedVestingMemberladr:NonManagementGranteeMemberladr:OtherNonManagementGranteesMember2024-02-182024-02-180001577670ladr:PerformanceBasedVestingMemberladr:NonManagementGranteeMemberladr:OtherNonManagementGranteesMember2024-02-182024-02-180001577670us-gaap:RestrictedStockMemberladr:BoardOfDirectorsMemberus-gaap:CommonClassAMember2024-02-182024-02-1800015776702023-02-182023-02-180001577670ladr:OmnibusIncentivePlan2014Memberus-gaap:RestrictedStockMemberladr:ManagementGranteesMemberus-gaap:CommonClassAMember2023-02-182023-02-180001577670ladr:ManagementGranteesMemberus-gaap:CommonClassAMemberladr:OmnibusIncentivePlan2014Memberus-gaap:RestrictedStockMemberladr:TimeAndPerformanceBasedVestingMember2023-02-182023-02-180001577670us-gaap:RestrictedStockMemberladr:TimeAndPerformanceBasedVestingMemberladr:ManagementGranteesMemberus-gaap:CommonClassAMember2023-02-182023-02-180001577670us-gaap:RestrictedStockMemberladr:NonManagementGranteeMemberus-gaap:CommonClassAMember2023-02-182023-02-180001577670ladr:NonManagementGranteeMemberladr:MrMiceliAndMsPorcellaMember2023-02-182023-02-180001577670ladr:TimeBasedVestingMemberladr:NonManagementGranteeMemberladr:OtherNonManagementGranteesMember2023-02-182023-02-180001577670ladr:PerformanceBasedVestingMemberladr:NonManagementGranteeMemberladr:OtherNonManagementGranteesMember2023-02-182023-02-180001577670us-gaap:RestrictedStockMemberladr:BoardOfDirectorsMemberus-gaap:CommonClassAMember2023-02-182023-02-180001577670ladr:OmnibusIncentivePlan2014Memberus-gaap:RestrictedStockMemberladr:PerformanceBasedVestingAndCatchUpProvisionMemberladr:ManagementGranteesMember2024-02-012024-02-290001577670ladr:OmnibusIncentivePlan2014Memberladr:ManagementGranteesMemberus-gaap:CommonClassAMemberladr:MsMcCormackAndMrPerelmanMember2024-02-182024-02-180001577670ladr:ManagementGranteesMemberus-gaap:CommonClassAMemberladr:OmnibusIncentivePlan2014Memberladr:PerformanceBasedVestingAndCatchUpProvisionMemberladr:MsMcCormackAndMrPerelmanMember2024-02-182024-02-180001577670ladr:ManagementGranteesMemberus-gaap:CommonClassAMemberladr:OmnibusIncentivePlan2014Memberladr:TimeBasedVestingMemberladr:MrMiceliAndMsPorcellaMember2024-02-182024-02-180001577670ladr:ManagementGranteesMemberus-gaap:CommonClassAMemberladr:OmnibusIncentivePlan2014Memberladr:PerformanceBasedVestingMemberladr:MrMiceliAndMsPorcellaMember2024-02-182024-02-180001577670ladr:OmnibusIncentivePlan2014Memberus-gaap:RestrictedStockMemberladr:PerformanceBasedVestingAndCatchUpProvisionMemberladr:ManagementGranteesMember2023-02-012023-02-280001577670ladr:OmnibusIncentivePlan2014Memberladr:ManagementGranteesMemberus-gaap:CommonClassAMemberladr:MsMcCormackAndMrPerelmanMember2023-02-182023-02-180001577670ladr:ManagementGranteesMemberus-gaap:CommonClassAMemberladr:OmnibusIncentivePlan2014Memberladr:PerformanceBasedVestingAndCatchUpProvisionMemberladr:MsMcCormackAndMrPerelmanMember2023-02-182023-02-180001577670ladr:ManagementGranteesMemberus-gaap:CommonClassAMemberladr:OmnibusIncentivePlan2014Memberladr:TimeBasedVestingMemberladr:MrMiceliAndMsPorcellaMember2023-02-182023-02-180001577670ladr:ManagementGranteesMemberus-gaap:CommonClassAMemberladr:OmnibusIncentivePlan2014Memberladr:PerformanceBasedVestingMemberladr:MrMiceliAndMsPorcellaMember2023-02-182023-02-180001577670ladr:OmnibusIncentivePlan2014Memberus-gaap:RestrictedStockMemberladr:PerformanceBasedVestingAndCatchUpProvisionMemberladr:ManagementGranteesMember2025-02-012025-02-280001577670ladr:OmnibusIncentivePlan2014Memberladr:ManagementGranteesMemberus-gaap:CommonClassAMemberladr:MsMcCormackAndMrPerelmanMember2025-02-012025-02-280001577670ladr:ManagementGranteesMemberus-gaap:CommonClassAMemberladr:OmnibusIncentivePlan2014Memberladr:PerformanceBasedVestingAndCatchUpProvisionMemberladr:MsMcCormackAndMrPerelmanMember2025-02-012025-02-280001577670ladr:ManagementGranteesMemberus-gaap:CommonClassAMemberladr:OmnibusIncentivePlan2014Memberladr:TimeBasedVestingMemberladr:MrMiceliAndMsPorcellaMember2025-02-012025-02-280001577670ladr:ManagementGranteesMemberus-gaap:CommonClassAMemberladr:OmnibusIncentivePlan2014Memberladr:PerformanceBasedVestingMemberladr:MrMiceliAndMsPorcellaMember2025-02-012025-02-280001577670us-gaap:FairValueMeasurementsRecurringMemberus-gaap:CommercialMortgageBackedSecuritiesMember2025-03-310001577670us-gaap:FairValueMeasurementsRecurringMemberladr:MeasurementInputYieldRateMemberladr:InternalModelValuationTechniqueMemberus-gaap:CommercialMortgageBackedSecuritiesMember2025-03-310001577670us-gaap:FairValueMeasurementsRecurringMemberus-gaap:MeasurementInputMaturityMemberladr:InternalModelValuationTechniqueMemberus-gaap:CommercialMortgageBackedSecuritiesMember2025-03-310001577670us-gaap:FairValueMeasurementsRecurringMemberladr:CommercialMortgageBackedSecuritiesInterestOnlyMember2025-03-310001577670us-gaap:FairValueMeasurementsRecurringMemberladr:MeasurementInputYieldRateMemberladr:InternalModelValuationTechniqueMemberladr:CommercialMortgageBackedSecuritiesInterestOnlyMember2025-03-310001577670us-gaap:FairValueMeasurementsRecurringMemberus-gaap:MeasurementInputMaturityMemberladr:InternalModelValuationTechniqueMemberladr:CommercialMortgageBackedSecuritiesInterestOnlyMember2025-03-310001577670us-gaap:FairValueMeasurementsRecurringMemberladr:GovernmentNationalMortgageAssociationCertificatesAndObligationsGNMAInterestOnlyMember2025-03-310001577670us-gaap:FairValueMeasurementsRecurringMemberladr:MeasurementInputYieldRateMemberladr:InternalModelValuationTechniqueMemberladr:GovernmentNationalMortgageAssociationCertificatesAndObligationsGNMAInterestOnlyMember2025-03-310001577670us-gaap:FairValueMeasurementsRecurringMemberus-gaap:MeasurementInputMaturityMemberladr:InternalModelValuationTechniqueMemberladr:GovernmentNationalMortgageAssociationCertificatesAndObligationsGNMAInterestOnlyMember2025-03-310001577670us-gaap:FairValueMeasurementsRecurringMemberus-gaap:USGovernmentAgenciesDebtSecuritiesMember2025-03-310001577670us-gaap:FairValueMeasurementsRecurringMemberladr:MeasurementInputYieldRateMemberladr:InternalModelValuationTechniqueMemberus-gaap:USGovernmentAgenciesDebtSecuritiesMember2025-03-310001577670us-gaap:FairValueMeasurementsRecurringMemberus-gaap:MeasurementInputMaturityMemberladr:InternalModelValuationTechniqueMemberus-gaap:USGovernmentAgenciesDebtSecuritiesMember2025-03-310001577670us-gaap:FairValueMeasurementsRecurringMemberus-gaap:EquitySecuritiesMember2025-03-310001577670us-gaap:FairValueMeasurementsRecurringMemberladr:MortgageLoanReceivablesHeldForInvestmentMember2025-03-310001577670us-gaap:FairValueMeasurementsRecurringMemberladr:MeasurementInputYieldRateMemberladr:DiscountedCashFlowValuationTechniqueMemberladr:MortgageLoanReceivablesHeldForInvestmentMember2025-03-310001577670us-gaap:FairValueMeasurementsRecurringMemberus-gaap:MeasurementInputMaturityMemberladr:DiscountedCashFlowValuationTechniqueMemberladr:MortgageLoanReceivablesHeldForInvestmentMember2025-03-310001577670us-gaap:FairValueMeasurementsRecurringMemberladr:MortgageLoanReceivablesHeldForSaleMember2025-03-310001577670us-gaap:FairValueMeasurementsRecurringMemberladr:MeasurementInputYieldRateMemberladr:InternalModelThirdPartyInputsValuationTechniqueMemberladr:MortgageLoanReceivablesHeldForSaleMember2025-03-310001577670us-gaap:FairValueMeasurementsRecurringMemberus-gaap:MeasurementInputMaturityMemberladr:InternalModelThirdPartyInputsValuationTechniqueMemberladr:MortgageLoanReceivablesHeldForSaleMember2025-03-310001577670us-gaap:FairValueMeasurementsRecurringMemberus-gaap:DerivativeFinancialInstrumentsAssetsMember2025-03-310001577670us-gaap:FairValueMeasurementsRecurringMemberus-gaap:MeasurementInputMaturityMemberladr:CounterpartyQuotationsValuationTechniqueMemberus-gaap:DerivativeFinancialInstrumentsAssetsMember2025-03-310001577670us-gaap:FairValueMeasurementsRecurringMemberladr:RepurchaseAgreementsShortTermMember2025-03-310001577670us-gaap:FairValueMeasurementsRecurringMemberladr:MeasurementInputYieldRateMemberladr:CostPlusAccruedInterestValuationTechniqueMemberladr:RepurchaseAgreementsShortTermMember2025-03-310001577670us-gaap:FairValueMeasurementsRecurringMemberus-gaap:MeasurementInputMaturityMemberladr:CostPlusAccruedInterestValuationTechniqueMemberladr:RepurchaseAgreementsShortTermMember2025-03-310001577670us-gaap:FairValueMeasurementsRecurringMemberus-gaap:MortgagesMember2025-03-310001577670us-gaap:FairValueMeasurementsRecurringMemberladr:MeasurementInputYieldRateMemberladr:DiscountedCashFlowValuationTechniqueMemberus-gaap:MortgagesMember2025-03-310001577670us-gaap:FairValueMeasurementsRecurringMemberus-gaap:MeasurementInputMaturityMemberladr:DiscountedCashFlowValuationTechniqueMemberus-gaap:MortgagesMember2025-03-310001577670us-gaap:FairValueMeasurementsRecurringMemberus-gaap:CollateralizedDebtObligationsMember2025-03-310001577670us-gaap:FairValueMeasurementsRecurringMemberladr:MeasurementInputYieldRateMemberladr:DiscountedCashFlowValuationTechniqueMemberus-gaap:CollateralizedDebtObligationsMember2025-03-310001577670us-gaap:FairValueMeasurementsRecurringMemberus-gaap:MeasurementInputMaturityMemberladr:DiscountedCashFlowValuationTechniqueMemberus-gaap:CollateralizedDebtObligationsMember2025-03-310001577670us-gaap:FairValueMeasurementsRecurringMemberus-gaap:SeniorNotesMember2025-03-310001577670us-gaap:FairValueMeasurementsRecurringMemberladr:MeasurementInputYieldRateMemberladr:InternalModelValuationTechniqueMemberus-gaap:SeniorNotesMember2025-03-310001577670us-gaap:FairValueMeasurementsRecurringMemberus-gaap:MeasurementInputMaturityMemberladr:InternalModelValuationTechniqueMemberus-gaap:SeniorNotesMember2025-03-310001577670us-gaap:FairValueMeasurementsRecurringMemberladr:DiscountedCashFlowValuationTechniqueMemberladr:MortgageLoanReceivablesHeldForInvestmentMember2025-03-310001577670ladr:MortgageLoanReceivablesHeldForInvestmentMember2025-01-012025-03-310001577670us-gaap:FairValueMeasurementsRecurringMemberus-gaap:CommercialMortgageBackedSecuritiesMember2024-12-310001577670us-gaap:FairValueMeasurementsRecurringMemberladr:MeasurementInputYieldRateMemberladr:InternalModelValuationTechniqueMemberus-gaap:CommercialMortgageBackedSecuritiesMember2024-12-310001577670us-gaap:FairValueMeasurementsRecurringMemberus-gaap:MeasurementInputMaturityMemberladr:InternalModelValuationTechniqueMemberus-gaap:CommercialMortgageBackedSecuritiesMember2024-12-310001577670us-gaap:FairValueMeasurementsRecurringMemberladr:CommercialMortgageBackedSecuritiesInterestOnlyMember2024-12-310001577670us-gaap:FairValueMeasurementsRecurringMemberladr:MeasurementInputYieldRateMemberladr:InternalModelValuationTechniqueMemberladr:CommercialMortgageBackedSecuritiesInterestOnlyMember2024-12-310001577670us-gaap:FairValueMeasurementsRecurringMemberus-gaap:MeasurementInputMaturityMemberladr:InternalModelValuationTechniqueMemberladr:CommercialMortgageBackedSecuritiesInterestOnlyMember2024-12-310001577670us-gaap:FairValueMeasurementsRecurringMemberladr:GovernmentNationalMortgageAssociationCertificatesAndObligationsGNMAInterestOnlyMember2024-12-310001577670us-gaap:FairValueMeasurementsRecurringMemberladr:MeasurementInputYieldRateMemberladr:InternalModelValuationTechniqueMemberladr:GovernmentNationalMortgageAssociationCertificatesAndObligationsGNMAInterestOnlyMember2024-12-310001577670us-gaap:FairValueMeasurementsRecurringMemberus-gaap:MeasurementInputMaturityMemberladr:InternalModelValuationTechniqueMemberladr:GovernmentNationalMortgageAssociationCertificatesAndObligationsGNMAInterestOnlyMember2024-12-310001577670us-gaap:FairValueMeasurementsRecurringMemberus-gaap:USGovernmentAgenciesDebtSecuritiesMember2024-12-310001577670us-gaap:FairValueMeasurementsRecurringMemberladr:MeasurementInputYieldRateMemberladr:InternalModelValuationTechniqueMemberus-gaap:USGovernmentAgenciesDebtSecuritiesMember2024-12-310001577670us-gaap:FairValueMeasurementsRecurringMemberus-gaap:MeasurementInputMaturityMemberladr:InternalModelValuationTechniqueMemberus-gaap:USGovernmentAgenciesDebtSecuritiesMember2024-12-310001577670us-gaap:FairValueMeasurementsRecurringMemberus-gaap:EquitySecuritiesMember2024-12-310001577670us-gaap:FairValueMeasurementsRecurringMemberladr:MortgageLoanReceivablesHeldForInvestmentMember2024-12-310001577670us-gaap:FairValueMeasurementsRecurringMemberladr:MeasurementInputYieldRateMemberladr:DiscountedCashFlowValuationTechniqueMemberladr:MortgageLoanReceivablesHeldForInvestmentMember2024-12-310001577670us-gaap:FairValueMeasurementsRecurringMemberus-gaap:MeasurementInputMaturityMemberladr:DiscountedCashFlowValuationTechniqueMemberladr:MortgageLoanReceivablesHeldForInvestmentMember2024-12-310001577670us-gaap:FairValueMeasurementsRecurringMemberladr:MortgageLoanReceivablesHeldForSaleMember2024-12-310001577670us-gaap:FairValueMeasurementsRecurringMemberladr:MeasurementInputYieldRateMemberladr:InternalModelThirdPartyInputsValuationTechniqueMemberladr:MortgageLoanReceivablesHeldForSaleMember2024-12-310001577670us-gaap:FairValueMeasurementsRecurringMemberus-gaap:MeasurementInputMaturityMemberladr:InternalModelThirdPartyInputsValuationTechniqueMemberladr:MortgageLoanReceivablesHeldForSaleMember2024-12-310001577670us-gaap:FairValueMeasurementsRecurringMemberus-gaap:DerivativeFinancialInstrumentsAssetsMember2024-12-310001577670us-gaap:FairValueMeasurementsRecurringMemberus-gaap:MeasurementInputMaturityMemberladr:CounterpartyQuotationsValuationTechniqueMemberus-gaap:DerivativeFinancialInstrumentsAssetsMember2024-12-310001577670us-gaap:FairValueMeasurementsRecurringMemberladr:RepurchaseAgreementsShortTermMember2024-12-310001577670us-gaap:FairValueMeasurementsRecurringMemberladr:MeasurementInputYieldRateMemberladr:CostPlusAccruedInterestValuationTechniqueMemberladr:RepurchaseAgreementsShortTermMember2024-12-310001577670us-gaap:FairValueMeasurementsRecurringMemberus-gaap:MeasurementInputMaturityMemberladr:CostPlusAccruedInterestValuationTechniqueMemberladr:RepurchaseAgreementsShortTermMember2024-12-310001577670us-gaap:FairValueMeasurementsRecurringMemberus-gaap:MortgagesMember2024-12-310001577670us-gaap:FairValueMeasurementsRecurringMemberladr:MeasurementInputYieldRateMemberladr:DiscountedCashFlowValuationTechniqueMemberus-gaap:MortgagesMember2024-12-310001577670us-gaap:FairValueMeasurementsRecurringMemberus-gaap:MeasurementInputMaturityMemberladr:DiscountedCashFlowValuationTechniqueMemberus-gaap:MortgagesMember2024-12-310001577670us-gaap:FairValueMeasurementsRecurringMemberus-gaap:CollateralizedDebtObligationsMember2024-12-310001577670us-gaap:FairValueMeasurementsRecurringMemberladr:MeasurementInputYieldRateMemberladr:DiscountedCashFlowValuationTechniqueMemberus-gaap:CollateralizedDebtObligationsMember2024-12-310001577670us-gaap:FairValueMeasurementsRecurringMemberus-gaap:MeasurementInputMaturityMemberladr:DiscountedCashFlowValuationTechniqueMemberus-gaap:CollateralizedDebtObligationsMember2024-12-310001577670us-gaap:FairValueMeasurementsRecurringMemberus-gaap:SeniorNotesMember2024-12-310001577670us-gaap:FairValueMeasurementsRecurringMemberladr:MeasurementInputYieldRateMemberladr:InternalModelValuationTechniqueMemberus-gaap:SeniorNotesMember2024-12-310001577670us-gaap:FairValueMeasurementsRecurringMemberus-gaap:MeasurementInputMaturityMemberladr:InternalModelValuationTechniqueMemberus-gaap:SeniorNotesMember2024-12-310001577670us-gaap:FairValueMeasurementsRecurringMemberladr:DiscountedCashFlowValuationTechniqueMemberladr:MortgageLoanReceivablesHeldForInvestmentMember2024-12-310001577670ladr:MortgageLoanReceivablesHeldForInvestmentMember2024-01-012024-12-310001577670us-gaap:FairValueMeasurementsRecurringMemberus-gaap:CommercialMortgageBackedSecuritiesMember2025-03-310001577670us-gaap:FairValueInputsLevel1Memberus-gaap:FairValueMeasurementsRecurringMemberus-gaap:CommercialMortgageBackedSecuritiesMember2025-03-310001577670us-gaap:FairValueInputsLevel2Memberus-gaap:FairValueMeasurementsRecurringMemberus-gaap:CommercialMortgageBackedSecuritiesMember2025-03-310001577670us-gaap:FairValueInputsLevel3Memberus-gaap:FairValueMeasurementsRecurringMemberus-gaap:CommercialMortgageBackedSecuritiesMember2025-03-310001577670us-gaap:FairValueMeasurementsRecurringMemberladr:CommercialMortgageBackedSecuritiesInterestOnlyMember2025-03-310001577670us-gaap:FairValueInputsLevel1Memberus-gaap:FairValueMeasurementsRecurringMemberladr:CommercialMortgageBackedSecuritiesInterestOnlyMember2025-03-310001577670us-gaap:FairValueInputsLevel2Memberus-gaap:FairValueMeasurementsRecurringMemberladr:CommercialMortgageBackedSecuritiesInterestOnlyMember2025-03-310001577670us-gaap:FairValueInputsLevel3Memberus-gaap:FairValueMeasurementsRecurringMemberladr:CommercialMortgageBackedSecuritiesInterestOnlyMember2025-03-310001577670us-gaap:FairValueMeasurementsRecurringMemberladr:GovernmentNationalMortgageAssociationCertificatesAndObligationsGNMAInterestOnlyMember2025-03-310001577670us-gaap:FairValueInputsLevel1Memberus-gaap:FairValueMeasurementsRecurringMemberladr:GovernmentNationalMortgageAssociationCertificatesAndObligationsGNMAInterestOnlyMember2025-03-310001577670us-gaap:FairValueInputsLevel2Memberus-gaap:FairValueMeasurementsRecurringMemberladr:GovernmentNationalMortgageAssociationCertificatesAndObligationsGNMAInterestOnlyMember2025-03-310001577670us-gaap:FairValueInputsLevel3Memberus-gaap:FairValueMeasurementsRecurringMemberladr:GovernmentNationalMortgageAssociationCertificatesAndObligationsGNMAInterestOnlyMember2025-03-310001577670us-gaap:FairValueMeasurementsRecurringMemberus-gaap:USGovernmentAgenciesDebtSecuritiesMember2025-03-310001577670us-gaap:FairValueInputsLevel1Memberus-gaap:FairValueMeasurementsRecurringMemberus-gaap:USGovernmentAgenciesDebtSecuritiesMember2025-03-310001577670us-gaap:FairValueInputsLevel2Memberus-gaap:FairValueMeasurementsRecurringMemberus-gaap:USGovernmentAgenciesDebtSecuritiesMember2025-03-310001577670us-gaap:FairValueInputsLevel3Memberus-gaap:FairValueMeasurementsRecurringMemberus-gaap:USGovernmentAgenciesDebtSecuritiesMember2025-03-310001577670us-gaap:FairValueInputsLevel1Memberus-gaap:FairValueMeasurementsRecurringMemberus-gaap:EquitySecuritiesMember2025-03-310001577670us-gaap:FairValueInputsLevel2Memberus-gaap:FairValueMeasurementsRecurringMemberus-gaap:EquitySecuritiesMember2025-03-310001577670us-gaap:FairValueInputsLevel3Memberus-gaap:FairValueMeasurementsRecurringMemberus-gaap:EquitySecuritiesMember2025-03-310001577670us-gaap:FairValueMeasurementsRecurringMemberus-gaap:EquitySecuritiesMember2025-03-310001577670us-gaap:FairValueMeasurementsRecurringMemberus-gaap:DerivativeFinancialInstrumentsAssetsMember2025-03-310001577670us-gaap:FairValueInputsLevel1Memberus-gaap:FairValueMeasurementsRecurringMemberus-gaap:DerivativeFinancialInstrumentsAssetsMember2025-03-310001577670us-gaap:FairValueInputsLevel2Memberus-gaap:FairValueMeasurementsRecurringMemberus-gaap:DerivativeFinancialInstrumentsAssetsMember2025-03-310001577670us-gaap:FairValueInputsLevel3Memberus-gaap:FairValueMeasurementsRecurringMemberus-gaap:DerivativeFinancialInstrumentsAssetsMember2025-03-310001577670us-gaap:FairValueInputsLevel1Memberus-gaap:FairValueMeasurementsRecurringMember2025-03-310001577670us-gaap:FairValueInputsLevel2Memberus-gaap:FairValueMeasurementsRecurringMember2025-03-310001577670us-gaap:FairValueInputsLevel3Memberus-gaap:FairValueMeasurementsRecurringMember2025-03-310001577670us-gaap:FairValueMeasurementsRecurringMember2025-03-310001577670ladr:MortgageLoanReceivablesHeldForInvestmentMember2025-03-310001577670us-gaap:FairValueInputsLevel1Memberladr:MortgageLoanReceivablesHeldForInvestmentMember2025-03-310001577670us-gaap:FairValueInputsLevel2Memberladr:MortgageLoanReceivablesHeldForInvestmentMember2025-03-310001577670us-gaap:FairValueInputsLevel3Memberladr:MortgageLoanReceivablesHeldForInvestmentMember2025-03-310001577670ladr:MortgageLoanReceivablesHeldForSaleMember2025-03-310001577670us-gaap:FairValueInputsLevel1Memberladr:MortgageLoanReceivablesHeldForSaleMember2025-03-310001577670us-gaap:FairValueInputsLevel2Memberladr:MortgageLoanReceivablesHeldForSaleMember2025-03-310001577670us-gaap:FairValueInputsLevel3Memberladr:MortgageLoanReceivablesHeldForSaleMember2025-03-310001577670us-gaap:CommercialMortgageBackedSecuritiesMember2025-03-310001577670us-gaap:FairValueInputsLevel1Memberus-gaap:CommercialMortgageBackedSecuritiesMember2025-03-310001577670us-gaap:FairValueInputsLevel2Memberus-gaap:CommercialMortgageBackedSecuritiesMember2025-03-310001577670us-gaap:FairValueInputsLevel3Memberus-gaap:CommercialMortgageBackedSecuritiesMember2025-03-310001577670ladr:CommercialMortgageBackedSecuritiesInterestOnlyMember2025-03-310001577670us-gaap:FairValueInputsLevel1Memberladr:CommercialMortgageBackedSecuritiesInterestOnlyMember2025-03-310001577670us-gaap:FairValueInputsLevel2Memberladr:CommercialMortgageBackedSecuritiesInterestOnlyMember2025-03-310001577670us-gaap:FairValueInputsLevel3Memberladr:CommercialMortgageBackedSecuritiesInterestOnlyMember2025-03-310001577670us-gaap:FairValueInputsLevel1Member2025-03-310001577670us-gaap:FairValueInputsLevel2Member2025-03-310001577670us-gaap:FairValueInputsLevel3Member2025-03-310001577670ladr:RepurchaseAgreementsShortTermMember2025-03-310001577670us-gaap:FairValueInputsLevel1Memberladr:RepurchaseAgreementsShortTermMember2025-03-310001577670us-gaap:FairValueInputsLevel2Memberladr:RepurchaseAgreementsShortTermMember2025-03-310001577670us-gaap:FairValueInputsLevel3Memberladr:RepurchaseAgreementsShortTermMember2025-03-310001577670us-gaap:MortgagesMember2025-03-310001577670us-gaap:FairValueInputsLevel1Memberus-gaap:MortgagesMember2025-03-310001577670us-gaap:FairValueInputsLevel2Memberus-gaap:MortgagesMember2025-03-310001577670us-gaap:FairValueInputsLevel3Memberus-gaap:MortgagesMember2025-03-310001577670us-gaap:CollateralizedDebtObligationsMember2025-03-310001577670us-gaap:FairValueInputsLevel1Memberus-gaap:CollateralizedDebtObligationsMember2025-03-310001577670us-gaap:FairValueInputsLevel2Memberus-gaap:CollateralizedDebtObligationsMember2025-03-310001577670us-gaap:FairValueInputsLevel3Memberus-gaap:CollateralizedDebtObligationsMember2025-03-310001577670us-gaap:SeniorNotesMember2025-03-310001577670us-gaap:FairValueInputsLevel1Memberus-gaap:SeniorNotesMember2025-03-310001577670us-gaap:FairValueInputsLevel2Memberus-gaap:SeniorNotesMember2025-03-310001577670us-gaap:FairValueInputsLevel3Memberus-gaap:SeniorNotesMember2025-03-310001577670us-gaap:FairValueInputsLevel2Memberus-gaap:SeniorNotesMember2024-12-310001577670us-gaap:FairValueMeasurementsRecurringMemberus-gaap:CommercialMortgageBackedSecuritiesMember2024-12-310001577670us-gaap:FairValueInputsLevel1Memberus-gaap:FairValueMeasurementsRecurringMemberus-gaap:CommercialMortgageBackedSecuritiesMember2024-12-310001577670us-gaap:FairValueInputsLevel2Memberus-gaap:FairValueMeasurementsRecurringMemberus-gaap:CommercialMortgageBackedSecuritiesMember2024-12-310001577670us-gaap:FairValueInputsLevel3Memberus-gaap:FairValueMeasurementsRecurringMemberus-gaap:CommercialMortgageBackedSecuritiesMember2024-12-310001577670us-gaap:FairValueMeasurementsRecurringMemberladr:CommercialMortgageBackedSecuritiesInterestOnlyMember2024-12-310001577670us-gaap:FairValueInputsLevel1Memberus-gaap:FairValueMeasurementsRecurringMemberladr:CommercialMortgageBackedSecuritiesInterestOnlyMember2024-12-310001577670us-gaap:FairValueInputsLevel2Memberus-gaap:FairValueMeasurementsRecurringMemberladr:CommercialMortgageBackedSecuritiesInterestOnlyMember2024-12-310001577670us-gaap:FairValueInputsLevel3Memberus-gaap:FairValueMeasurementsRecurringMemberladr:CommercialMortgageBackedSecuritiesInterestOnlyMember2024-12-310001577670us-gaap:FairValueMeasurementsRecurringMemberladr:GovernmentNationalMortgageAssociationCertificatesAndObligationsGNMAInterestOnlyMember2024-12-310001577670us-gaap:FairValueInputsLevel1Memberus-gaap:FairValueMeasurementsRecurringMemberladr:GovernmentNationalMortgageAssociationCertificatesAndObligationsGNMAInterestOnlyMember2024-12-310001577670us-gaap:FairValueInputsLevel2Memberus-gaap:FairValueMeasurementsRecurringMemberladr:GovernmentNationalMortgageAssociationCertificatesAndObligationsGNMAInterestOnlyMember2024-12-310001577670us-gaap:FairValueInputsLevel3Memberus-gaap:FairValueMeasurementsRecurringMemberladr:GovernmentNationalMortgageAssociationCertificatesAndObligationsGNMAInterestOnlyMember2024-12-310001577670us-gaap:FairValueMeasurementsRecurringMemberus-gaap:USGovernmentAgenciesDebtSecuritiesMember2024-12-310001577670us-gaap:FairValueInputsLevel1Memberus-gaap:FairValueMeasurementsRecurringMemberus-gaap:USGovernmentAgenciesDebtSecuritiesMember2024-12-310001577670us-gaap:FairValueInputsLevel2Memberus-gaap:FairValueMeasurementsRecurringMemberus-gaap:USGovernmentAgenciesDebtSecuritiesMember2024-12-310001577670us-gaap:FairValueInputsLevel3Memberus-gaap:FairValueMeasurementsRecurringMemberus-gaap:USGovernmentAgenciesDebtSecuritiesMember2024-12-310001577670us-gaap:FairValueInputsLevel1Memberus-gaap:FairValueMeasurementsRecurringMemberus-gaap:EquitySecuritiesMember2024-12-310001577670us-gaap:FairValueInputsLevel2Memberus-gaap:FairValueMeasurementsRecurringMemberus-gaap:EquitySecuritiesMember2024-12-310001577670us-gaap:FairValueInputsLevel3Memberus-gaap:FairValueMeasurementsRecurringMemberus-gaap:EquitySecuritiesMember2024-12-310001577670us-gaap:FairValueMeasurementsRecurringMemberus-gaap:EquitySecuritiesMember2024-12-310001577670us-gaap:FairValueMeasurementsRecurringMemberus-gaap:DerivativeFinancialInstrumentsAssetsMember2024-12-310001577670us-gaap:FairValueInputsLevel1Memberus-gaap:FairValueMeasurementsRecurringMemberus-gaap:DerivativeFinancialInstrumentsAssetsMember2024-12-310001577670us-gaap:FairValueInputsLevel2Memberus-gaap:FairValueMeasurementsRecurringMemberus-gaap:DerivativeFinancialInstrumentsAssetsMember2024-12-310001577670us-gaap:FairValueInputsLevel3Memberus-gaap:FairValueMeasurementsRecurringMemberus-gaap:DerivativeFinancialInstrumentsAssetsMember2024-12-310001577670us-gaap:FairValueInputsLevel1Memberus-gaap:FairValueMeasurementsRecurringMember2024-12-310001577670us-gaap:FairValueInputsLevel2Memberus-gaap:FairValueMeasurementsRecurringMember2024-12-310001577670us-gaap:FairValueInputsLevel3Memberus-gaap:FairValueMeasurementsRecurringMember2024-12-310001577670us-gaap:FairValueMeasurementsRecurringMember2024-12-310001577670ladr:MortgageLoanReceivablesHeldForInvestmentMember2024-12-310001577670us-gaap:FairValueInputsLevel1Memberladr:MortgageLoanReceivablesHeldForInvestmentMember2024-12-310001577670us-gaap:FairValueInputsLevel2Memberladr:MortgageLoanReceivablesHeldForInvestmentMember2024-12-310001577670us-gaap:FairValueInputsLevel3Memberladr:MortgageLoanReceivablesHeldForInvestmentMember2024-12-310001577670ladr:MortgageLoanReceivablesHeldForSaleMember2024-12-310001577670us-gaap:FairValueInputsLevel1Memberladr:MortgageLoanReceivablesHeldForSaleMember2024-12-310001577670us-gaap:FairValueInputsLevel2Memberladr:MortgageLoanReceivablesHeldForSaleMember2024-12-310001577670us-gaap:FairValueInputsLevel3Memberladr:MortgageLoanReceivablesHeldForSaleMember2024-12-310001577670us-gaap:CommercialMortgageBackedSecuritiesMember2024-12-310001577670us-gaap:FairValueInputsLevel1Memberus-gaap:CommercialMortgageBackedSecuritiesMember2024-12-310001577670us-gaap:FairValueInputsLevel2Memberus-gaap:CommercialMortgageBackedSecuritiesMember2024-12-310001577670us-gaap:FairValueInputsLevel3Memberus-gaap:CommercialMortgageBackedSecuritiesMember2024-12-310001577670ladr:CommercialMortgageBackedSecuritiesInterestOnlyMember2024-12-310001577670us-gaap:FairValueInputsLevel1Memberladr:CommercialMortgageBackedSecuritiesInterestOnlyMember2024-12-310001577670us-gaap:FairValueInputsLevel2Memberladr:CommercialMortgageBackedSecuritiesInterestOnlyMember2024-12-310001577670us-gaap:FairValueInputsLevel3Memberladr:CommercialMortgageBackedSecuritiesInterestOnlyMember2024-12-310001577670us-gaap:FairValueInputsLevel1Member2024-12-310001577670us-gaap:FairValueInputsLevel2Member2024-12-310001577670us-gaap:FairValueInputsLevel3Member2024-12-310001577670ladr:RepurchaseAgreementsShortTermMember2024-12-310001577670us-gaap:FairValueInputsLevel1Memberladr:RepurchaseAgreementsShortTermMember2024-12-310001577670us-gaap:FairValueInputsLevel2Memberladr:RepurchaseAgreementsShortTermMember2024-12-310001577670us-gaap:FairValueInputsLevel3Memberladr:RepurchaseAgreementsShortTermMember2024-12-310001577670us-gaap:MortgagesMember2024-12-310001577670us-gaap:FairValueInputsLevel1Memberus-gaap:MortgagesMember2024-12-310001577670us-gaap:FairValueInputsLevel2Memberus-gaap:MortgagesMember2024-12-310001577670us-gaap:FairValueInputsLevel3Memberus-gaap:MortgagesMember2024-12-310001577670us-gaap:CollateralizedDebtObligationsMember2024-12-310001577670us-gaap:FairValueInputsLevel1Memberus-gaap:CollateralizedDebtObligationsMember2024-12-310001577670us-gaap:FairValueInputsLevel2Memberus-gaap:CollateralizedDebtObligationsMember2024-12-310001577670us-gaap:FairValueInputsLevel3Memberus-gaap:CollateralizedDebtObligationsMember2024-12-310001577670us-gaap:SeniorNotesMember2024-12-310001577670us-gaap:FairValueInputsLevel1Memberus-gaap:SeniorNotesMember2024-12-310001577670us-gaap:FairValueInputsLevel3Memberus-gaap:SeniorNotesMember2024-12-310001577670ladr:MortgageLoanReceivablesHeldForInvestmentMember2025-03-310001577670ladr:MortgageLoanReceivablesHeldForInvestmentMember2024-12-310001577670ladr:USTreasurySecuritiesTradedNotYetSettledMember2025-03-310001577670ladr:USTreasurySecuritiesTradedNotYetSettledMember2024-12-310001577670us-gaap:OperatingSegmentsMemberladr:LoansSegmentMember2025-01-012025-03-310001577670us-gaap:OperatingSegmentsMemberladr:AvailableForSaleSecuritiesSegmentMember2025-01-012025-03-310001577670us-gaap:OperatingSegmentsMemberladr:RealEstateSegmentMember2025-01-012025-03-310001577670us-gaap:CorporateNonSegmentMember2025-01-012025-03-310001577670us-gaap:OperatingSegmentsMemberladr:LoansSegmentMember2025-03-310001577670us-gaap:OperatingSegmentsMemberladr:AvailableForSaleSecuritiesSegmentMember2025-03-310001577670us-gaap:OperatingSegmentsMemberladr:RealEstateSegmentMember2025-03-310001577670us-gaap:CorporateNonSegmentMember2025-03-310001577670us-gaap:OperatingSegmentsMemberladr:LoansSegmentMember2024-01-012024-03-310001577670us-gaap:OperatingSegmentsMemberladr:AvailableForSaleSecuritiesSegmentMember2024-01-012024-03-310001577670us-gaap:OperatingSegmentsMemberladr:RealEstateSegmentMember2024-01-012024-03-310001577670us-gaap:CorporateNonSegmentMember2024-01-012024-03-310001577670us-gaap:OperatingSegmentsMemberladr:LoansSegmentMember2024-12-310001577670us-gaap:OperatingSegmentsMemberladr:AvailableForSaleSecuritiesSegmentMember2024-12-310001577670us-gaap:OperatingSegmentsMemberladr:RealEstateSegmentMember2024-12-310001577670us-gaap:CorporateNonSegmentMember2024-12-310001577670ladr:SeniorUnsecuredNotesMemberus-gaap:CorporateNonSegmentMember2024-12-310001577670ladr:SeniorUnsecuredNotesMemberus-gaap:CorporateNonSegmentMember2025-03-31
UNITED STATES
SECURITIES AND EXCHANGE COMMISSION
Washington, D.C. 20549
Form 10-Q
(Mark One)
☒ QUARTERLY REPORT PURSUANT TO SECTION 13 OR 15(d) OF THE SECURITIES EXCHANGE ACT OF 1934
For the quarterly period ended March 31, 2025
Or
☐ TRANSITION REPORT PURSUANT TO SECTION 13 OR 15(d) OF THE SECURITIES EXCHANGE ACT OF 1934
For the transition period from to
Commission file number:
001-36299
Ladder Capital Corp
(Exact name of registrant as specified in its charter)
| | | | | | | | | | | | | | |
| Delaware | | 80-0925494 |
(State or other jurisdiction of
incorporation or organization) | | (IRS Employer
Identification No.) |
| | | | |
| 320 Park Avenue, | New York, | NY | | 10022 |
| (Address of principal executive offices) | | (Zip Code) |
(212) 715-3170
(Registrant’s telephone number, including area code)
Securities registered pursuant to Section 12(b) of the Act:
| | | | | | | | |
| Title of Each Class | Trading Symbol(s) | Name of Each Exchange on Which Registered |
| Class A common stock, $0.001 par value | LADR | New York Stock Exchange |
Indicate by check mark whether the registrant (1) has filed all reports required to be filed by Section 13 or 15(d) of the Securities Exchange Act of 1934 during the preceding 12 months (or for such shorter period that the registrant was required to file such reports), and (2) has been subject to such filing requirements for the past 90 days. Yes ☒ No ☐
Indicate by check mark whether the registrant has submitted electronically every Interactive Data File required to be submitted pursuant to Rule 405 of Regulation S-T (§ 232.405 of this chapter) during the preceding 12 months (or for such shorter period that the registrant was required to submit such files). Yes ☒ No ☐
Indicate by check mark whether the registrant is a large accelerated filer, an accelerated filer, a non-accelerated filer, a smaller reporting company, or an emerging growth company. See the definitions of “large accelerated filer,” “accelerated filer,” “smaller reporting company” and “emerging growth company” in Rule 12b-2 of the Exchange Act:
| | | | | | | | | | | |
| Large accelerated filer | ☒ | Accelerated filer | ☐ |
| | | | |
| Non-accelerated filer | ☐ | Smaller reporting company | ☐ |
| | | |
| | Emerging growth company | ☐ |
If an emerging growth company, indicate by check mark if the registrant has elected not to use the extended transition period for complying with any new or revised financial accounting standards provided pursuant to Section 13(a) of the Exchange Act. ☐
Indicate by check mark whether the registrant is a shell company (as defined in Rule 12b-2 of the Exchange Act):
Yes ☐ No ☒
Indicate the number of shares outstanding of each of the registrant’s classes of common stock, as of the latest practicable date.
| | | | | | | | |
| Class | | Outstanding at April 18, 2025 |
| Class A common stock, $0.001 par value | | 128,096,466 |
| Class B common stock, $0.001 par value | | — |
LADDER CAPITAL CORP
FORM 10-Q
March 31, 2025
CAUTIONARY STATEMENT REGARDING FORWARD-LOOKING STATEMENTS
This Quarterly Report on Form 10-Q (this “Quarterly Report”) includes forward-looking statements within the meaning of Section 27A of the Securities Act of 1933, as amended (the “Securities Act”), and Section 21E of the Securities Exchange Act of 1934, as amended (the “Exchange Act”). All statements other than statements of historical fact contained in this Quarterly Report, including statements regarding our future results of operations and financial position, strategy and plans, and our expectations for future operations, are forward-looking statements. The words “anticipate,” “estimate,” “expect,” “project,” “plan,” “intend,” “believe,” “may,” “might,” “will,” “should,” “can have,” “likely,” “continue,” “design,” and other words and terms of similar expressions are intended to identify forward-looking statements.
We have based these forward-looking statements largely on our current expectations and projections about future events and trends that we believe may affect our financial condition, results of operations, strategy, short-term and long-term business operations and objectives and financial needs. Although we believe that the expectations reflected in our forward-looking statements are reasonable, actual results could differ from those expressed in our forward-looking statements. Our future financial position and results of operations, as well as any forward-looking statements are subject to change and inherent risks and uncertainties. You should consider our forward-looking statements in light of a number of factors that may cause actual results to vary from our forward-looking statements including, but not limited to:
•risks discussed under the heading “Risk Factors” herein and in our Annual Report on Form 10-K for the year ended December 31, 2024 (“the Annual Report”), as well as our consolidated financial statements, related notes, and the other financial information appearing elsewhere in this Quarterly Report and our other filings with the United States Securities and Exchange Commission (the “SEC”);
•heightened market volatility driven by escalating global trade tensions and increased tariffs;
•actions by the new U.S. presidential administration that have contributed to increased policy uncertainty, impacting the regulatory landscape, capital markets, and consumer confidence;
•labor shortages, supply chain imbalances, inflation, and the potential for a global economic recession or further downgrades to the credit ratings of the U.S.;
•increasing geopolitical uncertainty, including the broader impacts of the Ukraine-Russia and Hamas-Israel conflicts and escalating global tensions such as those between the U.S. and China;
•changes or volatility in general economic conditions and in the commercial finance and the real estate markets;
•changes in credit spreads;
•changes to our business and investment strategy and increased operating costs;
•our ability to obtain and maintain financing arrangements;
•the financing and advance rates for our assets, including the potential need for additional collateral;
•our actual and expected leverage and liquidity;
•the availability of investment opportunities in mortgage-related and real estate-related instruments and other securities;
•the adequacy and performance of collateral securing our loan portfolio and a decline in the fair value of our assets;
•interest rate and duration mismatches between our assets and our borrowings used to fund such investments;
•changes in interest rates affecting the market value of our assets and the related impacts on our borrowers;
•changes in prepayment rates on our mortgages and the loans underlying our commercial mortgage-backed and other asset-backed securities;
•the effects of hedging instruments and the degree to which our hedging strategies may or may not protect us from interest rate and credit risk volatility;
•the increased rate of default and non-accrual or decreased recovery rates on our assets and the potential insufficiency of our provision for loan loss reserves;
•the adequacy of our policies, procedures and systems for managing risk effectively;
•a potential downgrade in the credit ratings assigned to subsidiaries of Ladder Capital Corp (“Ladder,” “Ladder Capital,” and the “Company”) or our investments or corporate debt;
•our compliance with, and the impact of, and changes in laws, governmental regulations, tax laws and rates, accounting guidance and similar matters;
•our ability to maintain our qualification as a real estate investment trust (“REIT”) for U.S. federal income tax purposes and our ability and the ability of our subsidiaries to operate in compliance with REIT requirements;
•our ability and the ability of our subsidiaries to maintain our and their exemptions from registration under the Investment Company Act of 1940, as amended (the “Investment Company Act”);
•the effects of climate change or the potential liability relating to environmental matters that impact the value of properties we may acquire or the properties underlying our investments;
•the inability of insurance covering real estate underlying our loans and investments to cover all losses;
•fraud by potential borrowers or their inability to complete their business plans;
•our ability to attract and retain qualified originators;
•cybersecurity risks, including the possibility of system outages resulting from cyber incidents;
•our ability to maintain strategic business alliances;
•the impact of any tax legislation or IRS guidance;
•volatility in the equity capital markets and the impact on our Class A common stock;
•the degree and nature of our competition; and
•the market trends in our industry, interest rates, real estate values and the debt securities markets.
You should not rely upon forward-looking statements as predictions of future events. In addition, neither we nor any other person assumes responsibility for the accuracy and completeness of any of these forward-looking statements. The forward-looking statements contained in this Quarterly Report are made as of the date hereof, and the Company assumes no obligation to update or supplement any forward-looking statements. New risks and uncertainties arise over time and it is not possible to predict those events or how they may affect us in the future.
REFERENCES TO LADDER CAPITAL CORP
Ladder Capital Corp is a holding company, and its primary assets are a controlling equity interest in Ladder Capital Finance Holdings LLLP (“LCFH”) and in each series thereof, directly or indirectly. Unless the context suggests otherwise, references in this report to “Ladder,” “Ladder Capital,” the “Company,” “we,” “us” and “our” refer to Ladder Capital Corp and its consolidated subsidiaries.
Part I - Financial Information
Item 1. Financial Statements (Unaudited)
The consolidated financial statements of Ladder Capital Corp and the notes related to the foregoing consolidated financial statements are included in this Item.
Index to Consolidated Financial Statements (Unaudited)
Ladder Capital Corp
Consolidated Balance Sheets
(Dollars in Thousands)
| | | | | | | | | | | |
| | March 31,
2025(1) | | December 31,
2024(1) |
| (Unaudited) | | |
| Assets | | | |
| Cash and cash equivalents | $ | 479,770 | | | $ | 1,323,481 | |
| Restricted cash | 13,731 | | | 12,608 | |
| Mortgage loan receivables held for investment, net, at amortized cost: | | | |
| Mortgage loans receivable | 1,665,243 | | | 1,591,322 | |
| | | |
| Allowance for credit losses | (52,208) | | | (52,323) | |
| Mortgage loan receivables held for sale | 90,420 | | | 26,898 | |
| Securities | 1,476,380 | | | 1,080,839 | |
| | | |
| Real estate and related lease intangibles, net | 654,709 | | | 670,803 | |
| | | |
| Investments in and advances to unconsolidated ventures | 19,191 | | | 19,923 | |
| | | |
| Derivative instruments | 467 | | | 437 | |
| | | |
| Accrued interest receivable | 15,274 | | | 12,936 | |
| Other assets | 107,022 | | | 158,149 | |
| Total assets | $ | 4,469,999 | | | $ | 4,845,073 | |
| Liabilities and Equity | | | |
| Liabilities | | | |
| | | |
| Debt obligations, net | $ | 2,769,754 | | | $ | 3,135,617 | |
| | | |
| | | |
| | | |
| | | |
| | | |
| | | |
| Dividends payable | 30,593 | | | 31,838 | |
| Accrued expenses | 45,412 | | | 74,824 | |
| Other liabilities | 109,883 | | | 69,855 | |
| Total liabilities | 2,955,642 | | | 3,312,134 | |
Commitments and contingencies (refer to Note 17) | — | | | — | |
| Equity | | | |
Class A common stock, par value $0.001 per share, 600,000,000 shares authorized; 130,790,591 and 129,883,019 shares issued and 128,096,466 and 127,106,481 shares outstanding as of March 31, 2025 and December 31, 2024, respectively. | 128 | | | 127 | |
| | | |
| Additional paid-in capital | 1,778,311 | | | 1,777,118 | |
Treasury stock, 2,694,125 and 2,776,538 shares, at cost | (29,964) | | | (30,475) | |
| Retained earnings (dividends in excess of earnings) | (224,592) | | | (206,874) | |
| Accumulated other comprehensive income (loss) | (7,215) | | | (4,866) | |
| Total shareholders’ equity | 1,516,668 | | | 1,535,030 | |
| | | |
| Noncontrolling interests in consolidated ventures | (2,311) | | | (2,091) | |
| Total equity | 1,514,357 | | | 1,532,939 | |
| Total liabilities and equity | $ | 4,469,999 | | | $ | 4,845,073 | |
(1)Includes amounts relating to consolidated variable interest entities. Refer to Note 2 and Note 9.
Refer to the accompanying notes to consolidated financial statements.
Ladder Capital Corp
Consolidated Statements of Income
(Dollars in Thousands, Except Per Share Data)
(Unaudited)
| | | | | | | | | | | | | | | | | |
| | Three Months Ended March 31, | | |
| | 2025 | | 2024 | | | | | | |
| | | | | | | | | |
| Net interest income | | | | | | | | | |
| Interest income | $ | 64,326 | | | $ | 95,912 | | | | | | | |
| Interest expense | 43,997 | | | 58,771 | | | | | | | |
| Net interest income (expense) | 20,329 | | | 37,141 | | | | | | | |
| Provision for (release of) loan loss reserves, net | (81) | | | 5,768 | | | | | | | |
| Net interest income (expense) after provision for (release of) loan loss reserves | 20,410 | | | 31,373 | | | | | | | |
| Other income (loss) | | | | | | | | | |
| Real estate operating income | 21,773 | | | 23,887 | | | | | | | |
| | | | | | | | | |
| | | | | | | | | |
| Net result from mortgage loan receivables held for sale | 162 | | | 87 | | | | | | | |
| | | | | | | | | |
| | | | | | | | | |
| | | | | | | | | |
| Gain (loss) on real estate, net | 3,807 | | | — | | | | | | | |
| | | | | | | | | |
| Fee and other income | 5,285 | | | 3,700 | | | | | | | |
| Net result from derivative transactions | 323 | | | 4,019 | | | | | | | |
| Earnings (loss) from investment in unconsolidated ventures | (732) | | | (15) | | | | | | | |
| | | | | | | | | |
| Gain on extinguishment of debt | 256 | | | 177 | | | | | | | |
| Total other income (loss) | 30,874 | | | 31,855 | | | | | | | |
| Costs and expenses | | | | | | | | | |
| Compensation and employee benefits | 18,761 | | | 20,789 | | | | | | | |
| Operating expenses | 4,516 | | | 4,643 | | | | | | | |
| Real estate operating expenses | 8,766 | | | 9,146 | | | | | | | |
| Investment related expenses | 1,188 | | | 1,993 | | | | | | | |
| Depreciation and amortization | 7,336 | | | 8,302 | | | | | | | |
| Total costs and expenses | 40,567 | | | 44,873 | | | | | | | |
| Income (loss) before taxes | 10,717 | | | 18,355 | | | | | | | |
| Income tax expense (benefit) | (838) | | | 1,925 | | | | | | | |
| Net income (loss) | 11,555 | | | 16,430 | | | | | | | |
| Net (income) loss attributable to noncontrolling interests in consolidated ventures | 220 | | | 179 | | | | | | | |
| | | | | | | | | |
| | | | | | | | | |
| Net income (loss) attributable to Class A common shareholders | $ | 11,775 | | | $ | 16,609 | | | | | | | |
| | | | | | | | | |
| | | | | | | | | |
| | |
| | | | | | | | | |
| | | | | | | | | |
| Earnings per share: | | | | | | | | | |
| Basic | $ | 0.09 | | | $ | 0.13 | | | | | | | |
| Diluted | $ | 0.09 | | | $ | 0.13 | | | | | | | |
| | | | | | | | | |
| Weighted average shares outstanding: | | | | | | | | | |
| Basic | 125,628,951 | | | 125,315,765 | | | | | | | |
| Diluted | 126,279,680 | | | 125,520,373 | | | | | | | |
| | | | | | | | | |
| | | | | | | | | |
Refer to the accompanying notes to consolidated financial statements.
Ladder Capital Corp
Consolidated Statements of Comprehensive Income
(Dollars in Thousands)
(Unaudited)
| | | | | | | | | | | | | | | | | |
| | Three Months Ended March 31, | | |
| | 2025 | | 2024 | | | | | | |
| Net income (loss) | $ | 11,555 | | | $ | 16,430 | | | | | | | |
| Other comprehensive income (loss) | | | | | | | | | |
| Gain (loss) on available for sale securities, net of tax: | | | | | | | | | |
| Unrealized gain (loss) on securities, available for sale | (2,169) | | | 4,054 | | | | | | | |
| Reclassification adjustment for (gain) loss included in net income (loss) | (180) | | | (21) | | | | | | | |
| | | | | | | | | |
| Total other comprehensive income (loss) | (2,349) | | | 4,033 | | | | | | | |
| | | | | | | | | |
| Comprehensive income (loss) | 9,206 | | | 20,463 | | | | | | | |
| Comprehensive (income) loss attributable to noncontrolling interest in consolidated ventures | 220 | | | 179 | | | | | | | |
| | | | | | | | | |
| | | | | | | | | |
| | | | | | | | | |
| Comprehensive income (loss) attributable to Class A common shareholders | $ | 9,426 | | | $ | 20,642 | | | | | | | |
Refer to the accompanying notes to consolidated financial statements.
Ladder Capital Corp
Consolidated Statements of Changes in Equity
(Dollars and Shares in Thousands)
(Unaudited)
| | | | | | | | | | | | | | | | | | | | | | | | | | | | | | | | | | | | | | | | | | | | | | | |
| | Shareholders’ Equity | | | | |
| | Class A Common Stock | | Additional Paid- in-Capital | | Treasury Stock | | Retained Earnings (Dividends in Excess of Earnings) | | Accumulated Other Comprehensive Income (Loss) | | Noncontrolling Interests | | Total Equity |
Shares | | Par | | | | | | Consolidated Ventures | |
| Balance, December 31, 2024 | 127,106 | | | $ | 127 | | | $ | 1,777,118 | | | $ | (30,475) | | | $ | (206,874) | | | $ | (4,866) | | | $ | (2,091) | | | $ | 1,532,939 | |
| | | | | | | | | | | | | | | |
| | | | | | | | | | | | | | | |
| | | | | | | | | | | | | | | |
| Amortization of equity based compensation | — | | | — | | | 11,215 | | | — | | | — | | | — | | | — | | | 11,215 | |
| | | | | | | | | | | | | | | |
| Grants of restricted stock | 1,820 | | | 2 | | | (10,022) | | | 10,022 | | | | | — | | | — | | | 2 | |
| Purchase of treasury stock | (71) | | | — | | | — | | | (805) | | | — | | | — | | | — | | | (805) | |
| | | | | | | | | | | | | | | |
| Shares acquired to satisfy minimum required federal and state tax withholding on vesting restricted stock | (760) | | | (1) | | | — | | | (8,706) | | | — | | | — | | | — | | | (8,707) | |
| | | | | | | | | | | | | | | |
| Dividends declared | — | | | — | | | — | | | — | | | (29,493) | | | — | | | — | | | (29,493) | |
| | | | | | | | | | | | | | | |
| | | | | | | | | | | | | | | |
| | | | | | | | | | | | | | | |
| | | | | | | | | | | | | | | |
| Net income (loss) | — | | | — | | | — | | | — | | | 11,775 | | | — | | | (220) | | | 11,555 | |
| Other comprehensive income (loss) | — | | | — | | | — | | | — | | | — | | | (2,349) | | | — | | | (2,349) | |
| | | | | | | | | | | | | | | |
| Balance, March 31, 2025 | 128,096 | | | $ | 128 | | | $ | 1,778,311 | | | $ | (29,964) | | | $ | (224,592) | | | $ | (7,215) | | | $ | (2,311) | | | $ | 1,514,357 | |
Refer to the accompanying notes to consolidated financial statements.
Ladder Capital Corp
Consolidated Statements of Changes in Equity
(Dollars and Shares in Thousands)
(Unaudited)
| | | | | | | | | | | | | | | | | | | | | | | | | | | | | | | | | | | | | | | | | | | | | | | |
| | Shareholders’ Equity | | | | |
| | Class A Common Stock | | Additional Paid- in-Capital | | Treasury Stock | | Retained Earnings (Dividends in Excess of Earnings) | | Accumulated Other Comprehensive Income (Loss) | | Noncontrolling Interests | | Total Equity |
Shares | | Par | | | | | | Consolidated Ventures | |
| Balance, December 31, 2023 | 126,912 | | | $ | 127 | | | $ | 1,756,750 | | | $ | (12,001) | | | $ | (197,875) | | | $ | (13,853) | | | $ | (950) | | | $ | 1,532,198 | |
| Distributions | — | | | — | | | — | | | — | | | — | | | — | | | (200) | | | (200) | |
| | | | | | | | | | | | | | | |
| Amortization of equity based compensation | — | | | — | | | 10,298 | | | — | | | — | | | — | | | — | | | 10,298 | |
| | | | | | | | | | | | | | | |
| Grants of restricted stock | 1,856 | | | 2 | | | — | | | — | | | — | | | — | | | — | | | 2 | |
| | | | | | | | | | | | | | | |
| Purchase of treasury stock | (60) | | | — | | | — | | | (647) | | | — | | | — | | | — | | | (647) | |
| | | | | | | | | | | | | | | |
| Shares acquired to satisfy minimum required federal and state tax withholding on vesting restricted stock | (813) | | | (1) | | | — | | | (8,883) | | | — | | | — | | | — | | | (8,884) | |
| Forfeitures | (7) | | | — | | | 80 | | | (80) | | | — | | | — | | | — | | | — | |
| Dividends declared | — | | | — | | | — | | | — | | | (29,345) | | | — | | | — | | | (29,345) | |
| | | | | | | | | | | | | | | |
| | | | | | | | | | | | | | | |
| | | | | | | | | | | | | | | |
| | | | | | | | | | | | | | | |
| | | | | | | | | | | | | | | |
| Net income (loss) | — | | | — | | | — | | | — | | | 16,609 | | | — | | | (179) | | | 16,430 | |
| Other comprehensive income (loss) | — | | | — | | | — | | | — | | | — | | | 4,033 | | | — | | | 4,033 | |
| Balance, March 31, 2024 | 127,888 | | | $ | 128 | | | $ | 1,767,128 | | | $ | (21,611) | | | $ | (210,611) | | | $ | (9,820) | | | $ | (1,329) | | | $ | 1,523,885 | |
Refer to the accompanying notes to consolidated financial statements.
Ladder Capital Corp
Consolidated Statements of Cash Flows
(Dollars in Thousands)
(Unaudited) | | | | | | | | | | | | | |
| | Three Months Ended March 31, |
| | 2025 | | 2024 | | |
| Cash flows from operating activities: | | | | | |
| Net income (loss) | $ | 11,555 | | | $ | 16,430 | | | |
| Adjustments to reconcile net income (loss) to net cash provided by (used in) operating activities: | | | | | |
| (Gain) loss on extinguishment of debt | (256) | | | (177) | | | |
| Depreciation and amortization | 7,336 | | | 8,302 | | | |
| | | | | |
| Unrealized (gain) loss on derivative instruments | (35) | | | 780 | | | |
| Unrealized (gain) loss on securities | (687) | | | — | | | |
| | | | | |
| | | | | |
| Provision for (release of) loan loss reserves, net | (81) | | | 5,768 | | | |
| | | | | |
| Amortization of equity based compensation | 11,215 | | | 10,298 | | | |
| Amortization of deferred financing costs included in interest expense | 2,369 | | | 2,999 | | | |
| Amortization of (premium)/discount on mortgage loan financing included in interest expense | (178) | | | (151) | | | |
| Amortization of above- and below-market lease intangibles | (402) | | | (432) | | | |
| | | | | |
| (Accretion)/amortization of discount, premium and other fees on mortgage loans receivable | (2,747) | | | (4,040) | | | |
| (Accretion)/amortization of discount and premium on securities | (476) | | | (306) | | | |
| Net result from mortgage loan receivables held for sale | (162) | | | (87) | | | |
| | | | | |
| | | | | |
| Realized (gain) loss on securities | (541) | | | (53) | | | |
| (Gain) loss on real estate, net | (3,807) | | | — | | | |
| | | | | |
| | | | | |
| (Earnings) loss from investments in unconsolidated ventures in excess of distributions received | 732 | | | 15 | | | |
| | | | | |
| | | | | |
| Origination of mortgage loan receivables held for sale | (63,360) | | | — | | | |
| | | | | |
| | | | | |
| | | | | |
| | | | | |
| | | | | |
| Change in deferred tax asset (liability) | (459) | | | 1,344 | | | |
| | | | | |
| Changes in operating assets and liabilities: | | | | | |
| | | | | |
| | | | | |
| Accrued interest receivable | (2,338) | | | 1,026 | | | |
| Other assets | (609) | | | 1,230 | | | |
| Accrued expenses and other liabilities | 14,204 | | | (63,321) | | | |
| Net cash provided by (used in) operating activities | (28,727) | | | (20,375) | | | |
| | | | | |
| Cash flows from investing activities: | | | | | |
| | | | | |
| Origination and funding of mortgage loan receivables held for investment | (253,048) | | | (48,702) | | | |
| | | | | |
| Repayment of mortgage loan receivables held for investment | 264,008 | | | 362,854 | | | |
| | | | | |
| Purchases of securities | (521,803) | | | (70,603) | | | |
| Repayment of securities | 84,477 | | | 88,147 | | | |
| Basis recovery of interest-only securities | 496 | | | 888 | | | |
| Proceeds from sales of securities | 39,880 | | | 4,799 | | | |
| | | | | |
| Capital improvements of real estate | (872) | | | (1,373) | | | |
| Proceeds from sale of real estate | 13,079 | | | — | | | |
| | | | | |
| | | | | |
| | | | | |
| | | | | |
| | | | | |
| Proceeds from FHLB stock | — | | | 1,125 | | | |
| | | | | |
| | | | | |
| | | | | |
| | | | | |
| | | | | |
| Net cash provided by (used in) investing activities | (373,783) | | | 337,135 | | | |
| Cash flows from financing activities: | | | | | |
| Deferred financing costs paid | (1,681) | | | (1,321) | | | |
| Proceeds from borrowings under debt obligations | 250 | | | 80,942 | | | |
| Repayment and repurchase of borrowings under debt obligations | (367,008) | | | (199,184) | | | |
| | | | | |
| | | | | |
| | | | | |
| | | | | |
| | | | | |
| | | | | |
| | | | | |
| | | | | |
| | | | | |
| | | | | |
| | | | | |
| | | | | |
| | | | | |
| | | | | |
| Cash dividends paid to Class A common shareholders | (30,739) | | | (30,918) | | | |
| | | | | |
| | | | | |
| | | | | |
| | | | | |
| | | | | |
| | | | | |
| Capital distributed to noncontrolling interests in consolidated ventures | — | | | (200) | | | |
| | | | | |
| Payment of liability assumed in exchange for shares for the minimum withholding taxes on vesting restricted stock | (8,707) | | | (8,883) | | | |
| | | | | | | | | | | | | |
| | Three Months Ended March 31, |
| | 2025 | | 2024 | | |
| Purchase of treasury stock | (2,317) | | | (647) | | | |
| | | | | |
| | | | | |
| | | | | |
| Net cash provided by (used in) financing activities | (410,202) | | | (160,211) | | | |
| Net increase (decrease) in cash, cash equivalents and restricted cash | (812,712) | | | 156,549 | | | |
| Cash, cash equivalents and restricted cash at beginning of period | 1,346,039 | | | 1,075,942 | | | |
| Cash, cash equivalents and restricted cash at end of period | $ | 533,327 | | | $ | 1,232,491 | | | |
| | | | | |
| | | | | |
| | | | | |
| | | | | |
| | | | | |
| Non-cash investing and financing activities: | | | | | |
| Securities and derivatives purchased, not settled | 19 | | | 15 | | | |
| | | | | |
| | | | | |
| | | | | |
| Repayments in transit of securities (other assets) | 582 | | | 27 | | | |
| Repayment in transit of mortgage loans receivable held for investment (other assets) | 19,822 | | | 40,357 | | | |
| | | | | |
| Non-cash disposition of loans via foreclosure | — | | | (14,541) | | | |
| | | | | |
| | | | | |
| | | | | |
| | | | | |
| | | | | |
| | | | | |
| | | | | |
| Real estate and real estate held for sale acquired in settlement of mortgage loans receivable held for investment, net | — | | | 14,110 | | | |
| | | | | |
| | | | | |
| | | | | |
| | | | | |
| | | | | |
| | | | | |
| | | | | |
| | | | | |
| | | | | |
| | | | | |
| | | | | |
| | | | | |
| | | | | |
| | | | | |
| | | | | |
| | | | | |
| | | | | |
| | | | | |
| | | | | |
| Dividends declared, not paid | 29,493 | | | 30,721 | | | |
| | | | | |
| | | | | |
The following table provides a reconciliation of cash, cash equivalents and restricted cash reported within the consolidated balance sheets that sum to the total of the same such amounts shown in the consolidated statement of cash flows ($ in thousands):
| | | | | | | | | | | | | |
| Three Months Ended March 31, |
| 2025 | | 2024 | | |
| | | | | |
| Cash and cash equivalents | $ | 479,770 | | | $ | 1,220,217 | | | |
| Restricted cash | 13,731 | | | 12,274 | | | |
| Short-term unsettled U.S. Treasury securities classified in other assets on the consolidated balance sheet | 39,826 | | | — | | | |
| Total cash, cash equivalents and restricted cash shown in the consolidated statement of cash flows | $ | 533,327 | | | $ | 1,232,491 | | | |
Refer to the accompanying notes to consolidated financial statements.
Ladder Capital Corp
Notes to Consolidated Financial Statements
(Unaudited)
1. ORGANIZATION AND OPERATIONS
Ladder Capital Corp (“Ladder,” “Ladder Capital,” and the “Company”) is an internally-managed U.S. real estate investment trust (“REIT”) that is a leader in commercial real estate finance. The Company originates and invests in a diverse portfolio of commercial real estate and real estate-related assets, focusing on senior secured assets. The Company’s investment activities include: (i) the Company’s primary business of originating senior first mortgage fixed and floating rate loans collateralized by commercial real estate with flexible loan structures; (ii) owning and operating commercial real estate, including net leased commercial properties; and (iii) investing in investment grade securities secured by first mortgage loans on commercial real estate. Ladder Capital Corp, as the general partner of Ladder Capital Finance Holdings LLLP (“LCFH”), operates the Ladder Capital business through LCFH and its subsidiaries. As of March 31, 2025, Ladder Capital Corp has a 100% economic interest in LCFH and controls the management of LCFH as a result of its ability to appoint its board members. Accordingly, Ladder Capital Corp consolidates the financial results of LCFH and its subsidiaries. In addition, Ladder Capital Corp, through certain subsidiaries, which are treated as taxable REIT subsidiaries (each a “TRS”), is indirectly subject to U.S. federal, state and local income taxes. Other than such indirect U.S. federal, state and local income taxes, there are no material differences between Ladder Capital Corp’s consolidated financial statements and LCFH’s consolidated financial statements.
Ladder Capital Corp was formed as a Delaware corporation on May 21, 2013. The Company conducted its initial public offering (“IPO”) which closed on February 11, 2014. The Company used the net proceeds from the IPO to purchase newly-issued limited partnership units (“LP Units”) from LCFH. In connection with the IPO, Ladder Capital Corp also became a holding corporation and the general partner of, and obtained a controlling interest in, LCFH. Ladder Capital Corp’s only business is to act as the general partner of LCFH, and, as such, Ladder Capital Corp indirectly operates and controls all of the business and affairs of LCFH and its subsidiaries. The IPO transactions described herein are referred to as the “IPO Transactions.”
2. SIGNIFICANT ACCOUNTING POLICIES
Basis of Accounting and Principles of Consolidation
The accompanying consolidated financial statements of the Company have been prepared in accordance with accounting principles generally accepted in the United States (“GAAP”). In the opinion of management, the unaudited financial information for the interim periods presented in this report reflects all normal and recurring adjustments necessary for a fair statement of results of operations, financial position and cash flows. The interim consolidated financial statements should be read in conjunction with the audited consolidated financial statements for the year ended December 31, 2024, which are included in the Annual Report, as certain disclosures that would substantially duplicate those contained in the audited consolidated financial statements have not been included in this interim report. Operating results for interim periods are not necessarily indicative of operating results for an entire fiscal year.
The consolidated financial statements include the Company’s accounts and those of its subsidiaries that are majority-owned and/or controlled by the Company and variable interest entities for which the Company has determined itself to be the primary beneficiary, if any. All significant intercompany transactions and balances have been eliminated.
Financial Accounting Standards Board (“FASB”) Accounting Standards Codification (“ASC”) Topic 810 — Consolidation (“ASC 810”), provides guidance on the identification of entities for which control is achieved through means other than voting rights (“variable interest entities” or “VIEs”) and the determination of which business enterprise, if any, should consolidate the VIEs. Generally, the consideration of whether an entity is a VIE applies when either: (1) the equity investors (if any) lack one or more of the essential characteristics of a controlling financial interest; (2) the equity investment at risk is insufficient to finance that entity’s activities without additional subordinated financial support; or (3) the equity investors have voting rights that are not proportionate to their economic interests and the activities of the entity involve or are conducted on behalf of an investor with a disproportionately small voting interest. The Company consolidates VIEs in which it is considered to be the primary beneficiary. The primary beneficiary is the entity that has both of the following characteristics: (1) the power to direct the activities that, when taken together, most significantly impact the VIE’s performance; and (2) the obligation to absorb losses and right to receive the returns from the VIE that would be significant to the VIE. Refer to Note 9, Consolidated Variable Interest Entities, for further information on the Company’s consolidated variable interest entities.
The Company has investments in two unconsolidated ventures, which were determined to be VIEs. The Company determined that it was not the primary beneficiary of these VIEs because the Company does not have power over these entities and therefore does not have controlling financial interests in these VIEs. These investments are recorded on the consolidated balance sheets within investments in and advances to unconsolidated ventures. The Company’s maximum exposure to loss is limited to its investments in these VIEs. The Company has not provided financial support to these unconsolidated VIEs that it was not previously contractually required to provide.
Allowance for Loan Losses
The Company uses a current expected credit loss model (“CECL”) for estimating the provision for loan losses on its loan portfolio. The CECL model requires the consideration of possible credit losses over the life of an instrument and includes a portfolio-based component and an asset-specific component. The Company engages a third-party service provider to provide market data and a credit loss model. The credit loss model is a forward-looking, econometric, commercial real estate (“CRE”) loss forecasting tool. It is comprised of a probability of default (“PD”) model and a loss given default (“LGD”) model that, layered together with the Company’s loan-level data, fair value of collateral, net operating income of collateral, selected forward-looking macroeconomic variables, and pool-level mean loss rates, produces life of loan expected losses (“EL”) at the loan and portfolio level. Where management has determined that the credit loss model does not fully capture certain external factors, including portfolio trends or loan-specific factors, a qualitative adjustment to the reserve is recorded. In addition, interest receivable on loans is not included in the Company’s CECL calculations as the Company performs timely write offs of aged interest receivable. The Company has made a policy election to write off aged receivables through interest income as opposed to through the CECL provision on its statements of income.
Loans for which the borrower or sponsor is experiencing financial difficulty, and where repayment of the loan is expected substantially through the operation or sale of the underlying collateral, are considered collateral dependent loans. For collateral dependent loans, the Company may elect a practical expedient that allows the Company to measure expected losses based on the difference between the collateral’s fair value and the amortized cost basis of the loan. When the repayment or satisfaction of the loan is dependent on a sale, rather than operations of the collateral, the fair value is adjusted for the estimated costs to sell the collateral. If foreclosure is probable, the Company is required to measure for expected losses using this methodology.
The Company generally will use the direct capitalization rate valuation methodology or the sales comparison approach to estimate the fair value of the collateral for loans and in certain cases will obtain external appraisals. Determining fair value of the collateral may take into account a number of assumptions including, but not limited to, cash flow projections, market capitalization rates, discount rates and data regarding recent comparable sales of similar properties. Such assumptions are generally based on current market conditions and are subject to economic and market uncertainties.
The Company’s loans are typically collateralized by real estate directly or indirectly. As a result, the Company regularly evaluates the extent and impact of any credit deterioration associated with the performance and/or value of the underlying collateral property as well as the financial and operating capability of the borrower/sponsor on a loan-by-loan basis. Specifically, a property’s operating results and any cash reserves are analyzed and used to assess: (i) whether cash flow from operations is sufficient to cover the debt service requirements currently and into the future; (ii) the ability of the borrower to refinance the loan at maturity; and/or (iii) the property’s liquidation value. The Company also evaluates the financial wherewithal of any loan guarantors as well as the borrower’s competency in managing and operating the properties. In addition, the Company considers the overall economic environment, real estate sector, and geographic submarket in which the collateral property is located. Such impairment analyses are completed and reviewed by asset management and underwriting personnel, who utilize various data sources, including: (i) periodic financial data such as property occupancy, tenant profile, rental rates, operating expenses, the borrowers’ business plan, and capitalization and discount rates; (ii) site inspections; and (iii) current credit spreads and other market data and ultimately presented to management for approval.
When a debtor is experiencing financial difficulties and a loan is modified, the effect of the modification will be included in the Company’s assessment of the CECL allowance for loan losses. If the Company provides principal forgiveness, the amortized cost basis of the loan is written off against the allowance for loan losses. Generally, when modifying loans, the Company will seek to protect its position by requiring incremental pay downs, additional collateral or guarantees and, in some cases, lookback features or equity interests to offset concessions granted should conditions impacting the loan improve.
The Company designates a loan as a non-accrual loan generally when: (i) the principal or coupon interest components of loan payments become 90-days past due; or (ii) in the opinion of the Company, recovery of principal and coupon interest is doubtful. Interest income on non-accrual loans in which the Company reasonably expects a recovery of the loan’s outstanding principal balance is recognized when received in cash. Otherwise, income recognition will be suspended and any cash received will be applied as a reduction to the amortized cost basis. A non-accrual loan is returned to accrual status at such time as the loan
becomes contractually current and future principal and coupon interest are reasonably assured to be received. A loan will be charged-off when management has determined principal and coupon interest is no longer realizable and deemed non-recoverable.
Transfers of Financial Assets
For a transfer of financial assets to be considered a sale, the transfer must meet the sale criteria of ASC 860, which, at the time of the transfer, require that the transferred assets qualify as recognized financial assets and the Company surrender control over the assets. Such surrender requires that the assets be isolated from the Company, even in bankruptcy or other receivership, the purchaser have the right to pledge or sell the assets transferred and the Company not have an option or obligation to reacquire the assets. If the sale criteria are not met, the transfer is considered to be a secured borrowing, the assets remain on the Company’s consolidated balance sheets and the sale proceeds are recognized as a liability. In November 2017, the SEC staff indicated that, despite transfer restrictions placed on qualified Third Party Purchasers by the risk retention rules of the Dodd-Frank Act, they would not take exception to a registrant treating transfers of financial instruments in a securitization as sales if the transfers otherwise met all the criteria for sale accounting. The Company believes treatment of such transfers as sales is consistent with the substance of such transactions and, accordingly, reflects such transfers as sales. The Company recognizes gains on sale of loans net of any costs related to that sale.
Debt Issued
From time to time, a subsidiary of the Company will originate a loan (each, an “inter-segment loan,” and collectively, “inter-segment loans”) to another subsidiary of the Company to finance the purchase of real estate. The mortgage loan receivable and the related obligation do not appear in the Company’s consolidated balance sheets as they are eliminated upon consolidation. Once the Company issues (sells) an inter-segment loan to a third-party securitization trust (for cash), the related mortgage note is recognized as a financing transaction and accounted for under ASC 470. The accounting for the securitization of an inter-segment loan—a financial instrument that has never been recognized in the consolidated financial statements as an asset—is considered a financing transaction under ASC 470 and ASC 835.
The periodic securitization of the Company’s mortgage loans involves both inter-segment loans and mortgage loans made to third parties with the latter recognized as financial assets in the Company’s consolidated financial statements as part of an integrated transaction. The Company receives aggregate proceeds equal to the transaction’s all-in securitization value and sales price. In accordance with the guidance under ASC 835, when initially measuring the obligation arising from an inter-segment loan’s securitization, the Company allocates the proceeds from each securitization transaction between the third-party loans and each inter-segment loan securitized on a relative fair value basis determined in accordance with the guidance in ASC 820. The difference between the amount allocated to each inter-segment loan and the loan’s face amount is recorded as a premium or discount, and is amortized, using the effective interest method, as a reduction or increase in reported interest expense, respectively.
Reclassification
Certain other prior period amounts have been reclassified to conform to the current period's presentation.
Recently Adopted Accounting Pronouncements
In November 2023, the FASB issued ASU 2023-07—Segment Reporting (Topic 280): Improvements to Reportable Segment Disclosures (“ASU 2023-07”). ASU 2023-07 improves reportable segment disclosure requirements, primarily through enhanced disclosures about significant segment expenses. ASU 2023-07 is effective for fiscal years beginning after December 15, 2023 and interim periods within fiscal years beginning after December 15, 2024, with early adoption permitted. The amendments should be applied retrospectively to all prior periods presented in the financial statements. Upon transition, the segment expense categories and amounts disclosed in the prior periods should be based on the significant segment expense categories identified and disclosed in the period of adoption. The Company adopted ASU 2023-07 during the fourth quarter of 2024 and the adoption of ASU 2023-07 did not have a material impact on the Company’s consolidated financial statements.
Recent Accounting Pronouncements Pending Adoption
In December 2023, the FASB issued ASU 2023-09—Income Taxes (Topic 740): Improvements to Income Tax Disclosures (“ASU 2023-09”). ASU 2023-09 improves the transparency of income tax disclosures related to rate reconciliation and income taxes. ASU 2023-07 is effective for annual periods beginning after December 15, 2024. Early adoption is permitted for annual financial statements that have not yet been issued or made available for issuance. The amendments should be applied prospectively, however retrospective application is permitted. The adoption of ASU 2023-09 is not expected to have a material impact on the Company’s consolidated financial statements.
In November 2024, the FASB issued ASU No. 2024-03, Disaggregation of Income Statement Expenses (“DISE”). DISE requires disaggregated disclosure of income statement expenses for public business entities. ASU 2024-03 does not change the expense captions an entity presents on the face of the income statement; rather, it requires disaggregation of certain expense captions into specified categories in disclosures within the footnotes to the financial statements. As revised by ASU No. 2025-01, Income Statement—Reporting Comprehensive Income—Expense Disaggregation Disclosures, the provisions of ASU 2024-03 are effective for fiscal years beginning after December 15, 2026, and interim periods within fiscal years beginning after December 15, 2027, with early adoption permitted. With the exception of expanding disclosures to include more granular income statement expense categories, we do not expect the adoption of ASU 2024-03 to have a material effect on our consolidated financial statements.
Any new accounting standards not disclosed above that have been issued or proposed by FASB and that do not require adoption until a future date are being evaluated or are not expected to have a material impact on the consolidated financial statements upon adoption.
3. MORTGAGE LOAN RECEIVABLES
March 31, 2025 ($ in thousands)
| | | | | | | | | | | | | | | | | | | | | | | |
| Outstanding
Face Amount | | Carrying
Value | | Weighted
Average
Yield (1)(2) | | Remaining
Maturity
(years)(2)(3) |
| | | | | | | |
| Mortgage loan receivables held for investment, net, at amortized cost: | | | | | | | |
| First mortgage loans | $ | 1,659,485 | | | $ | 1,653,674 | | | 8.69 | % | | 1.1 |
| Mezzanine loans | 11,584 | | | 11,569 | | | 11.48 | % | | 0.8 |
| Total mortgage loans receivable | 1,671,069 | | | 1,665,243 | | | 8.71 | % | | 1.1 |
| | | | | | | |
| | | | | | | |
| Allowance for credit losses | N/A | | (52,208) | | | | | |
| Total mortgage loan receivables held for investment, net, at amortized cost | 1,671,069 | | | 1,613,035 | | | | | |
| Mortgage loan receivables held for sale: | | | | | | | |
| First mortgage loans | 95,350 | | | 90,420 | | (4) | 6.20 | % | | 9.0 |
| Total | $ | 1,766,419 | | | $ | 1,703,455 | | (5) | 8.57 | % | | 1.6 |
(1)Includes the impact of interest rate floors. Term SOFR rates in effect as of March 31, 2025 are used to calculate weighted average yield for floating rate loans.
(2)Excludes four non-accrual loans with an amortized cost basis of $116.1 million. Refer to “Non-Accrual Status” below for further details.
(3)The remaining maturity is calculated based on the initial maturity. The weighted average extended maturity for all loans is 2.2 years.
(4)As a result of changes in prevailing rates, the Company recorded a reversal of lower of cost or market adjustment as of March 31, 2025. The adjustment was calculated using a 5.35% discount rate.
(5)Net of $7.2 million of deferred origination fees and other items as of March 31, 2025.
As of March 31, 2025, $1.4 billion, or 82.3%, of the outstanding face amount of the mortgage loan receivables held for investment, net, at amortized cost, were at variable interest rates linked to Term SOFR. Of this $1.4 billion, 100% of these variable interest rate mortgage loan receivables were subject to interest rate floors. As of March 31, 2025, $95.4 million, or 100%, of the outstanding face amount of the mortgage loan receivables held for sale were at fixed interest rates.
December 31, 2024 ($ in thousands)
| | | | | | | | | | | | | | | | | | | | | | | |
| Outstanding
Face Amount | | Carrying
Value | | Weighted
Average
Yield (1)(2) | | Remaining
Maturity
(years)(2)(3) |
| | | | | | | |
| Mortgage loan receivables held for investment, net, at amortized cost: | | | | | | | |
| First mortgage loans | $ | 1,584,674 | | | $ | 1,579,740 | | | 9.34 | % | | 0.9 |
| Mezzanine loans | 11,603 | | | 11,582 | | | 11.51 | % | | 1.1 |
| Total mortgage loans receivable | 1,596,277 | | | 1,591,322 | | | 9.36 | % | | 0.9 |
| | | | | | | |
| | | | | | | |
| Allowance for credit losses | — | | | (52,323) | | | | | |
| Total mortgage loan receivables held for investment, net, at amortized cost | 1,596,277 | | | 1,538,999 | | | | | |
| Mortgage loan receivables held for sale: | | | | | | | |
| First mortgage loans | 31,350 | | | 26,898 | | (4) | 4.57 | % | | 7.2 |
| Total | $ | 1,627,627 | | | $ | 1,565,897 | | (5) | 9.27 | % | | 1.0 |
(1)Includes the impact of interest rate floors. Term SOFR rates in effect as of December 31, 2024 are used to calculate weighted average yield for floating rate loans.
(2)Excludes two non-accrual loans with an amortized cost basis of $76.9 million. Refer to “Non-Accrual Status” below for further details.
(3)The remaining maturity is calculated based on the initial maturity. The weighted average extended maturity for all loans is 1.6 years.
(4)As a result of rising prevailing rates, the Company recorded a lower of cost or market adjustment as of December 31, 2024. The adjustment was calculated using a 5.20% discount rate.
(5)Net of $5.0 million of deferred origination fees and other items as of December 31, 2024.
As of December 31, 2024, $1.3 billion, or 83.3%, of the outstanding face amount of the mortgage loan receivables held for investment, net, at amortized cost, were at variable interest rates linked to Term SOFR. Of this $1.3 billion, 100.0% of these variable interest rate mortgage loan receivables were subject to interest rate floors. As of December 31, 2024, $31.4 million, or 100%, of the outstanding face amount of the mortgage loan receivables held for sale were at fixed interest rates.
For the three months ended March 31, 2025 and 2024, loan portfolio activity was as follows ($ in thousands):
| | | | | | | | | | | | | | | | | | | |
| Mortgage loan receivables held for investment, net, at amortized cost: | | |
| | Mortgage loans receivable | | | | Allowance for credit losses | | Mortgage loan
receivables held
for sale |
| Balance, December 31, 2024 | $ | 1,591,323 | | | | | $ | (52,323) | | | $ | 26,898 | |
| Origination of mortgage loan receivables (1) | 253,048 | | | | | — | | | 63,360 | |
| | | | | | | |
| Repayment of mortgage loan receivables (2) | (181,873) | | | | | — | | | — | |
| | | | | | | |
| | | | | | | |
| Net result from mortgage loan receivables held for sale (3) | — | | | | | — | | | 162 | |
| | | | | | | |
| Accretion/amortization of discount, premium and other fees | 2,745 | | | | | — | | | — | |
| | | | | | | |
| | | | | | | |
| | | | | | | |
| | | | | | | |
| Release (addition) of provision for current expected credit loss, net (4) | — | | | | | 115 | | | — | |
| | | | | | | |
| Balance, March 31, 2025 | $ | 1,665,243 | | | | | $ | (52,208) | | | $ | 90,420 | |
(1)Includes funding of commitments on existing mortgage loans.
(2)Includes $19.8 million of repayments in transit.
(3)Includes unrealized lower of cost or market adjustment and realized gain/loss on loans held for sale.
(4)Refer to “Allowance for Credit Losses” table below for further detail.
| | | | | | | | | | | | | | | | | | | |
| Mortgage loan receivables held for investment, net, at amortized cost: | | |
| | Mortgage loans receivable | | | | Allowance for credit losses | | Mortgage loan
receivables held
for sale |
| Balance, December 31, 2023 | $ | 3,155,089 | | | | | $ | (43,165) | | | $ | 26,868 | |
| Origination of mortgage loan receivables (1) | 48,702 | | | | | — | | | — | |
| | | | | | | |
| Repayment of mortgage loan receivables (2) | (395,345) | | | | | — | | | — | |
| Proceeds from sales of mortgage loan receivables (3) | — | | | | | — | | | — | |
| Non-cash disposition of loans via foreclosure (4) | (14,541) | | | | | — | | | — | |
| Net result from mortgage loan receivables held for sale (5) | — | | | | | — | | | 87 | |
| | | | | | | |
| Accretion/amortization of discount, premium and other fees | 4,040 | | | | | — | | | — | |
| | | | | | | |
| | | | | | | |
| | | | | | | |
| | | | | | | |
| Release (addition) of provision for current expected credit loss, net (6) | — | | | | | (5,895) | | | — | |
| | | | | | | |
| Balance, March 31, 2024 | $ | 2,797,945 | | | | | $ | (49,060) | | | $ | 26,955 | |
(1)Includes funding of commitments on existing mortgage loans.
(2)Includes $32.5 million of proceeds received from repayments in transit.
(3)Excludes $40.4 million of proceeds received from the sale of conduit mortgage loans collateralized by net leased properties in the Company’s real estate segment to a third-party securitization trust. The mortgage loan receivables, which were originated during the current period, and the related obligation do not appear in the Company’s consolidated balance sheets as they are eliminated upon consolidation. Upon the sale of the mortgage loan receivable to a third-party securitization trust (for cash), the related mortgage note is recognized as a financing transaction.
(4)Refer to Note 5, Real Estate and Related Lease Intangibles, Net, for further detail on foreclosures of real estate.
(5)Includes unrealized lower of cost or market adjustment and realized gain/loss on loans held for sale.
(6)Refer to “Allowance for Credit Losses” table below for further detail.
Allowance for Credit Losses and Non-Accrual Status ($ in thousands)
| | | | | | | | | | | | | | | | | |
| Three Months Ended March 31, | | |
| Allowance for Credit Losses | 2025 | | 2024 | | | | | | |
| Allowance for credit losses at beginning of period | $ | 52,323 | | | $ | 43,165 | | | | | | | |
| Provision for (release of) current expected credit loss, net (1) | (115) | | | 5,895 | | | | | | | |
| | | | | | | | | |
| | | | | | | | | |
| | | | | | | | | |
| | | | | | | | | |
| Allowance for credit losses at end of period | $ | 52,208 | | | $ | 49,060 | | | | | | | |
(1)As of March 31, 2025 and 2024, there were no asset-specific reserves.
| | | | | | | | | | | |
Non-Accrual Status (1) | March 31, 2025(2) | | December 31, 2024(3) |
| Amortized cost basis of loans on non-accrual status | $ | 116,137 | | | $ | 76,875 | |
(1)As of March 31, 2025, $91.2 million of loans on non-accrual status were greater than 90 days past due. As of December 31, 2024, $76.9 million of loans on non-accrual status were greater than 90 days past due. For the three months ended March 31, 2025, the Company recognized $0.5 million of interest income on these loans.
(2)Comprised of one multi-family loan with an amortized cost basis of $60.9 million, one mixed-use loan with an amortized cost basis of $16.6 million, one office loan with an amortized cost basis of $24.9 million, and one hotel loan with an amortized cost basis of $13.7 million, for which the Company determined no asset-specific reserves were necessary.
(3)Comprised of one multi-family loan with an amortized cost basis of $60.9 million and one mixed-use loan with an
amortized cost basis of $16.0 million, for which the Company determined no asset-specific reserve was necessary.
Current Expected Credit Loss
As of March 31, 2025, the Company has a $52.8 million allowance for current expected credit losses, of which $52.2 million pertains to mortgage loan receivables and $0.6 million relates to unfunded commitments included in other liabilities in the consolidated balance sheet.
As of December 31, 2024, the Company had a $52.8 million allowance for current expected credit losses, of which $52.3 million pertained to mortgage loan receivables and $0.5 million related to unfunded commitments included in other liabilities in the consolidated balance sheet.
The release of loan loss reserves for the three months ended March 31, 2025 was $0.1 million. The release recorded during the three months ended March 31, 2025 was primarily due to a decrease in the size of the the Company’s balance sheet first mortgage loan portfolio as a result of repayments, partially offset by adverse changes in macroeconomic market conditions affecting commercial real estate.
The provision for loan loss reserves for the three months ended March 31, 2024 was $5.8 million. The provision recorded during the three months ended March 31, 2024 was primarily due to adverse changes in macroeconomic market conditions affecting commercial real estate, partially offset by a decrease in the size of the balance sheet first mortgage loan portfolio as a result of repayments.
Management’s method for monitoring credit is the performance of a loan. The primary credit quality indicator management utilizes to assess its current expected credit loss reserve is by viewing the Company’s mortgage loan portfolio by collateral type. The primary credit quality indicator is reviewed by management on a quarterly basis. The following tables summarize the amortized cost of the mortgage loan portfolio by collateral type as of March 31, 2025 and December 31, 2024, respectively ($ in thousands):
| | | | | | | | | | | | | | | | | | | | | | | | | | | | | | | | | | | | | | | | | | | | | | |
| | Amortized Cost Basis by Origination Year as of March 31, 2025 | | | | | | |
| Collateral Type | | 2025 | | 2024 | | 2023 | | 2022 | | 2021 and Earlier | | Total (2) | | | | | | | |
| | | | | | | | | | | | | | | | | | | | |
| Office | | $ | — | | | $ | — | | | $ | — | | | $ | 55,600 | | | $ | 705,525 | | | $ | 761,125 | | | | | | | | | |
| Multifamily | | 143,117 | | | 126,785 | | | 14,624 | | | 93,129 | | | 207,277 | | | 584,932 | | | | | | | | | |
| Mixed Use | | 18,169 | | | — | | | — | | | — | | | 83,054 | | | 101,223 | | | | | | | | | |
| Industrial | | 42,478 | | | 26,454 | | | — | | | — | | | — | | | 68,932 | | | | | | | | | |
| Other | | 48,490 | | | — | | | — | | | 14,172 | | | — | | | 62,662 | | | | | | | | | |
| Retail | | — | | | 23,876 | | | — | | | — | | | 24,143 | | | 48,019 | | | | | | | | | |
| Hospitality | | — | | | — | | | — | | | — | | | 38,350 | | | 38,350 | | | | | | | | | |
| | | | | | | | | | | | | | | | | | | | |
| | | | | | | | | | | | | | | | | | | | |
| | | | | | | | | | | | | | | | | | | | |
| | | | | | | | | | | | | | | | | | | | |
| | | | | | | | | | | | | | | | | | | | |
| | | | | | | | | | | | | | | | | | | | |
| | | | | | | | | | | | | | | | | | | | |
| | | | | | | | | | | | | | | | | | | | |
| | | | | | | | | | | | | | | | | | | | |
| | | | | | | | | | | | | | | | | | | | |
| Subtotal mortgage loans receivable | | 252,254 | | | 177,115 | | | 14,624 | | | 162,901 | | | 1,058,349 | | | 1,665,243 | | | | | | | | | |
| Individually Impaired loans | | — | | | — | | | — | | | — | | | — | | | — | | | | | | | | | |
| Total mortgage loans receivable (1) | | $ | 252,254 | | | $ | 177,115 | | | $ | 14,624 | | | $ | 162,901 | | | $ | 1,058,349 | | | $ | 1,665,243 | | | | | | | | | |
| | | | | | | | | | | | | | | | | | | | | | | | | | | | | | | | | | | | | | | | | | | | | | |
| | Amortized Cost Basis by Origination Year as of December 31, 2024 | | | | | | |
| Collateral Type | | 2024 | | 2023 | | 2022 | | 2021 | | 2020 and Earlier | | Total (3) | | | | | | | |
| | | | | | | | | | | | | | | | | | | | |
| Office | | $ | — | | | $ | — | | | $ | 59,944 | | | $ | 518,663 | | | $ | 185,242 | | | $ | 763,849 | | | | | | | | | |
| Multifamily | | 126,588 | | | 14,636 | | | 105,324 | | | 272,291 | | | — | | | 518,839 | | | | | | | | | |
| Mixed Use | | — | | | — | | | — | | | 127,380 | | | — | | | 127,380 | | | | | | | | | |
| Retail | | 23,833 | | | — | | | — | | | 48,628 | | | — | | | 72,461 | | | | | | | | | |
| Hospitality | | — | | | — | | | — | | | 13,064 | | | 55,260 | | | 68,324 | | | | | | | | | |
| Industrial | | 26,368 | | | — | | | — | | | — | | | — | | | 26,368 | | | | | | | | | |
| Other | | — | | | — | | | 14,101 | | | — | | | — | | | 14,101 | | | | | | | | | |
| | | | | | | | | | | | | | | | | | | | |
| | | | | | | | | | | | | | | | | | | | |
| | | | | | | | | | | | | | | | | | | | |
| | | | | | | | | | | | | | | | | | | | |
| | | | | | | | | | | | | | | | | | | | |
| | | | | | | | | | | | | | | | | | | | |
| | | | | | | | | | | | | | | | | | | | |
| | | | | | | | | | | | | | | | | | | | |
| | | | | | | | | | | | | | | | | | | | |
| Subtotal mortgage loans receivable | | 176,789 | | | 14,636 | | | 179,369 | | | 980,026 | | | 240,502 | | | 1,591,322 | | | | | | | | | |
| Individually Impaired loans | | — | | | — | | | — | | | — | | | — | | | — | | | | | | | | | |
| Total mortgage loans receivable (4)(5) | | $ | 176,789 | | | $ | 14,636 | | | $ | 179,369 | | | $ | 980,026 | | | $ | 240,502 | | | $ | 1,591,322 | | | | | | | | | |
(1)Not included above is $10.7 million of accrued interest receivable on all loans at March 31, 2025.
(2)For purposes of calculating our CECL allowance, one loan collateralized by hospitality, one loan collateralized by office, and one loan collateralized by multifamily utilized valuations of the underlying collateral to calculate the allowance at March 31, 2025.
(3)For purposes of calculating our CECL allowance, two loans collateralized by mixed-use, one loan collateralized by office, and one loan collateralized by multifamily utilized valuations of the underlying collateral to calculate the allowance at December 31, 2024.
(4)For the year ended December 31, 2024, there was a $5.0 million charge-off of an asset-specific allowance in connection with a foreclosure of one office property in Oakland, California.
(5)Not included above is $9.4 million of accrued interest receivable on all loans at December 31, 2024.
4. SECURITIES
The Company invests in primarily AAA-rated real estate securities, typically front pay securities, with relatively short duration and significant credit subordination.
Commercial mortgage-backed securities, including CRE CLOs (“CMBS”), CMBS interest-only securities, U.S. Agency securities, corporate bonds and U.S. Treasury securities are classified as available-for-sale and reported at fair value with changes in fair value recorded in the current period in other comprehensive income. As of March 31, 2025, the Company does not intend to sell these investments and it is not more likely than not that the Company will be required to sell the investments before recovery of their amortized cost bases.
Government National Mortgage Association (“GNMA”) interest-only, Federal Home Loan Mortgage Corp (“FHLMC”) and equity securities are recorded at fair value with changes in fair value recognized in earnings in the consolidated statements of income. The following is a summary of the Company’s securities at March 31, 2025 and December 31, 2024 ($ in thousands):
March 31, 2025
| | | | | | | | | | | | | | | | | | | | | | | | | | | | | | | | | | | | | | | | | | | | | | | | | | | | | | | | | | | | | | |
| | | | | | | Gross Unrealized | | | | | | Weighted Average |
| Asset Type | | Outstanding
Face Amount | | Amortized Cost Basis | | Gains | | Losses (1) | | Carrying
Value | | # of
Securities | | Rating (2) | | Coupon % | | Yield % | | Remaining
Duration
(years) |
| CMBS | | $ | 1,480,626 | | | $ | 1,478,529 | | | $ | 1,825 | | | $ | (9,097) | | | $ | 1,471,257 | | (3) | 99 | | | AAA | | 5.71 % | | 5.82 % | | 2.93 |
| CMBS interest-only(4) | | 436,227 | | (4) | 2,659 | | | 93 | | | (39) | | | 2,713 | | (5) | 6 | | | AAA | | 0.63 % | | 8.22 % | | 0.78 |
| GNMA interest-only(6) | | 32,359 | | (4) | 158 | | | 55 | | | (58) | | | 155 | | | 13 | | | AAA | | 0.33 % | | 9.39 % | | 3.73 |
| Agency securities | | 9 | | | 9 | | | — | | | — | | | 9 | | | 1 | | | AAA | | 4.00 % | | 2.57 % | | 0.45 |
| | | | | | | | | | | | | | | | | | | | |
| | | | | | | | | | | | | | | | | | | | |
| | | | | | | | | | | | | | | | | | | | |
| Total debt securities | | $ | 1,949,221 | | | $ | 1,481,355 | | | $ | 1,973 | | | $ | (9,194) | | | $ | 1,474,134 | | (7) | 119 | | | | | 4.48 | % | | 5.81 | % | | 2.92 |
| Equity securities | | N/A | | 2,517 | | | — | | | (251) | | | 2,266 | | | 4 | | | N/A | | N/A | | N/A | | N/A |
| | | | | | | | | | | | | | | | | | | | |
| Allowance for current expected credit losses | | N/A | | — | | | — | | | (20) | | | (20) | | | | | | | | | | | |
| Total securities | | $ | 1,949,221 | | | $ | 1,483,872 | | | $ | 1,973 | | | $ | (9,465) | | | $ | 1,476,380 | | | 123 | | | | | | | | | |
December 31, 2024
| | | | | | | | | | | | | | | | | | | | | | | | | | | | | | | | | | | | | | | | | | | | | | | | | | | | | | | | | | | | | | |
| | | | | | | Gross Unrealized | | | | | | Weighted Average |
| Asset Type | | Outstanding
Face Amount | | Amortized
Cost Basis | | Gains | | Losses (1) | | Carrying
Value | | # of
Securities | | Rating (2) | | Coupon % | | Yield % | | Remaining
Duration
(years) |
| | | | | | | | | | | | | | | | | | | | |
| CMBS | | $ | 1,065,985 | | | $ | 1,063,835 | | | $ | 3,335 | | | $ | (8,296) | | | $ | 1,058,874 | | (3) | 92 | | | AAA | | 5.97 % | | 6.13 % | | 2.41 |
| CMBS interest-only(4) | | 769,724 | | (4) | 3,149 | | | 104 | | | (9) | | | 3,244 | | (5) | 7 | | | AAA | | 0.38 % | | 7.81 % | | 0.87 |
| GNMA interest-only(6) | | 32,710 | | (4) | 160 | | | 53 | | | (58) | | | 155 | | | 13 | | | AAA | | 0.33 % | | 9.38 % | | 3.64 |
| Agency securities | | 11 | | | 11 | | | — | | | — | | | 11 | | | 1 | | | AAA | | 4.00 % | | 2.60 % | | 0.58 |
| | | | | | | | | | | | | | | | | | | | |
| | | | | | | | | | | | | | | | | | | | |
| | | | | | | | | | | | | | | | | | | | |
| Total debt securities | | $ | 1,868,430 | | | $ | 1,067,155 | | | $ | 3,492 | | | $ | (8,363) | | | $ | 1,062,284 | | (7) | 113 | | | | | 3.56 | % | | 6.03 | % | | 2.37 |
| Equity securities | | N/A | | 19,511 | | | 3 | | | (939) | | | 18,575 | | | 8 | | | N/A | | N/A | | N/A | | N/A |
| Allowance for current expected credit losses | | N/A | | — | | | — | | | (20) | | | (20) | | | | | | | | | | | |
| Total securities | | $ | 1,868,430 | | | $ | 1,086,666 | | | $ | 3,495 | | | $ | (9,322) | | | $ | 1,080,839 | | | 121 | | | | | | | | | |
(1)Based on the Company’s analysis, including review of interest rate changes and current levels of subordination, among other factors, the unrealized loss positions are determined to be due to market factors other than credit.
(2)Represents the weighted average of the ratings of all securities in each asset type, expressed as an S&P equivalent rating. For each security rated by multiple rating agencies, the highest rating is used. The ratings provided were determined by third-party rating agencies. The rates may not be current and are subject to change (including the assignment of a “negative outlook” or “credit watch”) at any time.
(3)As of March 31, 2025 and December 31, 2024, includes $8.9 million of restricted securities which are designated as risk retention securities under the Dodd-Frank Wall Street Reform and Consumer Protection Act of 2010, as amended (“Dodd-Frank Act”) and are therefore subject to transfer restrictions over the term of the securitization trust and are classified as held-to-maturity and reported at amortized cost.
(4)The amounts presented represent the principal amount of the mortgage loans outstanding in the pool in which the interest-only securities participate.
(5)As of March 31, 2025 and December 31, 2024, includes $0.2 million of restricted securities which are designated as risk retention securities under the Dodd-Frank Act and are therefore subject to transfer restrictions over the term of the securitization trust and are classified as held-to-maturity and reported at amortized cost.
(6)GNMA interest-only securities are recorded at fair value with changes in fair value recorded in current period earnings. The Company’s GNMA interest-only securities are considered to be hybrid financial instruments that contain embedded derivatives. As a result, the Company has elected to account for them as hybrid instruments in their entirety at fair value with changes in fair value recognized in unrealized gain (loss) on securities in the consolidated statements of income.
(7)The Company’s investments in debt securities represent an ownership interest in unconsolidated VIEs. The Company’s maximum exposure to loss from these unconsolidated VIEs is the amortized cost basis of the securities which represents the purchase price of the investment adjusted by any unamortized premiums or discounts as of the reporting date.
The following summarizes the carrying value of the Company’s debt securities by remaining maturity based upon expected cash flows at March 31, 2025 and December 31, 2024 ($ in thousands):
March 31, 2025
| | | | | | | | | | | | | | | | | | | | | | | | | | | | | | | | |
| Asset Type | | Within 1 year | | 1-5 years | | 5-10 years | | After 10 years | | Total |
| | | | | | | | | | |
| CMBS | | $ | 132,306 | | | $ | 1,239,741 | | | $ | 37,633 | | | $ | 61,577 | | | $ | 1,471,257 | |
| CMBS interest-only | | 2,690 | | | 23 | | | — | | | — | | | 2,713 | |
| GNMA interest-only | | 51 | | | 13 | | | 91 | | | — | | | 155 | |
| Agency securities | | 9 | | | — | | | — | | | — | | | 9 | |
| | | | | | | | | | |
| | | | | | | | | | |
| | | | | | | | | | |
| | | | | | | | | | |
| Total securities (1) | | $ | 135,056 | | | $ | 1,239,777 | | | $ | 37,724 | | | $ | 61,577 | | | $ | 1,474,134 | |
(1)Excluded from the table above are $2.3 million of equity securities and $(20.0) thousand of allowance for current expected credit losses.
December 31, 2024
| | | | | | | | | | | | | | | | | | | | | | | | | | | | |
| Asset Type | | Within 1 year | | 1-5 years | | 5-10 years | | | | Total |
| | | | | | | | | | |
| CMBS | | $ | 170,874 | | | $ | 888,000 | | | $ | — | | | | | $ | 1,058,874 | |
| CMBS interest-only | | 2,937 | | | 307 | | | — | | | | | 3,244 | |
| GNMA interest-only | | 53 | | | 13 | | | 89 | | | | | 155 | |
| Agency securities | | 11 | | | — | | | — | | | | | 11 | |
| | | | | | | | | | |
| | | | | | | | | | |
| U.S. Treasury securities | | — | | | — | | | | | | | — | |
| | | | | | | | | | |
| Total securities (1) | | $ | 173,875 | | | $ | 888,320 | | | $ | 89 | | | | | $ | 1,062,284 | |
(1)Excluded from the table above are $18.6 million of equity securities and $(20.0) thousand of allowance for current expected credit losses.
During the three months ended March 31, 2025 and March 31, 2024, the Company sold $18.0 million and $1.0 million of equity securities, respectively.
The following summarizes the Company’s realized and unrealized gain (loss) on securities, included within “Fee and Other Income” on the Company’s consolidated statements of income for the three months ended March 31, 2025 and March 31, 2024 ($ in thousands):
| | | | | | | | | | | | | | |
| | Three Months Ended March 31, |
| | | 2025 | | 2024 |
| Realized gain (loss) on securities | | $ | 542 | | | $ | 53 | |
| Unrealized gain (loss) on securities | | 687 | | | (7) | |
| Total realized and unrealized gain/(loss) on securities | | $ | 1,229 | | | $ | 46 | |
5. REAL ESTATE AND RELATED LEASE INTANGIBLES, NET
The Company’s real estate assets were comprised of the following ($ in thousands):
| | | | | | | | | | | |
| March 31, 2025 | | December 31, 2024 |
| | | |
| Land | $ | 171,181 | | | $ | 173,798 | |
| Building | 615,454 | | | 622,701 | |
| In-place leases and other intangibles | 105,791 | | | 107,899 | |
| Undepreciated real estate and related lease intangibles | 892,426 | | | 904,398 | |
| Less: Accumulated depreciation and amortization | (237,717) | | | (233,595) | |
| | | |
| Real estate and related lease intangibles, net(1) | $ | 654,709 | | | $ | 670,803 | |
| | | |
| Below market lease intangibles, net (other liabilities)(2) | $ | (23,898) | | | $ | (25,340) | |
(1)There was unencumbered real estate of $223.8 million and $213.4 million as of March 31, 2025 and December 31, 2024, respectively.
(2)Below market lease intangibles is net of $16.7 million and $16.5 million of accumulated amortization as of March 31, 2025 and December 31, 2024, respectively.
As of March 31, 2025 and December 31, 2024, the Company had no real estate and lease intangibles held for sale.
The following table presents depreciation and amortization expense on real estate recorded by the Company ($ in thousands):
| | | | | | | | | | | | | | | | | |
| | Three Months Ended March 31, | | |
| | 2025 | | 2024 | | | | | | |
| Depreciation expense(1) | $ | 6,052 | | | $ | 6,389 | | | | | | | |
| Amortization expense | 1,284 | | | 1,913 | | | | | | | |
| Total real estate depreciation and amortization expense | $ | 7,336 | | | $ | 8,302 | | | | | | | |
(1)Depreciation expense on the consolidated statements of income also includes $0.1 million of depreciation on corporate fixed assets for the three months ended March 31, 2025 and March 31, 2024.
The Company’s intangible assets are comprised of in-place leases, above market leases and other intangibles. The following tables present additional detail related to the intangible assets ($ in thousands):
| | | | | | | | | | | |
| | March 31, 2025 | | December 31, 2024 |
| | | |
| Gross intangible assets(1) | $ | 105,791 | | | $ | 107,899 | |
| Accumulated amortization | 58,137 | | | 57,281 | |
| Net intangible assets | $ | 47,654 | | | $ | 50,618 | |
(1)Includes $2.2 million and $2.3 million of unamortized above market lease intangibles, which are included in real estate and related lease intangibles, net on the consolidated balance sheets as of March 31, 2025 and December 31, 2024, respectively.
The following table presents increases/reductions in operating lease income related to the amortization of above or below market leases recorded by the Company ($ in thousands): | | | | | | | | | | | | | | | | | |
| | Three Months Ended March 31, | | |
| | 2025 | | 2024 | | | | | | |
| Reduction in operating lease income for amortization of above market lease intangibles acquired | $ | (93) | | | $ | (97) | | | | | | | |
| Increase in operating lease income for amortization of below market lease intangibles acquired | 495 | | | 529 | | | | | | | |
| Total | $ | 402 | | | $ | 432 | | | | | | | |
The following table presents expected adjustment to operating lease income and expected amortization expense during the next five years and thereafter related to the above and below market leases and acquired in-place lease and other intangibles for property owned as of March 31, 2025 ($ in thousands):
| | | | | | | | | | | | | | |
| Period Ending December 31, | | Increase/(Decrease) to Operating Lease Income | | Amortization Expense |
| | | | |
| 2025 (last nine months) | | $ | 1,192 | | | $ | 3,677 | |
| 2026 | | 1,603 | | | 4,135 | |
| 2027 | | 1,567 | | | 3,924 | |
| 2028 | | 1,493 | | | 3,659 | |
| 2029 | | 1,496 | | | 3,589 | |
| Thereafter | | 14,315 | | | 26,927 | |
| Total | | $ | 21,666 | | | $ | 45,911 | |
Rent Receivables
There were $3.0 million and $2.6 million of rent receivables included in other assets on the consolidated balance sheets as of March 31, 2025 and December 31, 2024, respectively.
Operating Lease Income & Tenant Reimbursements
The following is a schedule of non-cancellable, contractual, future minimum rent under leases (excluding property operating expenses paid directly by tenant under net leases) at March 31, 2025 ($ in thousands):
| | | | | | | | |
| Period Ending December 31, | | Amount |
| | |
| 2025 (last nine months) | | $ | 42,564 | |
| 2026 | | 48,911 | |
| 2027 | | 45,272 | |
| 2028 | | 43,664 | |
| 2029 | | 42,639 | |
| Thereafter | | 121,968 | |
| Total | | $ | 345,018 | |
Tenant reimbursements, which consist of real estate taxes and utilities paid by the Company, which were reimbursable by the Company’s tenants pursuant to the terms of the lease agreements, were $1.0 million and $2.0 million for the three months ended March 31, 2025 and 2024, respectively. Tenant reimbursements are included in operating lease income on the Company’s consolidated statements of income.
Acquisitions
There were no acquisitions during the three months ended March 31, 2025.
The Company acquired the following properties during the three months ended March 31, 2024 ($ in thousands): | | | | | | | | | | | | | | | | | | | | | | | | | | | | | | | | | | | | | | | | |
| Acquisition Date | | Type | | Primary Location(s) | | Purchase Price/Fair Value on the Date of Foreclosure | | | | | Ownership Interest (1) | | | | | | | | | | | |
| February 2024 | (2) | Multifamily | | Los Angeles, CA | | $ | 14,110 | | | | | | 100.0% | | | | | | | | | | | |
| | | | | | | | | | | | | | | | | | | | | | |
| | | | | | | | | | | | | | | | | | | | | | |
| | | | | | | | | | | | | | | | | | | | | | |
| | | | | | | | | | | | | | | | | | | | | | |
| | | | | | | | | | | | | | | | | | | | | | |
| | | | | | | | | | | | | | | | | | | | | | |
| | | | | | | | | | | | | | | | | | | | | | |
| Total real estate acquisitions | | | | $ | 14,110 | | | | | | | | | | | | | | | | | |
(1)Properties were consolidated as of acquisition date.
(2)In February 2024, the Company acquired a multifamily portfolio consisting of three properties in Los Angeles, CA via foreclosure. The portfolio served as collateral for a mortgage loan receivable held for investment. The Company obtained a third-party appraisal of the properties. The $14.1 million fair value was determined by using the sales comparison and direct capitalization approaches. The appraiser utilized a capitalization rate of 5.5%. There was no gain or loss resulting from the foreclosure of the loan. The key inputs used to determine fair value were determined to be Level 3 inputs.
Sales
The Company sold the following property during the three months ended March 31, 2025 ($ in thousands): | | | | | | | | | | | | | | | | | | | | | | | | | | | | | | | | | | | | | | | | | | | | | | |
| Sales Date | | Type | | | | Primary Location(s) | | Sales Proceeds | | Net Book Value | | Realized Gain/(Loss) | | | | Properties | | | | |
| March 2025 | | Retail | | | | Jenks, OK | | $ | 13,079 | | | $ | 9,272 | | | $ | 3,807 | | | | | 1 | | | | |
| | | | | | | | | | | | | | | | | | | | |
| | | | | | | | | | | | | | | | | | | | |
| | | | | | | | | | | | | | | | | | | | |
| | | | | | | | | | | | | | | | | | | | |
| | | | | | | | | | | | | | | | | | | | |
| | | | | | | | | | | | | | | | | | | | |
| | | | | | | | | | | | | | | | | | | | |
| | | | | | | | | | | | | | | | | | | | |
| Totals | | | | | | | | $ | 13,079 | | | $ | 9,272 | | | $ | 3,807 | | | | | | | | | |
The Company did not have any sales during the three months ended March 31, 2024.
6. DEBT OBLIGATIONS, NET
The details of the Company’s debt obligations at March 31, 2025 and December 31, 2024 are as follows ($ in thousands):
March 31, 2025
| | | | | | | | | | | | | | | | | | | | | | | | | | | | | | | | | | | | | | | | | | | | |
| Secured Debt Obligations | | Committed Amount | | Outstanding Principal Amount | | Carrying Value | | Average Cost of Funds(1) | | Current Maturity | | Final Stated Maturity(2) | | Carrying Value of Collateral |
| Loan Repurchase Facility | | $ | 500,000 | | | $ | 62,738 | | | $ | 62,738 | | | 6.47% | | 9/27/2025 | | 9/27/2027 | | $ | 97,490 | |
| Loan Repurchase Facility | | 300,000 | | | — | | | — | | | —% | | 10/21/2027 | | 10/21/2029 | | — | |
| Loan Repurchase Facility | | 200,000 | | | — | | | — | | | —% | | 10/3/2025 | | 10/3/2027 | | 14,624 | |
| Loan Repurchase Facility | | 56,000 | | | — | | | — | | | —% | | 4/30/2026 | | 4/30/2029 | | — | |
| Loan Repurchase Facilities(3) | | $ | 1,056,000 | | | $ | 62,738 | | | $ | 62,738 | | | | | | | | | $ | 112,114 | |
| | | | | | | | | | | | | | |
| | | | | | | | | | | | | | |
| | | | | | | | | | | | | | |
| | | | | | | | | | | | | | |
| Mortgage Debt | | N/A | | 423,009 | | | 425,690 | | | 6.13% | | 2025-2034(4) | | 2027-2048 | | 430,951 | |
| CLO Debt | | N/A | | 275,623 | | | 275,623 | | | 6.30% | | 2025-2026(5) | | 12/15/2036 | | 424,493 | |
| Revolving Credit Facility(6) | | 850,000 | | | — | | | — | | | —% | | 12/20/2028 | | 12/20/2029 | | N/A |
| Senior Unsecured Notes | | N/A | | 2,021,108 | | | 2,005,703 | | | 5.23% | | 2025-2031 | | 2025-2031 | | N/A |
| Total Debt Obligations, net | | $ | 1,906,000 | | | $ | 2,782,478 | | | $ | 2,769,754 | | | | | | | | | $ | 967,558 | |
(1)Interest rates on floating rate debt reflect the applicable index in effect as of March 31, 2025. Excludes deferred financing costs.
(2)Final Stated Maturity assumes extensions at our option are exercised with consent of financing providers, where applicable.
(3)Carrying value excludes $1.6 million of unamortized deferred financing costs included in Other Assets.
(4)Anticipated Repayment Dates.
(5)Represents the estimated maturity dates based on the underlying loan maturities.
(6)The obligations under the revolving credit facility are secured by equity pledges of certain subsidiaries of the Company. Carrying Value excludes $8.3 million of unamortized deferred financing costs included in Other Assets.
December 31, 2024
| | | | | | | | | | | | | | | | | | | | | | | | | | | | | | | | | | | | | | | | | | | | |
| Secured Debt Obligations | | Committed Amount | | Outstanding Principal Amount | | Carrying Value | | Average Cost of Funds(1) | | Current Maturity | | Final Stated Maturity(2) | | Carrying Value of Collateral |
| Loan Repurchase Facility | | $ | 500,000 | | | $ | 62,738 | | | $ | 62,738 | | | 6.55% | | 9/27/2025 | | 9/27/2027 | | $ | 97,254 | |
| Loan Repurchase Facility | | 300,000 | | | — | | | — | | | —% | | 10/21/2027 | | 10/21/2029 | | — | |
| Loan Repurchase Facility | | 200,000 | | | — | | | — | | | —% | | 10/3/2025 | | 10/3/2027 | | 14,636 | |
| Loan Repurchase Facility | | 100,000 | | | — | | | — | | | —% | | 1/22/2025 | | 1/22/2026 | | — | |
| Loan Repurchase Facility | | 56,000 | | | — | | | — | | | —% | | 4/30/2026 | | 4/30/2029 | | — | |
| Loan Repurchase Facilities(3) | | $ | 1,156,000 | | | $ | 62,738 | | | $ | 62,738 | | | | | | | | | $ | 111,890 | |
| | | | | | | | | | | | | | |
| | | | | | | | | | | | | | |
| | | | | | | | | | | | | | |
| | | | | | | | | | | | | | |
| Mortgage Debt | | N/A | | 443,733 | | | 446,397 | | | 6.09% | | 2025-2034(4) | | 2027-2048 | | 451,880 | |
| CLO Debt | | N/A | | 601,464 | | | 601,429 | | | 6.36% | | 2025-2026(5) | | 2036-2038 | | 831,270 | |
| Revolving Credit Facility(6) | | 725,000 | | | — | | | — | | | —% | | 12/20/2028 | | 12/20/2029 | | N/A |
| Senior Unsecured Notes | | N/A | | 2,041,557 | | | 2,025,053 | | | 5.22% | | 2025-2031 | | 2025-2031 | | N/A |
| Total Debt Obligations, net | | $ | 1,881,000 | | | $ | 3,149,492 | | | $ | 3,135,617 | | | | | | | | | $ | 1,395,040 | |
(1)Interest rates on floating rate debt reflect the applicable index in effect as of December 31, 2024. Excludes deferred financing costs.
(2)Final Stated Maturity assumes extensions at our option are exercised with consent of financing providers, where applicable.
(3)Carrying value excludes $2.1 million of unamortized deferred financing costs included in Other Assets.
(4)Anticipated Repayment Dates.
(5)Represents the estimated maturity dates based on the underlying loan maturities.
(6)The obligations under the revolving credit facility are secured by equity pledges of certain subsidiaries of the Company. Carrying Value excludes $7.1 million of unamortized deferred financing costs included in Other Assets.
Senior Unsecured Notes
As of March 31, 2025, the Company had $2.0 billion of senior unsecured notes outstanding. These unsecured financings were comprised of $287.7 million in aggregate principal amount of 5.25% senior notes due 2025 (the “2025 Notes”), $599.5 million in aggregate principal amount of 4.25% senior notes due 2027 (the “2027 Notes”), $633.9 million in aggregate principal amount of 4.75% senior notes due 2029 (the “2029 Notes”) and $500.0 million in aggregate principal amount of 7.00% senior notes due 2031 (the “2031 Notes”, collectively with the 2025 Notes, the 2027 Notes and the 2029 Notes, the “Notes”). The Company and certain subsidiaries of LCFH currently guarantee the obligations under the Notes and the indenture.
The Notes require interest payments semi-annually in cash in arrears, are unsecured, and are subject to an unencumbered assets to unsecured debt covenant. The Company may redeem the Notes prior to their stated maturity, in whole or in part, at any time or from time to time, with required notice and at a redemption price as specified in each respective indenture governing the Notes, plus accrued and unpaid interest, if any, to the redemption date. The board of directors has authorized the Company to repurchase any or all of the Notes from time to time without further approval. During the three months ended March 31, 2025, the Company repurchased $8.0 million of the 2025 Notes and $12.4 million of the 2027 Notes, recognizing a net gain on extinguishment of debt of $6 thousand and $250 thousand, respectively.
Revolving Credit Facility
The Company’s Revolving Credit Facility is available on a revolving basis to finance the Company’s working capital needs and for general corporate purposes. On January 2, 2025, the Company increased the aggregate maximum borrowing amount of the Revolving Credit Facility to $850.0 million, following the upsize to $725 million on December 20, 2024. The Revolving Credit Facility also allows the Company to enter into additional incremental revolving commitments up to an aggregate facility size of $1.3 billion subject to certain customary conditions. Borrowings under the Revolving Credit Facility bear interest at a rate equal to adjusted term SOFR plus a margin. The margin for borrowings is adjustable based on the Company’s credit rating and is between 77.5 basis points and 170 basis points. As of March 31, 2025, the Company had no outstanding borrowings on the Revolving Credit Facility.
The obligations under the Revolving Credit Facility are guaranteed by the Company and certain of its subsidiaries. The Revolving Credit Facility is secured by a pledge of the shares of (or other ownership or equity interests in) certain subsidiaries to the extent the pledge is not restricted under existing regulations, law or contractual obligations.
Following the date on which the Company has received an investment grade rating from at least two rating agencies, the Revolving Credit Facility will be automatically amended, the pledge of the shares of (or other ownership or equity interest in) certain subsidiaries will be terminated, and each guarantor (other than Ladder Capital Corp and any subsidiary that is a trigger guarantor) will be released and discharged from all obligations as a guarantor and/or pledgor. There is no guarantee that the Company will achieve or maintain an investment grade rating.
Collateralized Loan Obligations (“CLO”) Debt
As of March 31, 2025, the Company had $275.6 million of matched term, non-mark-to-market and non-recourse CLO debt included in debt obligations on its consolidated balance sheets.
In July 2021, the Company financed a pool of $607.5 million of loans in a managed CLO transaction (“LCCM 2021-FL2”), which generated $498.2 million of gross proceeds to Ladder. On February 18, 2025, the Company redeemed all outstanding obligations of LCCM 2021-FL2. In December 2021, the Company financed a pool of $729.4 million of loans in a managed CLO transaction (“LCCM 2021-FL3”), which generated $566.2 million of gross proceeds to Ladder. As of March 31, 2025, LCCM 2021-FL3 is a VIE and the Company is the primary beneficiary and, therefore, consolidates the VIE. Refer to Note 9, Consolidated Variable Interest Entities for further detail.
Loan and Securities Repurchase Financing
As outlined in the March 31, 2025 table above, the Company has entered into four committed master repurchase agreements to finance its lending activities, totaling $1.1 billion of credit capacity and $62.7 million outstanding.
Assets pledged as collateral under these facilities are generally limited to first lien whole mortgage loans, mezzanine loans and certain interests in such first mortgage and mezzanine loans. The lenders have sole discretion to include collateral in these facilities and to determine the market value of the collateral. In certain cases the lenders may require additional collateral, a full or partial repayment of the facilities (margin call) or a reduction in undrawn availability under the facilities.
The Company has also entered into master repurchase agreements with several counterparties to finance real estate securities. The securities that serve as collateral for these borrowings are typically highly liquid AAA-rated CMBS with relatively short duration and significant subordination. As of March 31, 2025, the Company had no securities repurchase debt outstanding.
As of March 31, 2025, no loan repurchase facilities were due within 90 days of March 31, 2025 and no counterparties held collateral that exceeded the amounts borrowed under the related loan and securities repurchase agreements by more than $151.4 million, or 10% of the Company’s total equity. As of March 31, 2025, the weighted average haircut, or the percent of collateral value in excess of the loan amount, under the Company’s repurchase agreements was 44%. There have been no significant fluctuations in haircuts across asset classes on the repurchase facilities.
Mortgage Loan Financing
The Company typically finances its real estate investments with long-term, non-recourse mortgage financing. These mortgage loans have carrying amounts of $425.7 million and $446.4 million, net of unamortized premiums of $3.5 million and $3.7 million as of March 31, 2025 and December 31, 2024, respectively, representing proceeds received upon financing greater than the contractual amounts due under these agreements. The premiums are being amortized over the remaining life of the respective debt instruments using the effective interest method. The Company recorded $0.2 million of premium amortization for the three months ended March 31, 2025 and 2024. During the three months ended March 31, 2025, the Company executed no new term debt agreements. During the three months ended March 31, 2024, the Company executed five new term debt agreements to finance properties in its real estate portfolio with a carrying amount of $40.1 million.
Financial Covenants
Our borrowings under certain financing agreements are subject to financial covenants, including maximum leverage ratio limits, minimum net worth requirements, minimum liquidity requirements, minimum fixed charge coverage ratio requirements, and minimum unencumbered assets to unsecured debt requirements. The Company’s subsidiary, Tuebor Captive Insurance
Company LLC (“Tuebor”), was previously a captive insurance company subject to state regulations, which required regulatory approval for dividend distributions, limiting the Company's ability to utilize cash held by Tuebor. Effective January 31, 2025, Tuebor is no longer licensed as a captive insurer and is no longer subject to state regulation.
The Company was in compliance with all covenants as of March 31, 2025.
Combined Maturity of Debt Obligations
The following schedule reflects the Company’s contractual payments under borrowings by maturity ($ in thousands):
| | | | | | | | |
| Period ending December 31, | | Borrowings by
Maturity(1) |
| 2025 (last nine months) | | $ | 326,011 | |
| 2026 | | 89,161 | |
| 2027 | | 805,391 | |
| 2028 | | 24,317 | |
| 2029 | | 669,484 | |
| Thereafter | | 592,490 | |
| Subtotal | | 2,506,854 | |
| Debt issuance costs included in senior unsecured notes | | (15,405) | |
| | |
| | |
| | |
| | |
| Debt issuance costs included in mortgage loan financings | | (860) | |
| Net premiums included in mortgage loan financings (2) | | 3,541 | |
| Total (3) | | $ | 2,494,130 | |
(1)The allocation of repayments under the Company’s committed loan repurchase facilities is based on the earlier of: (i) the final stated maturity date of each agreement; or (ii) the maximum maturity date of the collateral loans, assuming all extension options are exercised by the borrower. Repayments of the Company's mortgage debt is based on the anticipated repayment dates as defined in the mortgage loan agreements.
(2)Represents sales proceeds received in excess of loan amounts sold into securitizations that are amortized as a reduction to interest expense using the effective interest method over the life of the underlying loan.
(3)Total does not include $275.6 million of consolidated CLO debt obligations, as the satisfaction of these liabilities will be paid through cash flow from loan collateral including amortization and will not require cash outlays from us.
7. DERIVATIVE INSTRUMENTS
The Company primarily uses derivative instruments to economically manage the fair value variability of fixed rate assets caused by interest rate fluctuations and overall portfolio market risk. The following is a breakdown of the derivatives outstanding as of March 31, 2025 and December 31, 2024 ($ in thousands):
March 31, 2025 | | | | | | | | | | | | | | | | | | | | | | | | | | |
| | | | | Fair Value | | Remaining
Maturity
(years) |
| Contract Type | | Notional | | Asset(1) | | Liability(1) | |
| Caps | | | | | | | | |
| 1 Month Term SOFR | | $ | 90,000 | | | $ | 279 | | | $ | — | | | 0.38 |
| Futures | | | | | | | | |
| | | | | | | | |
| 10-year Treasury-Note Futures | | 42,500 | | | 188 | | | — | | | 0.27 |
| | | | | | | | |
| | | | | | | | |
| Total futures | | 42,500 | | | 188 | | | — | | | |
| | | | | | | | |
| | | | | | | | |
| | | | | | | | |
| | | | | | | | |
| | | | | | | | |
| | | | | | | | |
| Total derivatives | | $ | 132,500 | | | $ | 467 | | | $ | — | | | |
(1)Shown as derivative instruments in the accompanying consolidated balance sheet.
December 31, 2024 | | | | | | | | | | | | | | | | | | | | | | | | | | |
| | | | | Fair Value | | Remaining
Maturity
(years) |
| Contract Type | | Notional | | Asset(1) | | Liability(1) | |
| | | | | | | | |
| Caps | | | | | | | | |
| 1 Month Term SOFR | | $ | 90,000 | | | $ | 432 | | | $ | — | | | 0.62 |
| | | | | | | | |
| | | | | | | | |
| | | | | | | | |
| | | | | | | | |
| | | | | | | | |
| | | | | | | | |
| | | | | | | | |
| | | | | | | | |
| Options | | | | | | | | |
| | | | | | | | |
| Options | | N/A | (2) | 5 | | | — | | | 0.05 |
| | | | | | | | |
| Total credit derivatives | | — | | | 5 | | | — | | | |
| Total derivatives | | $ | 90,000 | | | $ | 437 | | | $ | — | | | |
(1)Shown as derivative instruments in the accompanying consolidated balance sheet.
(2)The Company held 275 options contracts as of December 31, 2024.
The following table summarizes the net realized gains (losses) and unrealized gains (losses) on derivatives, by primary underlying risk exposure, as included in net result from derivatives transactions in the consolidated statements of income for the three months ended March 31, 2025 and 2024 ($ in thousands):
| | | | | | | | | | | | | | | | | | | | | | | |
| | | | Three Months Ended March 31, 2025 |
| Contract Type | | | | | | | Unrealized
Gain/(Loss) | | Realized
Gain/(Loss) | | Net Result
from
Derivative
Transactions |
| | | | | | | | | | | |
| Caps | | | | | | | $ | (154) | | | $ | 189 | | | $ | 35 | |
| Futures | | | | | | | 189 | | | 104 | | | 293 | |
| | | | | | | | | | | |
| Options | | | | | | | — | | | (5) | | | (5) | |
| Total | | | | | | | $ | 35 | | | $ | 288 | | | $ | 323 | |
| | | | | | | | | | | | | | | | | | | | | | | |
| | | | Three Months Ended March 31, 2024 |
| Contract Type | | | | | | | Unrealized
Gain/(Loss) | | Realized
Gain/(Loss) | | Net Result
from
Derivative
Transactions |
| Caps | | | | | | | $ | (248) | | | $ | 418 | | | $ | 170 | |
| Futures | | | | | | | (532) | | | 4,382 | | | 3,850 | |
| | | | | | | | | | | |
| Options | | | | | | | — | | | (1) | | | (1) | |
| Total | | | | | | | $ | (780) | | | $ | 4,799 | | | $ | 4,019 | |
Futures
Collateral posted with the Company’s futures counterparties is segregated in the Company’s books and records. Interest rate futures are centrally cleared by the Chicago Mercantile Exchange (“CME”) through a futures commission merchant. Interest rate futures that are governed by an International Swaps and Derivatives Association (“ISDA”) agreement provide for bilateral collateral pledging based on the counterparties’ market value. The counterparties have the right to re-pledge the collateral posted but have the obligation to return the pledged collateral, or substantially the same collateral, if agreed to by us, as the market value of the interest rate futures change.
The Company is required to post initial margin and daily variation margin for its interest rate futures that are centrally cleared by CME. CME determines the fair value of the Company’s centrally cleared futures, including daily variation margin. Variation margin pledged on the Company’s centrally cleared interest rate futures is settled against the realized results of these futures. The Company’s counterparties held $1.1 million of cash margin as collateral for derivatives as of March 31, 2025, which is included in restricted cash in the consolidated balance sheets and no cash margin as collateral for derivatives as of December 31, 2024.
8. OFFSETTING ASSETS AND LIABILITIES
The following tables present both gross information and net information about derivatives and other instruments eligible for offset in the statement of financial position as of March 31, 2025 and December 31, 2024. The Company’s accounting policy is to record derivative asset and liability positions on a gross basis; therefore, the following tables present the gross derivative asset and liability positions recorded on the balance sheets, while also disclosing the eligible amounts of financial instruments and cash collateral to the extent those amounts could offset the gross amount of derivative asset and liability positions. The actual amounts of collateral posted by or received from counterparties may be in excess of the amounts disclosed in the following tables as the following only disclose amounts eligible to be offset to the extent of the recorded gross derivative positions.
The following table represents offsetting of financial assets and derivative assets as of March 31, 2025 ($ in thousands):
| | | | | | | | | | | | | | | | | | | | | | | | | | | | | | | | | | | | | | |
| | | | | | | | | | | | |
| Description | | Gross amounts of
recognized assets | | Gross amounts
offset in the
balance sheet | | Net amounts of
assets presented
in the balance
sheet | | Gross amounts not offset in the
balance sheet | | Net amount |
| | | | Financial
instruments | | Cash collateral
received/(posted)(1) | |
| | | | | | | | | | | | |
| Derivatives | | $ | 467 | | | $ | — | | | $ | 467 | | | $ | — | | | $ | (1,084) | | | $ | (617) | |
| Total | | $ | 467 | | | $ | — | | | $ | 467 | | | $ | — | | | $ | (1,084) | | | $ | (617) | |
(1)Included in restricted cash on consolidated balance sheet.
The following table represents offsetting of financial liabilities and derivative liabilities as of March 31, 2025 ($ in thousands): | | | | | | | | | | | | | | | | | | | | | | | | | | | | | | | | | | | | | | |
| Description | | Gross amounts of
recognized
liabilities | | Gross amounts
offset in the
balance sheet | | Net amounts of
liabilities
presented in the
balance sheet | | Gross amounts not offset in the
balance sheet | | Net amount |
| | | | Financial
instruments
collateral | | Cash collateral
posted/(received)(1) | |
| | | | | | | | | | | | |
| | | | | | | | | | | | |
| Repurchase agreements | | $ | 62,738 | | | $ | — | | | $ | 62,738 | | | $ | 62,738 | | | $ | — | | | $ | 62,738 | |
| Total | | $ | 62,738 | | | $ | — | | | $ | 62,738 | | | $ | 62,738 | | | $ | — | | | $ | 62,738 | |
(1)Included in restricted cash on consolidated balance sheet.
The following table represents offsetting of financial assets and derivative assets as of December 31, 2024 ($ in thousands):
| | | | | | | | | | | | | | | | | | | | | | | | | | | | | | | | | | | | | | |
| Description | | Gross amounts of
recognized assets | | Gross amounts
offset in the
balance sheet | | Net amounts of
assets presented
in the balance
sheet | | Gross amounts not offset in the
balance sheet | | Net amount |
| | | | Financial
instruments | | Cash collateral
received/(posted)(1) | |
| | | | | | | | | | | | |
| Derivatives | | $ | 437 | | | $ | — | | | $ | 437 | | | $ | — | | | $ | — | | | $ | 437 | |
| Total | | $ | 437 | | | $ | — | | | $ | 437 | | | $ | — | | | $ | — | | | $ | 437 | |
(1)Included in restricted cash on consolidated balance sheet.
The following table represents offsetting of financial liabilities and derivative liabilities as of December 31, 2024 ($ in thousands): | | | | | | | | | | | | | | | | | | | | | | | | | | | | | | | | | | | | | | |
| Description | | Gross amounts of
recognized
liabilities | | Gross amounts
offset in the
balance sheet | | Net amounts of
liabilities
presented in the
balance sheet | | Gross amounts not offset in the
balance sheet | | Net amount |
| | | | Financial
instruments
collateral | | Cash collateral
posted/(received)(1) | |
| | | | | | | | | | | | |
| | | | | | | | | | | | |
| Repurchase agreements | | $ | 62,738 | | | $ | — | | | $ | 62,738 | | | $ | 62,738 | | | $ | — | | | $ | 62,738 | |
| Total | | $ | 62,738 | | | $ | — | | | $ | 62,738 | | | $ | 62,738 | | | $ | — | | | $ | 62,738 | |
(1)Included in restricted cash on consolidated balance sheet.
Master netting agreements that the Company has entered into with its derivative and repurchase agreement counterparties allow for netting of the same transaction, in the same currency, on the same date. Assets, liabilities, and collateral subject to master netting agreements as of March 31, 2025 and December 31, 2024 are disclosed in the tables above. The Company does not present its derivative and repurchase agreements net on the consolidated financial statements as it has elected gross presentation.
9. CONSOLIDATED VARIABLE INTEREST ENTITIES
The Company consolidates on its balance sheet one CLO that is considered a VIE as of March 31, 2025 and consolidated two CLOs that were considered VIEs as of December 31, 2024 ($ in thousands):
| | | | | | | | | | | |
| March 31, 2025 | | December 31, 2024 |
| |
| | | |
| | | |
| Mortgage loan receivables held for investment, net, at amortized cost | $ | 424,493 | | | $ | 831,270 | |
| | | |
| Accrued interest receivable | 2,627 | | | 5,530 | |
| Other assets | 13,780 | | | 42,621 | |
| Total assets | $ | 440,900 | | | $ | 879,421 | |
| Debt obligations, net | $ | 275,623 | | | $ | 601,429 | |
| | | |
| Accrued expenses | 820 | | | 1,806 | |
| | | |
| Total liabilities | 276,443 | | | 603,235 | |
| Net equity in VIEs (eliminated in consolidation) | 164,457 | | | 276,186 | |
| | | |
| Total equity | 164,457 | | | 276,186 | |
| Total liabilities and equity | $ | 440,900 | | | $ | 879,421 | |
Refer to Note 6, Debt Obligations, Net - Collateralized Loan Obligations (“CLO”) Debt for further details.
10. EQUITY
Stock Repurchases
On April 24, 2024, the board of directors authorized the repurchase of $75.0 million of the Company’s Class A common stock from time to time without further approval. This authorization increased the remaining outstanding authorization per the July 27, 2022 authorization from $43.6 million to $75.0 million. Stock repurchases by the Company are generally made for cash in open market transactions at prevailing market prices but may also be made in privately negotiated transactions or otherwise. The timing and amount of purchases are determined based upon prevailing market conditions, the Company’s liquidity requirements, contractual restrictions and other factors. As of March 31, 2025, the Company has a remaining amount available for repurchase of $66.8 million, which represents 4.6% in the aggregate of its outstanding Class A common stock, based on the closing price of $11.41 per share on such date.
Subsequent to quarter end, on April 23, 2025, the board of directors authorized the repurchase of $100.0 million of the Company’s Class A common stock from time to time without further approval. This authorization increased the remaining outstanding authorization per the April 24, 2024 authorization from $66.8 million to $100.0 million.
The following tables summarize the Company’s repurchase activity of its Class A common stock during the three months ended March 31, 2025 and 2024 ($ in thousands):
| | | | | | | | | | | | | | | | |
| | Shares | | | | Amount(1) |
| Authorizations remaining as of December 31, 2024 | | | | | | $ | 67,604 | |
| | | | | | |
| Repurchases paid: | | | | | | |
| | | | | | |
| | | | | | |
| March 1, 2025 - March 31, 2025 | | 70,506 | | | | | (805) | |
| | | | | | |
| | | | | | |
| | | | | | |
| | | | | | |
| | | | | | |
| | | | | | |
| | | | | | |
| | | | | | |
| | | | | | |
| Authorizations remaining as of March 31, 2025 | | | | | | $ | 66,799 | |
(1)Amount excludes commissions paid associated with share repurchases.
| | | | | | | | | | | | | | |
| | Shares | | Amount(1) |
| Authorizations remaining as of December 31, 2023 | | | | $ | 44,256 | |
| | | | |
| Repurchases paid: | | | | |
| | | | |
| | | | |
| March 1, 2024 - March 31, 2024 | | 60,000 | | | (647) | |
| | | | |
| | | | |
| | | | |
| | | | |
| | | | |
| | | | |
| | | | |
| | | | |
| | | | |
| Authorizations remaining as of March 31, 2024 | | | | $ | 43,609 | |
(1)Amount excludes commissions paid associated with share repurchases.
Dividends
The following table presents dividends declared (on a per share basis) of Class A common stock for the three months ended March 31, 2025 and 2024:
| | | | | | | | | |
| Declaration Date | | Dividend per Share | |
| March 14, 2025 | | $ | 0.23 | | |
| | | |
| | | |
| | | |
| Total | | $ | 0.23 | | |
| | | |
| March 15, 2024 | | $ | 0.23 | | |
| | | |
| | | |
| | | |
| Total | | $ | 0.23 | | |
| | | |
| | | |
| | | |
| | | |
| | | |
| | | |
Changes in Accumulated Other Comprehensive Income (Loss)
The following table presents changes in accumulated other comprehensive income related to the cumulative difference between the fair market value and the amortized cost basis of securities classified as available for sale for the three months ended March 31, 2025 and 2024 ($ in thousands):
| | | | | | | | | | | | | | | | | |
| Three Months Ended March 31, | | |
| 2025 | | 2024 | | | | | | |
| Accumulated Other Comprehensive Income (Loss) beginning of period | $ | (4,866) | | | $ | (13,853) | | | | | | | |
| Unrealized gain (loss) on securities, available for sale | (2,169) | | | 4,054 | | | | | | | |
| Reclassification adjustment for (gain) loss included in net income (loss) | (180) | | | (21) | | | | | | | |
| | | | | | | | | |
| | | | | | | | | |
| | | | | | | | | |
| Accumulated Other Comprehensive Income (Loss) end of period | $ | (7,215) | | | $ | (9,820) | | | | | | | |
11. NONCONTROLLING INTERESTS
Noncontrolling Interests in Consolidated Ventures
As of March 31, 2025, the Company consolidates two ventures and in each, there are different noncontrolling investors, which own between 10.0% - 25.0% of such ventures. These ventures hold investments in a 40-building student housing portfolio in Isla Vista, CA with a book value of $77.6 million, and a single-tenant office building in Oakland County, MI with a book value of $8.7 million. The Company makes distributions and allocates income from these ventures to the noncontrolling interests in accordance with the terms of the respective governing agreements.
12. EARNINGS PER SHARE
The Company’s net income (loss) and weighted average shares outstanding for the three months ended March 31, 2025 and 2024 consist of the following:
| | | | | | | | | | | | | | | | | | | | |
| | Three Months Ended March 31, | | |
| ($ in thousands except share amounts) | | 2025 | | 2024 | | | | | | |
| | | | | | | | | | |
| Basic and Diluted Net income (loss) available for Class A common shareholders | | $ | 11,775 | | | $ | 16,609 | | | | | | | |
| | | | | | | | | | |
| Weighted average shares outstanding: | | | | | | | | | | |
| Basic | | 125,628,951 | | | 125,315,765 | | | | | | | |
| Diluted | | 126,279,680 | | | 125,520,373 | | | | | | | |
The calculation of basic and diluted net income (loss) per share amounts for the three months ended March 31, 2025 and 2024 consist of the following:
| | | | | | | | | | | | | | | | | | | | |
| | Three Months Ended March 31, | | |
| (In thousands except share and per share amounts) (1) | | 2025 | | 2024 | | | | | | |
| Basic Net Income (Loss) Per Share of Class A Common Stock | | | | | | | | | | |
Numerator: | | | | | | | | | | |
| Net income (loss) attributable to Class A common shareholders | | $ | 11,775 | | | $ | 16,609 | | | | | | | |
Denominator: | | | | | | | | | | |
| Weighted average number of shares of Class A common stock outstanding | | 125,628,951 | | | 125,315,765 | | | | | | | |
| Basic net income (loss) per share of Class A common stock | | $ | 0.09 | | | $ | 0.13 | | | | | | | |
| | | | | | | | | | |
| Diluted Net Income (Loss) Per Share of Class A Common Stock | | | | | | | | | | |
| Numerator: | | | | | | | | | | |
| Net income (loss) attributable to Class A common shareholders | | $ | 11,775 | | | $ | 16,609 | | | | | | | |
| | | | | | | | | | |
| | | | | | | | | | |
| | | | | | | | | | |
| Diluted net income (loss) attributable to Class A common shareholders | | 11,775 | | | 16,609 | | | | | | | |
| Denominator: | | | | | | | | | | |
| Basic weighted average number of shares of Class A common stock outstanding | | 125,628,951 | | | 125,315,765 | | | | | | | |
| Add - dilutive effect of: | | | | | | | | | | |
| | | | | | | | | | |
| Incremental shares of unvested Class A restricted stock(1) | | 650,729 | | | 204,608 | | | | | | | |
| | | | | | | | | | |
| Diluted weighted average number of shares of Class A common stock outstanding (2)(3) | | 126,279,680 | | | 125,520,373 | | | | | | | |
| Diluted net income (loss) per share of Class A common stock | | $ | 0.09 | | | $ | 0.13 | | | | | | | |
(1)The Company applies the treasury stock method.
(2)There were 23,255 and 378,668 anti-dilutive shares for the three months ended March 31, 2025 and 2024, respectively.
13. STOCK-BASED AND OTHER COMPENSATION PLANS
Summary of Stock and Shares Unvested/Outstanding
The following table summarizes the impact on the consolidated statements of income of the various stock-based compensation plans and other compensation plans ($ in thousands):
| | | | | | | | | | | | | | | | | |
| Three Months Ended March 31, | | |
| 2025 | | 2024 | | | | | | |
| Stock-based compensation expense | $ | 11,215 | | | $ | 10,298 | | | | | | | |
| | | | | | | | | |
| | | | | | | | | |
| Total Stock-Based Compensation Expense | $ | 11,215 | | | $ | 10,298 | | | | | | | |
A summary of the grants is presented below:
| | | | | | | | | | | | | | | | | | | | | | | | | | | | | | | | | | | |
| | | | Three Months Ended March 31, |
| | | | | | 2025 | | 2024 | | |
| | | | | | | | | Number
of Shares | | Weighted
Average
Fair Value
Per Share | | Number
of Shares | | Weighted
Average
Fair Value
Per Share | | | | |
| | | | | | | | | | | | | | | | | | | |
| Grants - Class A Common Stock | | | | | | | | | 1,820,027 | | | $ | 11.68 | | | 1,855,541 | | | $ | 10.70 | | | | | |
| | | | | | | | | | | | | | | | | | | |
| | | | | | | | | | | | | | | | | | | |
The table below presents the number of unvested shares of Class A common stock and outstanding stock options at March 31, 2025 and changes during 2025 of the Class A common stock and stock options of Ladder Capital Corp:
| | | | | | | | | | | | | | | | | | | |
| Restricted Stock | | Weighted Average Grant Date Fair Value | | Stock Options | | |
| Nonvested/Outstanding at December 31, 2024 | 2,020,752 | | | $ | 12.28 | | | 623,788 | | | |
| Granted | 1,820,027 | | | 11.68 | | | — | | | |
| | | | | | | |
| Vested | (1,776,196) | | | 11.49 | | | — | | | |
| Forfeited | — | | | — | | | — | | | |
| Expired | — | | | — | | | (439,760) | | | |
| Nonvested/Outstanding at March 31, 2025 | 2,064,583 | | | $ | 12.44 | | | 184,028 | | | |
| | | | | | | |
| Exercisable at March 31, 2025 (1) | | | | | 184,028 | | | |
(1)The weighted average exercise price of outstanding options is $11.86 at March 31, 2025.
At March 31, 2025, there was $19.0 million of total unrecognized compensation cost related to certain share-based compensation awards that is expected to be recognized over a period of up to 35.1 months, with a weighted average remaining vesting period of 28.5 months.
2014 Omnibus Incentive Plan
In connection with the IPO Transactions, the 2014 Ladder Capital Corp Omnibus Incentive Equity Plan (the “2014 Omnibus Incentive Plan”) was adopted by the board of directors on February 11, 2014, and provided certain members of management, employees and directors of the Company or its affiliates with additional incentives including grants of stock options, stock appreciation rights, restricted stock, other stock-based awards and other cash-based awards.
2023 Omnibus Incentive Plan
At the Company’s Annual Meeting held on June 6, 2023, the stockholders of the Company approved the Ladder Capital Corp 2023 Omnibus Incentive Plan (the “2023 Omnibus Incentive Plan”), effective as of the date of the Annual Meeting (the “Effective Date”). The 2023 Omnibus Incentive Plan superseded and replaced the 2014 Omnibus Incentive Plan in its entirety as of the Effective Date.
The aggregate number of shares of the Company’s Class A common stock that will be available for issuance to employees, non-employee directors and consultants of the Company and its affiliates under the 2023 Omnibus Incentive Plan will not exceed 3,000,000 shares of Class A common stock, plus an additional amount, not to exceed 10,253,867 shares of Class A common stock, remaining available for new awards under the 2014 Omnibus Incentive Plan as of the Effective Date, subject to the terms and conditions set forth in the 2023 Omnibus Incentive Plan.
Annual Incentive Awards Granted in 2025 with respect to 2024 Performance
For 2024 performance, certain employees received stock-based incentive equity in February 2025. Restricted stock subject to time-based vesting criteria will vest in three installments on February 18 of each of 2026, 2027 and 2028, subject to continued employment on the applicable vesting dates. The Company has elected to recognize the compensation expense related to the time-based vesting of the annual restricted stock awards for the entire award on a straight-line basis over the requisite service period for the entire award. Restricted stock subject to performance criteria is eligible to vest in three equal installments upon the Board’s confirmation that the Company achieves a pre-tax return on average equity, based on distributable earnings divided
by the Company’s average shareholders’ equity, equal to or greater than 8% for such year (the “Performance Target”) for the years ended December 31, 2025, 2026 and 2027, respectively. If the Company misses the Performance Target during either the first or second calendar year but meets the Performance Target for a subsequent year during the three-year performance period and the Company’s return on equity for such subsequent year and any years for which it missed its Performance Target equals or exceeds the compounded pre-tax return on average equity of 8% based on distributable earnings divided by the Company’s average shareholders’ equity, the performance-vesting restricted stock which failed to vest because the Company previously missed its Performance Target will vest subject to continued employment on the applicable vesting date (the “Catch-Up Provision”). Approximately 2/3 of all the shares subject to attainment of the Performance Target are also subject to the Catch-Up Provision, as the Catch-Up Provision is not available for the missed performance during the third performance year and has the effect of requiring the Company to achieve an average 8% return over the full three-year performance plan in order to be effective. Accruals of compensation cost for an award with a performance condition shall be based on the probable outcome of that performance condition. Therefore, compensation cost shall be accrued if it is probable that the performance condition will be achieved and shall not be accrued if it is not probable that the performance condition will be achieved. The probability of meeting the performance outcome is assessed quarterly.
On February 18, 2025, in connection with 2024 performance, annual stock awards were granted to management employees (each, a “Management Grantee”), with an aggregate grant date fair value of $11 million, which represents 962,821 shares of Class A common stock. The grant to Mr. Harris and approximately half of the grants to each of Ms. McCormack and Mr. Perelman were unrestricted. The other half of incentive equity granted to each of Ms. McCormack and Mr. Perelman is restricted stock subject to attainment of the Performance Target for the applicable years and is also subject to the Catch-Up Provision described above. For the grants to Mr. Miceli and Ms. Porcella (a total of 125,871 shares with an aggregate fair value of $1.5 million), approximately half of the awards are subject to time-based vesting criteria and the remaining half are subject to attainment of the Performance Target, including the Catch-Up Provision, for the applicable years.
On February 18, 2025, in connection with 2024 performance, annual stock awards were granted to certain non-management employees (“Non-Management Grantees”) with an aggregate grant date fair value of $9.6 million, which represents 825,016 shares of Class A common stock. Of these awards, 21,658 shares were unrestricted, 390,859 shares are subject to time-based vesting criteria and the remaining 412,499 shares are subject to the attainment of the Performance Target, including the Catch-Up Provision, for the applicable years.
Other 2025 Restricted Stock Awards
On February 18, 2025, certain members of the board of directors received annual restricted stock awards with a grant date fair value of $0.4 million, representing 32,190 shares of restricted Class A common stock, which will vest in full on the first anniversary of the date of grant, subject to continued service on the board of directors. Compensation expense related to the time-based vesting criteria of the award shall be recognized on a straight-line basis over the one-year vesting period.
Annual Incentive Awards Granted in 2024 with respect to 2023 Performance
For 2023 performance, certain employees received stock-based incentive equity in February 2024. Restricted stock subject to time-based vesting criteria will vest in three installments on February 18 of each of 2025, 2026 and 2027, subject to continued employment on the applicable vesting dates. The Company has elected to recognize the compensation expense related to the time-based vesting of the annual restricted stock awards for the entire award on a straight-line basis over the requisite service period for the entire award. Restricted stock subject to performance criteria is eligible to vest in three equal installments upon the compensation committee’s confirmation that the Company achieves the Performance Target for the years ended December 31, 2024, 2025 and 2026, respectively, subject to the Catch-Up Provision as described above.
On February 18, 2024, in connection with 2023 performance, annual stock awards were granted to Management Grantees with an aggregate grant date fair value of $10 million, which represents 937,560 shares of Class A common stock. The grant to Mr. Harris and approximately half of the grants to each of Ms. McCormack and Mr. Perelman were unrestricted. The other half of incentive equity granted to each of Ms. McCormack and Mr. Perelman is restricted stock subject to attainment of the Performance Target for the applicable years and is also subject to the Catch-Up Provision described above. For the grants to Mr. Miceli and Ms. Porcella (a total of 127,275 shares with an aggregate fair value of $1.4 million), approximately half of the awards are subject to time-based vesting criteria and the remaining half are subject to attainment of the Performance Target, including the Catch-Up Provision, for the applicable years.
On February 18, 2024, in connection with 2023 performance, annual stock awards were granted to certain Non-Management Grantees with an aggregate grant date fair value of $9.4 million, which represents 882,436 shares of Class A common stock. Of
these awards, 22,939 shares were unrestricted, 418,285 shares are subject to time-based vesting criteria and the remaining 441,212 shares are subject to the attainment of the Performance Target, including the Catch-Up Provision, for the applicable years.
Other 2024 Restricted Stock Awards
On February 18, 2024, certain members of the board of directors received annual restricted stock awards with a grant date fair value of $0.4 million, representing 35,545 shares of restricted Class A common stock, which will vest in full on the first anniversary of the date of grant, subject to continued service on the board of directors. Compensation expense related to the time-based vesting criteria of the award shall be recognized on a straight-line basis over the one-year vesting period.
Annual Incentive Awards Granted in 2023 with respect to 2022 Performance
For 2022 performance, certain employees received stock-based incentive equity in February 2023. Restricted stock subject to time-based vesting criteria will vest in three installments on February 18 of each of 2024, 2025 and 2026, subject to continued employment on the applicable vesting dates. The Company has elected to recognize the compensation expense related to the time-based vesting of the annual restricted stock awards for the entire award on a straight-line basis over the requisite service period for the entire award. Restricted stock subject to performance criteria is eligible to vest in three equal installments upon the compensation committee’s confirmation that the Company achieves the Performance Target for the years ended December 31, 2023, 2024 and 2025, respectively, subject to the Catch-Up Provision as described above.
On February 18, 2023, in connection with 2022 performance, annual stock awards were granted to Management Grantees with an aggregate grant date fair value of $8.5 million, which represents 733,607 shares of Class A common stock. The grant to Mr. Harris and approximately half of the grants to each of Ms. McCormack and Mr. Perelman were unrestricted. The other half of incentive equity granted to each of Ms. McCormack and Mr. Perelman is restricted stock subject to attainment of the Performance Target for the applicable years and is also subject to the Catch-Up Provision described above. For the grants to Mr. Miceli and Ms. Porcella (a total of 101,344 shares with an aggregate fair value of $1.2 million), approximately half of the awards are subject to time-based vesting criteria and the remaining half are subject to attainment of the Performance Target, including the Catch-Up Provision, for the applicable years.
On February 18, 2023, in connection with 2022 performance, annual stock awards were granted to certain Non-Management Grantees with an aggregate grant date fair value of $7.5 million, which represents 651,429 shares of Class A common stock. Of these awards, 19,558 shares were unrestricted, 306,162 shares are subject to time-based vesting criteria and the remaining 325,709 shares are subject to the attainment of the Performance Target, including the Catch-Up Provision, for the applicable years.
Other 2023 Restricted Stock Awards
On February 18, 2023, certain members of the board of directors received annual restricted stock awards with a grant date fair value of $0.4 million, representing 32,525 shares of restricted Class A common stock, which will vest in full on the first anniversary of the date of grant, subject to continued service on the board of directors. Compensation expense related to the time-based vesting criteria of the award shall be recognized on a straight-line basis over the one-year vesting period.
Change in Control
Upon a change in control (as defined in the respective award agreements), restricted stock awards to Mr. Miceli, Ms. McCormack, Mr. Perelman, Ms. Porcella (for her February 18, 2024 award), and one Non-Management Grantee will become fully vested if: (1) such Grantee continues to be employed through the closing of the change in control; or (2) after the signing of definitive documentation related to the change in control, but prior to its closing, such Grantee’s employment is terminated without cause or due to death or disability or the Grantee resigns for Good Reason, as defined in each Grantee’s employment agreement. The compensation committee retains the right, in its sole discretion, to provide for the accelerated vesting (in whole or in part) of the restricted stock awards granted.
In the event a Non-Management Grantee (except for the one grantee mentioned above and including Ms. Porcella, in regards to her awards granted prior to February 18, 2024), is terminated by the Company without cause within six months of certain changes in control, all unvested time shares shall vest on the termination date and all unvested performance shares shall remain outstanding and be eligible to vest (or be forfeited) in accordance with the performance conditions.
14. FAIR VALUE OF FINANCIAL INSTRUMENTS
Fair value is based upon internal models, using market quotations, broker quotations, counterparty quotations or pricing services quotations, which provide valuation estimates based upon reasonable market order indications and are subject to significant variability based on market conditions, such as interest rates, credit spreads and market liquidity. The fair value of the mortgage loan receivables held for sale is based upon a securitization model utilizing market data from recent securitization spreads and pricing.
Fair Value Summary Table
The carrying values and estimated fair values of the Company’s financial instruments, which are both reported at fair value on a recurring basis or amortized cost/par, at March 31, 2025 and December 31, 2024 are as follows ($ in thousands):
March 31, 2025 | | | | | | | | | | | | | | | | | | | | | | | | | | | | | | | | | | | |
| | | | | | | | | | Weighted Average |
| Assets: | Principal Amount | | Amortized Cost Basis/Purchase Price | | Fair Value | | Fair Value Method | | Yield
% | | Remaining
Maturity/Duration (years) |
| CMBS(1) | $ | 1,480,626 | | | $ | 1,478,529 | | | $ | 1,471,257 | | | Internal model | | 5.82 | % | | 2.93 |
| CMBS interest-only(1) | 436,227 | | (2) | 2,654 | | | 2,713 | | | Internal model | | 8.22 | % | | 0.78 |
| GNMA interest-only(3) | 32,359 | | (2) | 158 | | | 155 | | | Internal model | | 9.39 | % | | 3.73 |
| Agency securities(1) | 9 | | | 9 | | | 9 | | | Internal model | | 2.57 | % | | 0.45 |
| | | | | | | | | | | |
| | | | | | | | | | | |
| | | | | | | | | | | |
| Equity securities(3) | N/A | | 2,517 | | | 2,266 | | | Observable market prices | | N/A | | N/A |
| | | | | | | | | | | |
| | | | | | | | | | | |
| | | | | | | | | | | |
| | | | | | | | | | | |
| | | | | | | | | | | |
| Mortgage loan receivables held for investment, net, at amortized cost(4) | 1,671,069 | | | 1,665,243 | | | 1,646,270 | | | Discounted Cash Flow(5) | | 8.71 | % | | 1.14 |
| | | | | | | | | | | |
| | | | | | | | | | | |
| Mortgage loan receivables held for sale | 95,350 | | | 90,420 | | | 90,420 | | | Internal model, third-party inputs(6) | | 6.20 | % | | 9.04 |
| | | | | | | | | | | |
| Nonhedge derivatives(1)(10) | 132,500 | | | 467 | | | 467 | | | Counterparty quotations | | N/A | | 0.32 |
| | | | | | | | | | | |
| Liabilities: | | | | | | | | | | | |
| Repurchase agreements - short-term | 62,738 | | | 62,738 | | | 62,738 | | | Cost plus Accrued Interest (7) | | 6.47 | % | | 0.49 |
| | | | | | | | | | | |
| | | | | | | | | | | |
| Mortgage loan financing | 423,009 | | | 425,690 | | | 418,776 | | | Discounted Cash Flow | | 6.13 | % | | 3.67 |
| | | | | | | | | | | |
| | | | | | | | | | | |
| CLO debt | 275,623 | | | 275,623 | | | 275,623 | | | Discounted Cash Flow(8) | | 6.30 | % | | 1.09 |
| | | | | | | | | | | |
| Senior unsecured notes | 2,021,108 | | | 2,005,703 | | | 1,991,038 | | | Internal model | | 5.23 | % | | 3.50 |
| | | | | | | | | | | |
| | | | | | | | | | | |
(1)Measured at fair value on a recurring basis with the net unrealized gains or losses recorded as a component of other comprehensive income (loss) in equity.
(2)Represents notional outstanding balance of underlying collateral.
(3)Measured at fair value on a recurring basis with the net unrealized gains or losses recorded in current period earnings.
(4)Balance does not include impact of allowance for current expected credit losses of $52.2 million at March 31, 2025.
(5)Fair value for floating rate mortgage loan receivables, held for investment is estimated to approximate the outstanding face amount given the short interest rate reset risk (30 days) and no significant change in credit spreads since origination. Fair value for fixed rate mortgage loan receivables, held for investment is measured using a discounted cash flow model.
(6)Fair value for mortgage loan receivables, held for sale is measured using a hypothetical securitization model utilizing market data from recent securitization spreads and pricing.
(7)For repurchase agreements - short term, the value approximates the cost plus accrued interest.
(8)For CLO debt, the carrying value approximates the fair value discounting the expected cash flows at current market rates. If the collateral is determined to be impaired, the related financing would be revalued accordingly. There are no impairments on any positions.
(9)The outstanding face amount of the nonhedge derivatives represents the notional amount of the underlying contracts.
December 31, 2024
| | | | | | | | | | | | | | | | | | | | | | | | | | | | | | | | | | | |
| | | | | | | | | | Weighted Average |
| Assets: | Principal Amount | | Amortized Cost Basis/Purchase Price | | Fair Value | | Fair Value Method | | Yield
% | | Remaining
Maturity/Duration (years) |
| CMBS(1) | $ | 1,065,985 | | | $ | 1,063,835 | | | $ | 1,058,873 | | | Internal model | | 6.13 | % | | 2.41 |
| CMBS interest-only(1) | 769,724 | | (2) | 3,149 | | | 3,244 | | | Internal model | | 7.81 | % | | 0.87 |
| GNMA interest-only(3) | 32,710 | | (2) | 160 | | | 155 | | | Internal model | | 9.38 | % | | 3.64 |
| Agency securities(1) | 11 | | | 11 | | | 11 | | | Internal model | | 2.60 | % | | 0.58 |
| | | | | | | | | | | |
| | | | | | | | | | | |
| | | | | | | | | | | |
| Equity securities(3) | N/A | | 19,511 | | | 18,575 | | | Observable market prices | | N/A | | N/A |
| | | | | | | | | | | |
| | | | | | | | | | | |
| | | | | | | | | | | |
| | | | | | | | | | | |
| | | | | | | | | | | |
| Mortgage loan receivables held for investment, net, at amortized cost(4) | 1,596,277 | | | 1,591,322 | | | 1,575,911 | | | Discounted Cash Flow(5) | | 9.36 | % | | 0.86 |
| | | | | | | | | | | |
| | | | | | | | | | | |
| Mortgage loan receivables held for sale | 31,350 | | | 26,898 | | | 26,898 | | | Internal model, third-party inputs(6) | | 4.57 | % | | 7.18 |
| | | | | | | | | | | |
| Nonhedge derivatives(1)(10) | 90,000 | | | 437 | | | 437 | | | Counterparty quotations | | N/A | | 0.62 |
| | | | | | | | | | | |
| Liabilities: | | | | | | | | | | | |
| Repurchase agreements - short-term | 62,738 | | | 62,738 | | | 62,738 | | | Cost plus Accrued Interest (7) | | 6.55 | % | | 0.74 |
| | | | | | | | | | | |
| | | | | | | | | | | |
| Mortgage loan financing | 443,733 | | | 446,397 | | | 435,048 | | | Discounted Cash Flow | | 6.09 | % | | 3.36 |
| | | | | | | | | | | |
| | | | | | | | | | | |
| CLO debt | 601,464 | | | 601,380 | | | 601,430 | | | Discounted Cash Flow(8) | | 2.01 | % | | 0.98 |
| | | | | | | | | | | |
| Senior unsecured notes | 2,041,557 | | | 2,025,053 | | | 2,001,207 | | | Internal model | | 5.22 | % | | 3.72 |
| | | | | | | | | | | |
| | | | | | | | | | | |
(1)Measured at fair value on a recurring basis with the net unrealized gains or losses recorded as a component of other comprehensive income (loss) in equity.
(2)Represents notional outstanding balance of underlying collateral.
(3)Measured at fair value on a recurring basis with the net unrealized gains or losses recorded in current period earnings.
(4)Balance does not include impact of allowance for current expected credit losses of $52.3 million at December 31, 2024.
(5)Fair value for floating rate mortgage loan receivables, held for investment is estimated to approximate the outstanding face amount given the short interest rate reset risk (30 days) and no significant change in credit spreads since origination. Fair value for fixed rate mortgage loan receivables, held for investment is measured using a discounted cash flow model.
(6)Fair value for mortgage loan receivables, held for sale is measured using a hypothetical securitization model utilizing market data from recent securitization spreads and pricing.
(7)For repurchase agreements - short term, the value approximates the cost plus accrued interest.
(8)For CLO debt, the carrying value approximates the fair value discounting the expected cash flows at current market rates. If the collateral is determined to be impaired, the related financing would be revalued accordingly. There are no impairments on any positions.
(9)The outstanding face amount of the nonhedge derivatives represents the notional amount of the underlying contracts.
The following table summarizes the Company’s financial assets and liabilities, which are both reported at fair value on a recurring basis (as indicated) or amortized cost/par, at March 31, 2025 and December 31, 2024 ($ in thousands):
March 31, 2025
| | | | | | | | | | | | | | | | | | | | | | | | | | | | | | | | |
| Financial Instruments Reported at Fair Value on Consolidated Statements of Financial Condition | | Principal
Amount | | Fair Value |
| | Level 1 | | Level 2 | | Level 3 | | Total |
| | | | | | | | | | |
| Assets: | | | | | | | | | | |
| CMBS(1) | | $ | 1,471,522 | | | $ | — | | | $ | 1,462,388 | | | $ | — | | | $ | 1,462,388 | |
| CMBS interest-only(1) | | 428,077 | | (2) | — | | | 2,529 | | | — | | | 2,529 | |
| GNMA interest-only(3) | | 32,359 | | (2) | — | | | 155 | | | — | | | 155 | |
| Agency securities(1) | | 9 | | | — | | | 9 | | | — | | | 9 | |
| | | | | | | | | | |
| | | | | | | | | | |
| | | | | | | | | | |
| Equity securities | | N/A | | 2,266 | | | — | | | — | | | 2,266 | |
| Nonhedge derivatives(4) | | 132,500 | | | 467 | | | — | | | — | | | 467 | |
| | | | $ | 2,733 | | | $ | 1,465,081 | | | $ | — | | | $ | 1,467,814 | |
| | | | | | | | | | |
| | | | | | | | | | |
| | | | | | | | | | |
| | | | | | | | | | |
| | | | | | | | | | |
| | | | | | | | | | |
| Financial Instruments Not Reported at Fair Value on Consolidated Statements of Financial Condition | | Principal
Amount | | Fair Value |
| | Level 1 | | Level 2 | | Level 3 | | Total |
| | | | | | | | | | |
| Assets: | | | | | | | | | | |
| | | | | | | | | | |
| Mortgage loan receivables held for investment, net, at amortized cost(5) | | $ | 1,671,069 | | | $ | — | | | $ | — | | | $ | 1,646,270 | | | $ | 1,646,270 | |
| | | | | | | | | | |
| | | | | | | | | | |
| Mortgage loan receivable held for sale(6) | | 95,350 | | | — | | | — | | | 90,420 | | | 90,420 | |
| CMBS(7) | | 9,104 | | | — | | | 8,869 | | | — | | | 8,869 | |
| CMBS interest-only(7) | | 8,150 | | | — | | | 184 | | | — | | | 184 | |
| | | | | | | | | | |
| | | | | | | | | | |
| | | | | | | | | | |
| | | | $ | — | | | $ | 9,053 | | | $ | 1,736,690 | | | $ | 1,745,743 | |
| Liabilities: | | | | | | | | | | |
| Repurchase agreements - short-term | | $ | 62,738 | | | $ | — | | | $ | 62,738 | | | $ | — | | | $ | 62,738 | |
| | | | | | | | | | |
| | | | | | | | | | |
| Mortgage loan financing | | 423,009 | | | — | | | — | | | 418,776 | | | 418,776 | |
| | | | | | | | | | |
| | | | | | | | | | |
| CLO debt | | 275,623 | | | — | | | 275,623 | | | — | | | 275,623 | |
| | | | | | | | | | |
| | | | | | | | | | |
| Senior unsecured notes | | 2,021,108 | | | — | | | 1,991,038 | | | — | | | 1,991,038 | |
| | | | | | | | | | |
| | | | | | | | | | |
| | | | $ | — | | | $ | 2,329,399 | | | $ | 418,776 | | | $ | 2,748,175 | |
(1)Measured at fair value on a recurring basis with the net unrealized gains or losses recorded as a component of other comprehensive income (loss) in equity.
(2)Represents notional outstanding balance of underlying collateral.
(3)Measured at fair value on a recurring basis with the net unrealized gains or losses recorded in current period earnings.
(4)Measured at fair value on a recurring basis with the net unrealized gains or losses recorded in current period earnings. The outstanding face amount of the nonhedge derivatives represents the notional amount of the underlying contracts.
(5)Balance does not include impact of allowance for current expected credit losses of $52.2 million at March 31, 2025.
(6)A lower of cost or market adjustment was recorded as of March 31, 2025.
(7)Restricted securities which are designated as risk retention securities under the Dodd-Frank Act and are therefore subject to transfer restrictions over the term of the securitization trust, are classified as held-to-maturity and reported at amortized cost.
(8)As of December 31, 2024, the Company determined that $2.0 billion of senior unsecured notes were level 2 based on the Company’s increased observability of the inputs used to internally value the senior unsecured notes.
December 31, 2024
| | | | | | | | | | | | | | | | | | | | | | | | | | | | | | | | |
| Financial Instruments Reported at Fair Value on Consolidated Statements of Financial Condition | | Principal
Amount | | Fair Value |
| | Level 1 | | Level 2 | | Level 3 | | Total |
| | | | | | | | | | |
| Assets: | | | | | | | | | | |
| CMBS(1) | | $ | 1,056,844 | | | $ | — | | | $ | 1,049,986 | | | $ | — | | | $ | 1,049,986 | |
| CMBS interest-only(1) | | 761,537 | | (2) | — | | | 3,037 | | | — | | | 3,037 | |
| GNMA interest-only(3) | | 32,710 | | (2) | — | | | 155 | | | — | | | 155 | |
| Agency securities(1) | | 11 | | | — | | | 11 | | | — | | | 11 | |
| | | | | | | | | | |
| | | | | | | | | | |
| | | | | | | | | | |
| Equity securities | | N/A | | 18,575 | | | — | | | — | | | 18,575 | |
| Nonhedge derivatives(4) | | 90,000 | | | — | | | 437 | | | — | | | 437 | |
| | | | $ | 18,575 | | | $ | 1,053,626 | | | $ | — | | | $ | 1,072,201 | |
| | | | | | | | | | |
| | | | | | | | | | |
| | | | | | | | | | |
| | | | | | | | | | |
| | | | | | | | | | |
| | | | | | | | | | |
| Financial Instruments Not Reported at Fair Value on Consolidated Statements of Financial Condition | | Principal
Amount | | Fair Value |
| | Level 1 | | Level 2 | | Level 3 | | Total |
| | | | | | | | | | |
| Assets: | | | | | | | | | | |
| | | | | | | | | | |
| Mortgage loan receivables held for investment, net, at amortized cost(5) | | $ | 1,596,277 | | | $ | — | | | $ | — | | | $ | 1,575,911 | | | $ | 1,575,911 | |
| | | | | | | | | | |
| | | | | | | | | | |
| Mortgage loan receivable held for sale(6) | | 31,350 | | | — | | | — | | | 26,898 | | | 26,898 | |
| CMBS(7) | | 9,142 | | | — | | | 8,887 | | | — | | | 8,887 | |
| CMBS interest-only(7) | | 8,187 | | | — | | | 207 | | | — | | | 207 | |
| | | | | | | | | | |
| | | | | | | | | | |
| | | | | | | | | | |
| | | | $ | — | | | $ | 9,094 | | | $ | 1,602,809 | | | $ | 1,611,903 | |
| Liabilities: | | | | | | | | | | |
| Repurchase agreements - short-term | | $ | 62,738 | | | $ | — | | | $ | 62,738 | | | $ | — | | | $ | 62,738 | |
| | | | | | | | | | |
| | | | | | | | | | |
| Mortgage loan financing | | 443,733 | | | — | | | — | | | 435,048 | | | 435,048 | |
| | | | | | | | | | |
| | | | | | | | | | |
| CLO debt | | 601,464 | | | — | | | 601,430 | | | — | | | 601,430 | |
| | | | | | | | | | |
| | | | | | | | | | |
| Senior unsecured notes | | 2,041,557 | | | — | | | 2,001,207 | | | — | | | 2,001,207 | |
| | | | | | | | | | |
| | | | | | | | | | |
| | | | $ | — | | | $ | 2,665,375 | | | $ | 435,048 | | | $ | 3,100,423 | |
(1)Measured at fair value on a recurring basis with the net unrealized gains or losses recorded as a component of other comprehensive income (loss) in equity.
(2)Represents notional outstanding balance of underlying collateral.
(3)Measured at fair value on a recurring basis with the net unrealized gains or losses recorded in current period earnings.
(4)Measured at fair value on a recurring basis with the net unrealized gains or losses recorded in current period earnings. The outstanding face amount of the nonhedge derivatives represents the notional amount of the underlying contracts.
(5)Balance does not include impact of allowance for current expected credit losses of $52.3 million at December 31, 2024.
(6)A lower of cost or market adjustment was recorded as of December 31, 2024.
(7)Restricted securities which are designated as risk retention securities under the Dodd-Frank Act and are therefore subject to transfer restrictions over the term of the securitization trust, are classified as held-to-maturity and reported at amortized cost.
(8)As of December 31, 2024, the Company determined that $2.0 billion of senior unsecured notes were level 2 based on the Company’s increased observability of the inputs used to internally value the senior unsecured notes.
The Company did not have any Level 3 financial instruments as of March 31, 2025 and December 31, 2024.
Nonrecurring Fair Values
The Company measures fair value of certain assets on a nonrecurring basis when events or changes in circumstances indicate that the carrying value of the assets may be impaired. Adjustments to fair value generally result from the application of lower of amortized cost or fair value accounting for assets held for sale or write-down of assets value due to impairment. Refer to Note 3, Mortgage Loan Receivables and Note 5, Real Estate and Related Lease Intangibles, Net, for disclosure of Level 3 inputs for certain assets measured on a nonrecurring basis.
15. INCOME TAXES
The Company elected to be taxed as a REIT under the Internal Revenue Code (“the Code”), commencing with the taxable year ended December 31, 2015 (the REIT Election”). As such, the Company’s income is generally not subject to U.S. federal, state and local corporate income taxes other than as described below.
Certain of the Company’s subsidiaries have elected to be treated as TRSs. TRSs permit the Company to participate in certain activities from which REITs are generally precluded, as long as these activities meet specific criteria, are conducted within the parameters of certain limitations established by the Code, and are conducted in entities which elect to be treated as taxable subsidiaries under the Code. To the extent these criteria are met, the Company will continue to maintain its qualification as a REIT. The Company’s TRSs are not consolidated for U.S. federal income tax purposes, but are instead taxed as corporations. For financial reporting purposes, a provision for current and deferred taxes is established for the portion of earnings recognized by the Company with respect to its interest in TRSs. Current income tax expense (benefit) was $(0.3) million and $0.6 million for the three months ended March 31, 2025 and March 31, 2024, respectively.
As of March 31, 2025 and December 31, 2024, the Company’s net deferred tax assets (liabilities) were $(4.2) million and $(4.6) million, respectively, and are included in other assets (liabilities) in the Company’s consolidated balance sheets. Deferred income tax expense (benefit) included within the provision for income taxes was $(0.5) million and $1.3 million for the three months ended March 31, 2025 and March 31, 2024, respectively. The Company’s net deferred tax liability is comprised of deferred tax assets and deferred tax liabilities. The Company believes it is more likely than not that the deferred tax assets (aside from the exception noted below) will be realized in the future. Realization of the deferred tax assets is dependent upon the Company’s generation of sufficient taxable income in future years in appropriate tax jurisdictions to obtain benefit from the reversal of temporary differences. The amount of deferred tax assets considered realizable is subject to adjustment in future periods if estimates of future taxable income change.
As of March 31, 2025, the Company had $0.1 million of deferred tax assets relating to capital losses which it may only use to offset capital gains. These tax attributes will begin to expire if unused by December 31, 2025. As the realization of these assets are not more likely than not to be realized before their expiration, the Company provided a full valuation allowance against this deferred tax asset.
The Company’s tax returns are subject to audit by taxing authorities. Generally, as of March 31, 2025, the tax years 2021-2024 remain open to examination by the major taxing jurisdictions in which the Company is subject to taxes. One of the Company’s subsidiary entities is currently under audit in New York City for tax years 2014-2020. The Company does not expect this audit to result in any material changes to the Company’s financial position or performance. The Company does not expect tax expense to have an impact on either short, or long-term liquidity or capital needs.
Under U.S. GAAP, a tax benefit related to an income tax position may be recognized when it is more likely than not that the position will be sustained upon examination by the tax authorities based on the technical merits of the position. As of March 31, 2025 and December 31, 2024, the Company did not have any unrecognized tax benefits. As of March 31, 2025, the Company has not recognized interest or penalties related to uncertain tax positions. In addition, the Company does not believe that it has any tax positions for which it is reasonably possible that it will be required to record a significant liability for unrecognized tax benefits within the next twelve months.
16. RELATED PARTY TRANSACTIONS
The Company has no material related party relationships to disclose.
17. COMMITMENTS AND CONTINGENCIES
Leases
As of March 31, 2025, the Company had a $(17.0) million lease liability and a $15.6 million right-of-use asset on its consolidated balance sheets recorded within other liabilities and other assets, respectively. The right-of-use lease asset relates to the Company's operating leases of office space. Right-of use lease assets initially equal the lease liability. During the three months ended March 31, 2025 and 2024, the Company recognized $0.9 million and $0.5 million in operating expenses in its consolidated statements of income relating to operating leases, respectively.
Future minimum lease payments under non-cancelable operating leases as of March 31, 2025 are as follows ($ in thousands):
| | | | | | | | |
| Period ending December 31, | | Minimum Lease Payments |
| 2025 (last nine months) | | $ | 3,243 | |
| 2026 | | 2,869 | |
| 2027 | | 2,232 | |
| 2028 | | 2,306 | |
| 2029 | | 2,409 | |
| Thereafter | | 8,629 | |
| Total undiscounted cash flows | | 21,688 | |
| Present value discount (1) | | (4,711) | |
| Lease liabilities (2) | | $ | 16,977 | |
(1)Lease liabilities were discounted at the Company's weighted average incremental borrowing rate, estimated at the time of lease commencement, for similar collateral, which was 6.71%. The average remaining lease term is 7.6 years.
(2)The Company has a five-year extension option on its corporate headquarters office at 320 Park Avenue, New York, New York, which is not reflected in the total lease liability.
Unfunded Loan Commitments
As of March 31, 2025, the Company’s off-balance sheet arrangements consisted of $39.8 million of unfunded commitments on mortgage loan receivables held for investment to provide additional first mortgage loan financing over the next three years at rates to be determined at the time of funding. 81% of these unfunded commitments require the occurrence of certain “good news” events, such as the owner concluding a lease agreement with a major tenant in the building or reaching some pre-determined net operating income. As of December 31, 2024, the Company’s off-balance sheet arrangements consisted of $34.6 million of unfunded commitments on mortgage loan receivables held for investment to provide additional first mortgage loan financing.
Commitments are subject to the Company’s loan borrowers’ satisfaction of certain financial and nonfinancial covenants and may or may not be funded depending on a variety of circumstances including timing, credit metric hurdles, and other nonfinancial events occurring. The Company carefully monitors the progress of work at properties that serve as collateral underlying its commercial mortgage loans, including the progress of capital expenditures, construction, leasing and business plans in light of current market conditions. These commitments are not reflected on the consolidated balance sheets.
Unsettled Trades
As of March 31, 2025, the Company had $39.8 million of U.S. Treasury securities traded and not yet settled on its consolidated balance sheets. As of December 31, 2024, the Company had $10.0 million of U.S. Treasury securities traded and not yet settled on its consolidated balance sheet. The U.S. Treasury securities are recorded within other assets, and the related payable is recorded within other liabilities. These balances relate to the Company’s purchase of U.S. Treasury securities with maturities of less than three months, which will be recorded within cash and cash equivalents upon settlement. The payable within other liabilities at December 31, 2024 was paid during the three months ended March 31, 2025 and the payable within other liabilities at March 31, 2025 was paid during the second quarter of 2025.
18. SEGMENT REPORTING
The Company has determined that it has three reportable segments based on how the chief operating decision maker (“CODM”), the Chief Executive Officer, reviews and manages the business. The CODM uses net income (loss) to measure segment operating performance. All of the Company’s expenses are reviewed regularly and are included in segment operating performance. These reportable segments include loans, securities, and real estate. The loans segment includes all of the Company’s activities related to mortgage loan receivables held for investment (balance sheet loans) and mortgage loan receivables held for sale (conduit loans). The securities segment includes of all of the Company’s activities related to securities, which include investments in CMBS, U.S. Agency securities, corporate bonds, equity securities and U.S. Treasury securities not classified as cash and cash equivalents. The real estate segment includes all of the Company’s activities related to net leased properties, other diversified real estate and investments in unconsolidated ventures. Corporate/other includes cash and cash equivalents, senior unsecured notes, compensation and employee benefits, operating expenses, and unallocated items including any inter-segment eliminations necessary to reconcile to consolidated Company totals.
The Company evaluates performance based on the following financial measures for each segment ($ in thousands):
| | | | | | | | | | | | | | | | | | | | | | | | | | | | | |
| Three months ended March 31, 2025 | Loans | | Securities | | Real Estate (1) | | Corporate/Other(2) | | Company
Total |
| Net interest income | | | | | | | | | |
| Interest income | $ | 34,750 | | | $ | 18,528 | | | $ | 105 | | | $ | 10,943 | | | $ | 64,326 | |
| Interest expense | (8,413) | | | — | | | (6,688) | | | (28,896) | | | (43,997) | |
| Net interest income (expense) | 26,337 | | | 18,528 | | | (6,583) | | | (17,953) | | | 20,329 | |
| (Provision for) release of loan loss reserves | 81 | | | — | | | — | | | — | | | 81 | |
| Net interest income (expense) after provision for (release of) loan reserves | 26,418 | | | 18,528 | | | (6,583) | | | (17,953) | | | 20,410 | |
| Other income (loss) | | | | | | | | | |
| Real estate operating income | — | | | — | | | 21,773 | | | — | | | 21,773 | |
| | | | | | | | | |
| | | | | | | | | |
| Net result from mortgage loan receivables held for sale | 162 | | | — | | | — | | | — | | | 162 | |
| | | | | | | | | |
| | | | | | | | | |
| Gain (loss) on real estate, net | — | | | — | | | 3,807 | | | — | | | 3,807 | |
| | | | | | | | | |
| Fee and other income | 3,493 | | | 1,792 | | | — | | | — | | | 5,285 | |
| Net result from derivative transactions | — | | | — | | | 35 | | | 288 | | | 323 | |
| Earnings (loss) from investment in unconsolidated ventures | — | | | — | | | (732) | | | — | | | (732) | |
| | | | | | | | | |
| Gain (loss) on extinguishment of debt | — | | | — | | | — | | | 256 | | | 256 | |
| Total other income (loss) | 3,655 | | | 1,792 | | | 24,883 | | | 544 | | | 30,874 | |
| Costs and expenses | | | | | | | | | |
| Compensation and employee benefits | — | | | — | | | — | | | (18,761) | | | (18,761) | |
| Operating expenses | — | | | — | | | | | (4,516) | | | (4,516) | |
| Real estate operating expenses | — | | | — | | | (8,766) | | | — | | | (8,766) | |
| | | | | | | | | |
| Investment related expenses | (790) | | | (65) | | | (101) | | | (232) | | | (1,188) | |
| Depreciation and amortization | — | | | — | | | (7,228) | | | (108) | | | (7,336) | |
| Total costs and expenses | (790) | | | (65) | | | (16,095) | | | (23,617) | | | (40,567) | |
| Income (loss) before taxes | 29,283 | | | 20,255 | | | 2,205 | | | (41,026) | | | 10,717 | |
| Income tax (expense) benefit | — | | | — | | | — | | | 838 | | | 838 | |
| Segment net income (loss) | $ | 29,283 | | | $ | 20,255 | | | $ | 2,205 | | | $ | (40,188) | | | $ | 11,555 | |
| | | | | | | | | |
| Total assets as of March 31, 2025 | $ | 1,703,455 | | | $ | 1,476,380 | | | $ | 673,901 | | | $ | 616,263 | | | $ | 4,469,999 | |
| | | | | | | | | | | | | | | | | | | | | | | | | | | | | |
| Three months ended March 31, 2024 | Loans | | Securities | | Real Estate (1) | | Corporate/Other(2) | | Company
Total |
| Net interest income | | | | | | | | | |
| Interest income | $ | 73,624 | | | $ | 7,892 | | | $ | 109 | | | $ | 14,287 | | | $ | 95,912 | |
| Interest expense | (29,450) | | | (28) | | | (8,350) | | | (20,943) | | | (58,771) | |
| Net interest income (expense) | 44,174 | | | 7,864 | | | (8,241) | | | (6,656) | | | 37,141 | |
| (Provision for) release of loan loss reserves | (5,768) | | | — | | | — | | | — | | | (5,768) | |
| Net interest income (expense) after provision for (release of) loan reserves | 38,406 | | | 7,864 | | | (8,241) | | | (6,656) | | | 31,373 | |
| Other income (loss) | | | | | | | | | |
| Real estate operating income | — | | | — | | | 23,887 | | | — | | | 23,887 | |
| Net result from mortgage loan receivables held for sale (3) | 943 | | | — | | | — | | | (856) | | | 87 | |
| | | | | | | | | |
| Fee and other income | 3,505 | | | 76 | | | 2 | | | 117 | | | 3,700 | |
| Net result from derivative transactions | 640 | | | 71 | | | 170 | | | 3,138 | | | 4,019 | |
| Earnings (loss) from investment in unconsolidated ventures | — | | | — | | | (15) | | | — | | | (15) | |
| Gain (loss) on extinguishment of debt | — | | | — | | | — | | | 177 | | | 177 | |
| Total other income (loss) | 5,088 | | | 147 | | | 24,044 | | | 2,576 | | | 31,855 | |
| Costs and expenses | | | | | | | | | |
| Compensation and employee benefits | — | | | — | | | — | | | (20,789) | | | (20,789) | |
| Operating expenses | — | | | — | | | — | | | (4,643) | | | (4,643) | |
| Real estate operating expenses | — | | | — | | | (9,146) | | | — | | | (9,146) | |
| Investment related expenses | (1,589) | | | (47) | | | (93) | | | (264) | | | (1,993) | |
| Depreciation and amortization | — | | | — | | | (8,192) | | | (110) | | | (8,302) | |
| Total costs and expenses | (1,589) | | | (47) | | | (17,431) | | | (25,806) | | | (44,873) | |
| Income (loss) before taxes | 41,905 | | | 7,964 | | | (1,628) | | | (29,886) | | | 18,355 | |
| Income tax (expense) benefit | — | | | — | | | — | | | (1,925) | | | (1,925) | |
| Segment net income (loss) | $ | 41,905 | | | $ | 7,964 | | | $ | (1,628) | | | $ | (31,811) | | | $ | 16,430 | |
| | | | | | | | | |
| Total assets as of December 31, 2024 | $ | 1,565,897 | | | $ | 1,080,839 | | | $ | 690,726 | | | $ | 1,507,611 | | | $ | 4,845,073 | |
(1)Includes the Company’s investment in unconsolidated ventures that held real estate of $19.2 million and $19.9 million as of March 31, 2025 and December 31, 2024, respectively. This segment also includes the Company’s capital improvements of real estate of $0.9 million as of March 31, 2025 and 2024.
(2)Corporate/Other represents all corporate level and unallocated items including any inter-segment eliminations necessary to reconcile to consolidated Company totals. Corporate/Other includes the Company’s senior unsecured notes of $2.0 billion as of March 31, 2025 and December 2024. Corporate/Other also includes the Company’s stock-based compensation expense of $11.2 million and $10.3 million, within compensation and employee benefits as of March 31, 2025 and 2024, respectively.
(3)Includes $0.9 million of realized gains from sales of conduit mortgage loans collateralized by net leased properties in the Company’s real estate segment that eliminate in consolidation for the three months ended March 31, 2024.
19. SUBSEQUENT EVENTS
The Company has evaluated subsequent events through the issuance date of the financial statements and determined that no additional disclosure is necessary.
Item 2. Management’s Discussion and Analysis of Financial Condition and Results of Operations
The following discussion and analysis of financial condition and results of operations should be read in conjunction with the consolidated financial statements and the related notes of Ladder Capital Corp included within this Quarterly Report and the Annual Report. This Management’s Discussion and Analysis of Financial Condition and Results of Operations contains forward-looking statements. See “Cautionary Statement Regarding Forward-Looking Statements” within this Quarterly Report and “Risk Factors” within the Annual Report for a discussion of the uncertainties, risks and assumptions associated with these statements. Actual results may differ materially from those contained in any forward-looking statements as a result of various factors, including but not limited to, those in “Risk Factors” set forth within the Annual Report.
References to “Ladder,” the “Company,” and “we,” “our” and “us” refer to Ladder Capital Corp, a Delaware corporation incorporated in 2013, and its consolidated subsidiaries.
Overview
Ladder Capital is an internally-managed real estate investment trust (“REIT”) that is a leader in commercial real estate finance. We originate and invest in a diverse portfolio of commercial real estate and real estate-related assets, focusing on senior secured assets. Our investment activities include: (i) our primary business of originating senior first mortgage fixed and floating rate loans collateralized by commercial real estate with flexible loan structures; (ii) owning and operating commercial real estate, including net leased commercial properties; and (iii) investing in investment grade securities secured by first mortgage loans on commercial real estate. We believe that our in-house origination platform, ability to flexibly allocate capital among complementary product lines, credit-centric underwriting approach, access to diversified financing sources, and experienced management team position us well to deliver attractive returns on equity to our shareholders through economic and credit cycles.
Our businesses, including balance sheet lending, conduit lending, securities investments, and real estate investments, provide for a stable base of net interest and rental income. We have originated $30.3 billion of commercial real estate loans from our inception in October 2008 through March 31, 2025. During this timeframe, we also acquired $14.6 billion of predominantly investment grade-rated securities secured by first mortgage loans on commercial real estate and $2.1 billion of selected net leased and other real estate assets.
As part of our commercial mortgage lending operations, we originate conduit loans, which are first mortgage loans on stabilized, income producing commercial real estate properties that we intend to make available for sale in commercial mortgage-backed securities (“CMBS”) securitizations. From our inception in October 2008 through March 31, 2025, we originated $17.0 billion of conduit loans, of which $16.9 billion were sold into 74 CMBS securitizations, making us, by volume, one of the largest non-bank contributors of loans to CMBS securitizations in the United States in such period. Our sales of loans into securitizations are generally accounted for as true sales, not financings, and we generally retain no ongoing interest in loans which we securitize unless we are required to do so as issuer pursuant to the risk retention requirements of the Dodd-Frank Wall Street Reform and Consumer Protection Act of 2010, as amended, (the “Dodd-Frank Act”). The securitization of conduit loans enables us to reinvest our equity capital into new loan originations or allocate it to other investments.
We maintain a diversified and flexible financing strategy supporting our investment strategy and overall business operations, including the use of senior unsecured notes, non-recourse, non-mark-to-market Collateralized Loan Obligations (“CLO”) debt issuances and committed term financing from leading financial institutions. Refer to “Our Financing Strategies” and “Liquidity and Capital Resources” for further information.
Ladder was founded in October 2008 and we completed our initial public offering in February 2014. We are led by a disciplined and highly aligned management team. As of March 31, 2025, our management team and directors held interests in our Company comprising over 11% of our total equity. On average, our management team members have 29 years of experience in the industry. Our management team includes Brian Harris, Chief Executive Officer; Pamela McCormack, President; Paul J. Miceli, Chief Financial Officer; Robert Perelman, Head of Asset Management; and Kelly Porcella, Chief Administrative Officer & General Counsel. Anthony V. Esposito, Chief Accounting Officer, and Stephanie Lin, Assistant Secretary, are additional officers of Ladder.
Our Businesses
We invest primarily in loans, securities and other interests in U.S. commercial real estate, with a focus on senior secured assets. Our complementary business segments are designed to provide us with the flexibility to opportunistically allocate capital in order to generate attractive risk-adjusted returns under varying market conditions. The following chart summarizes our investment portfolio as of March 31, 2025 ($ in thousands):
(1)CRE equity asset amounts represent undepreciated asset values.
There are a number of factors that influence our operating results. Some of these factors include: (1) our competition; (2) market and economic conditions, including inflation; (3) loan origination and repayment volume; (4) profitability of securitizations; (5) avoidance of credit losses; (6) availability of debt and equity funding and the costs of that funding; (7) the net interest margin on our investments; (8) effectiveness of our hedging and other risk management practices; (9) real estate transaction volumes; (10) occupancy rates; and (11) expense management. Refer to the heading “Results of Operations.”
Loans
Balance Sheet First Mortgage Loans. We originate and invest in balance sheet first mortgage loans secured by commercial real estate properties that are typically undergoing transition, including lease-up, sell-out, and renovation or repositioning. These mortgage loans are structured to fit the needs and business plans of the property owners, and generally have Term SOFR-based floating rates and terms (including extension options) ranging from one to five years. Our loans are directly originated by an internal team that has longstanding and strong relationships with borrowers and mortgage brokers throughout the United States. We follow a rigorous investment process, which begins with an initial due diligence review; continues through a comprehensive legal and underwriting process incorporating multiple internal and external checks and balances; and culminates in approval or disapproval of each prospective investment by our Investment Committee. Balance sheet first mortgage loans in excess of $50.0 million also require the approval of our board of directors’ Risk and Underwriting Committee.
We generally seek to hold our balance sheet first mortgage loans for investment although we also maintain the flexibility to contribute such loans into a CLO or similar structure, sell participation interests or “b-notes” in our mortgage loans or sell such mortgage loans as whole loans. Our balance sheet first mortgage loans may be refinanced by us into a new conduit first mortgage loan upon property stabilization. As of March 31, 2025, we held a portfolio of 54 balance sheet first mortgage loans with an aggregate book value of $1.7 billion. Based on the loan balances and the “as-is” third-party Financial Institutions
Reform, Recovery and Enforcement Act of 1989 (“FIRREA”) appraised values at origination, the weighted average loan-to-value ratio of this portfolio was 67.5% at March 31, 2025.
Other Commercial Real Estate-Related Loans. We selectively invest in note purchase financings, subordinated debt, mezzanine debt and other structured finance products related to commercial real estate that are generally held for investment. As of March 31, 2025, we held a portfolio of 4 mezzanine loans with an aggregate book value of $11.6 million. Based on the loan balance and the “as-is” third-party FIRREA appraised values at origination, the weighted average loan-to-value ratio of the portfolio was 72.3% at March 31, 2025.
Conduit First Mortgage Loans. We also originate conduit loans, which are first mortgage loans that are secured by cash-flowing commercial real estate and are available for sale to securitizations. These first mortgage loans are typically structured with fixed interest rates and generally have five- to ten-year terms. Conduit first mortgage loans are originated, underwritten, approved and funded using the same comprehensive legal and underwriting approach, process and personnel used to originate our balance sheet first mortgage loans. Conduit first mortgage loans in excess of $50.0 million also require approval of our board of directors’ Risk and Underwriting Committee. We held two conduit loans with an aggregate carrying value of $90.4 million at March 31, 2025.
Although our primary intent is to sell our conduit first mortgage loans to CMBS trusts, we generally seek to maintain the flexibility to keep them on our balance sheet, sell participation interests or “B-notes” in such loans or sell the loans as whole loans. The Company holds these conduit loans in its taxable REIT subsidiary (“TRS”) upon origination. As of March 31, 2025, we held two conduit first mortgage loans that were available for contribution into securitizations. Based on the loan balance and the “as-is” third-party FIRREA appraised values at origination, loan-to-value ratio of these loans was 48.4% at March 31, 2025.
The following charts set forth our total outstanding balance sheet first mortgage loans, other commercial real estate-related loans, and conduit first mortgage loans as of March 31, 2025, and a breakdown of our loan portfolio by loan size and geographic location and asset type of the underlying real estate by loan balance.
Real Estate
Net Leased Commercial Real Estate Properties. As of March 31, 2025, we owned 149 single tenant net leased properties with an undepreciated book value of $591.5 million. These properties are fully leased on a net basis where the tenant is generally responsible for payment of real estate taxes, property, building and general liability insurance and property and building maintenance expenses. As of March 31, 2025, our net leased properties comprised a total of 3.4 million square feet, 100% leased with an average age since construction of 20.1 years and a weighted average remaining lease term of 7.5 years. Commercial real estate investments in excess of $20.0 million require the approval of our board of directors’ Risk and Underwriting Committee. The majority of the tenants in our net leased properties are necessity-based businesses. During the three months ended March 31, 2025, we collected 100% of rent on these properties.
Diversified Commercial Real Estate Properties. As of March 31, 2025, we owned 53 diversified commercial real estate properties throughout the U.S with an undepreciated book value of $300.9 million. During the three months ended March 31, 2025, we collected 99% of rent on these properties.
The following charts summarize the composition of our real estate investments as of March 31, 2025 ($ in millions):
Securities
We invest in primarily AAA-rated real estate securities, typically front pay securities, with relatively short duration and significant subordination. We invest primarily in CMBS, including CRE CLOs, secured by first mortgage loans on commercial real estate. These investments provide a stable and attractive base of net interest income and help us manage our liquidity and hyper-amortization features included in many of these securities positions help mitigate potential credit losses in the event of adverse market conditions. We have significant in-house expertise in the evaluation and trading of these securities, due in part to our experience in originating and underwriting mortgage loans that comprise assets within CMBS trusts, as well as our experience in structuring CMBS transactions. In the future, we may invest in CMBS securities or other securities that are unrated.
As of March 31, 2025, the estimated fair value of our portfolio of CMBS investments totaled $1.5 billion in 105 CUSIPs ($14.0 million average investment per CUSIP). Included in the $1.5 billion of CMBS securities are $9.1 million of CMBS securities designated as risk retention securities under the Dodd-Frank Act, which are subject to transfer restrictions over the term of the securitization trust. The following chart summarizes our securities investments by market value, 99.3% of which were rated investment grade by Standard & Poor’s Ratings Group, Moody’s Investors Service, Inc. or Fitch Ratings Inc. as of March 31, 2025:
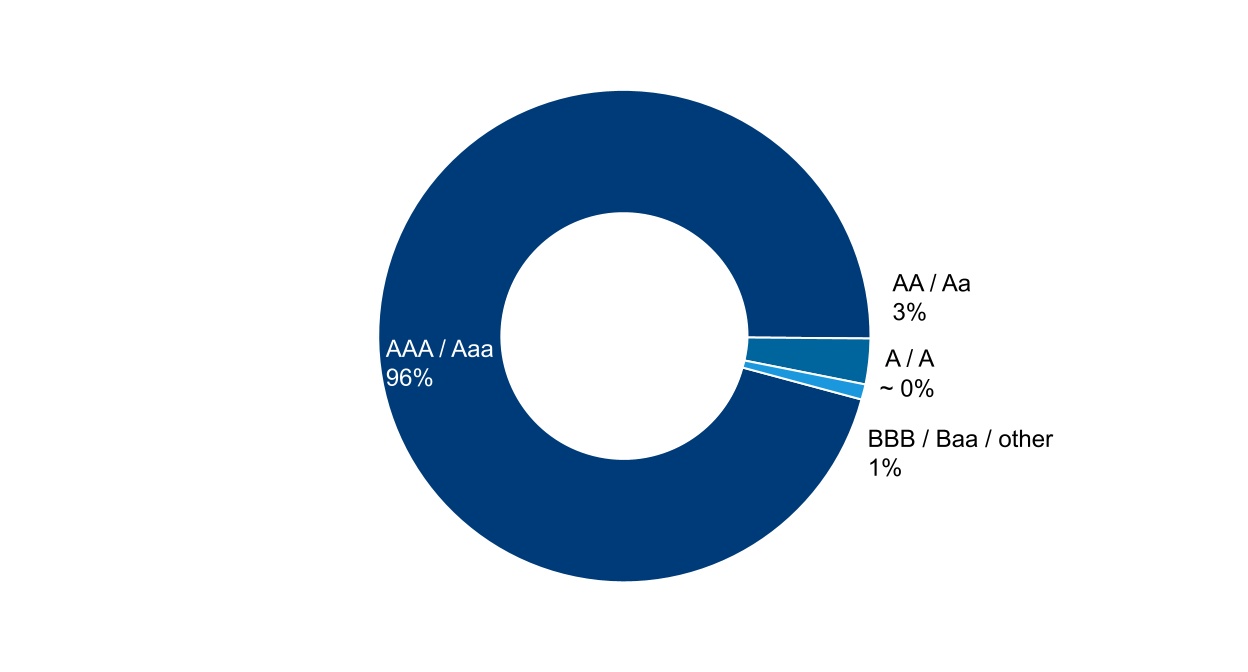
As of March 31, 2025, our CMBS investments had a weighted average duration of 2.9 years. The commercial real estate collateral underlying our CMBS investment portfolio is located throughout the United States. As of March 31, 2025, by property count and market value, respectively, 59.0% and 66.1% of the collateral underlying our CMBS investment portfolio was distributed throughout the top 25 metropolitan statistical areas (“MSAs”) in the United States, with 5.1% and 11.4%, by property count and market value, respectively, of the collateral located in the New York-Newark-Jersey City MSA, and the concentrations in each of the remaining top 24 MSAs ranging from 0.4% to 5.8% by property count and 0.3% to 8.4% by market value.
AAA-rated CMBS or U.S. Agency securities investments in excess of $106.0 million and all other investment grade CMBS or U.S. Agency securities investments in excess of $51.0 million, each in any single class of any single issuance, require the approval of our board of directors’ Risk and Underwriting Committee. The Risk and Underwriting Committee also must approve any investments in non-rated or sub-investment grade CMBS or U.S. Agency securities in any single class of any single issuance in excess of the lesser of (x) $21.0 million and (y) 10% of the total net asset value of the respective Ladder subsidiary or other entity for which Ladder has authority to make investment decisions.
Other Investments
Unconsolidated Ventures. From time to time we invest in real estate related ventures. As of March 31, 2025, the carrying value of our unconsolidated ventures was $19.2 million.
United States Treasury Securities. We invest in short-term and long-term U.S. Treasury securities. Short-term U.S. Treasury securities are classified as cash and cash equivalents on our consolidated balance sheet. As of March 31, 2025, we held $483.1 million of U.S. Treasury securities classified as cash and cash equivalents on our consolidated balance sheet.
Our Financing Strategies
Our financing strategies are critical to the success and growth of our business. We manage our financing to complement our asset composition and to diversify our exposure across multiple capital markets and counterparties. In addition to cash flow from operations, we fund our operations and investment strategy through a diverse array of funding sources, including:
•Senior unsecured notes
•Revolving credit facility
•CLO transactions
•Secured loan and securities repurchase financing
•Non-recourse mortgage debt
•Loan sales and securitizations
•Unencumbered assets available for financing
•Equity
From time to time, we may add financing counterparties that we believe will complement our business, although the agreements governing our indebtedness may limit our ability and the ability of our present and future subsidiaries to incur additional indebtedness. Our amended and restated charter and by-laws do not impose any threshold limits on our ability to use leverage. Refer to our discussion below and “Management’s Discussion and Analysis of Financial Condition and Results of Operations." under the heading “Liquidity and Capital Resources” and Note 6, Debt Obligations, Net, to our consolidated financial statements included elsewhere in this Quarterly Report, for additional information about our financing arrangements.
Senior Unsecured Notes
As of March 31, 2025, we had $2.0 billion of senior unsecured notes outstanding. These unsecured financings were comprised of $287.7 million in aggregate principal amount of 5.25% senior notes due 2025 (the “2025 Notes”), $599.5 million in aggregate principal amount of 4.25% senior notes due 2027 (the “2027 Notes”), $633.9 million in aggregate principal amount of 4.75% senior notes due 2029 (the “2029 Notes”) and $500.0 million in aggregate principal amount of 7.00% senior notes due 2031 (the “2031 Notes”, collectively with the 2025 Notes, the 2027 Notes and the 2029 Notes, the “Notes”). The Company and certain subsidiaries of LCFH currently guarantee the obligations under the Notes and the indenture.
Due in large part to devoting such a large portion of our capital structure to equity and unsecured corporate bond debt, we maintain a $3.7 billion pool of unencumbered assets, comprised primarily of first mortgage loans and unrestricted cash as of March 31, 2025.
Revolving Credit Facility
Our Revolving Credit Facility is available on a revolving basis to finance our working capital needs and for general corporate purposes. On January 2, 2025, we increased the aggregate maximum borrowing amount of the Revolving Credit Facility to $850.0 million, following the upsize to $725 million on December 20, 2024. The Revolving Credit Facility also allows us to enter into additional incremental revolving commitments up to an aggregate facility size of $1.3 billion subject to certain customary conditions. Borrowings under the Revolving Credit Facility bear interest at a rate equal to adjusted term SOFR plus a margin. The margin for borrowings is adjustable based on our credit rating and is between 77.5 basis points and 170 basis points. As of March 31, 2025, we had no outstanding borrowings on the Revolving Credit Facility.
The obligations under the Revolving Credit Facility are guaranteed by the Company and certain of its subsidiaries. The Revolving Credit Facility is secured by a pledge of the shares of (or other ownership or equity interests in) certain subsidiaries to the extent the pledge is not restricted under existing regulations, law or contractual obligations.
Following the date on which we have received an investment grade rating from at least two rating agencies, the Revolving Credit Facility will be automatically amended, the pledge of the shares of (or other ownership or equity interest in) certain subsidiaries will be terminated, and each guarantor (other than Ladder Capital Corp and any subsidiary that is a trigger guarantor) will be released and discharged from all obligations as a guarantor and/or pledgor. There is no guarantee that the Company will achieve or maintain an investment grade rating.
Collateralized Loan Obligations (“CLO”) Debt
As of March 31, 2025, we had $275.6 million of matched term, non-mark-to-market and non-recourse CLO debt included in debt obligations on our consolidated balance sheets.
On July 13, 2021, we financed a pool of $607.5 million of loans at an 82% advance rate on a matched term, non-mark-to-market and non-recourse basis in a managed CLO transaction (“LCCM 2021-FL2”), which generated $498.2 million of gross proceeds. We retained an 18% subordinate and controlling interest in LCCM 2021-FL2. The Company retained control over major decisions made with respect to the administration of the loans in LCCM 2021-FL2, including broad discretion in managing these loans, and has the ability to appoint the special servicer. On February 18, 2025, the Company redeemed all outstanding obligations of LCCM 2021-FL2.
On December 2, 2021, we financed a pool of $729.4 million of loans at a 77.6% advance rate on a matched term, non-mark-to-market and non-recourse basis in a managed CLO transaction (“LCCM 2021-FL3”), which generated $566.2 million of gross proceeds. We retained a 15.6% subordinate and controlling interest in the LCCM 2021-FL3 and held two additional tranches totaling 6.8% as investments. The Company retained control over major decisions made with respect to the administration of the loans in LCCM 2021-FL3, including broad discretion in managing these loans, and has the ability to appoint the special servicer. LCCM 2021-FL3 is a VIE and we are the primary beneficiary and, therefore, consolidate the VIE. Refer to Note 9, Consolidated Variable Interest Entities for further detail.
Committed Loan Financing Facilities
We are a party to multiple committed loan repurchase agreement facilities, totaling $1.1 billion of credit capacity. As of March 31, 2025, we had $62.7 million of borrowings outstanding, with an additional $1.0 billion of committed financing available. Assets pledged as collateral under these facilities are generally limited to first lien whole mortgage loans, mezzanine loans and certain interests in such first mortgage and mezzanine loans.
We have the option to extend some of our existing facilities subject to a number of customary conditions. The lenders have sole discretion to include collateral in these facilities and to determine the market value of the collateral. In certain cases the lenders may require additional collateral, a full or partial repayment of the facilities (margin call), or a reduction in undrawn availability under the facilities. Typically, the lender establishes a maximum percentage of the collateral asset’s market value that can be borrowed. We often borrow at a lower percentage of the collateral asset’s value than the maximum, leaving us with excess borrowing capacity that can be drawn upon at a later date and/or applied against future margin calls so that they can be satisfied on a cashless basis.
Securities Repurchase Financing
We are a party to master repurchase agreements with several counterparties to finance our investments in securities. The securities that serve as collateral for these borrowings are typically highly liquid AAA-rated CMBS with relatively short duration and significant subordination. The lenders have sole discretion to determine the market value of the collateral on a daily basis, and, if the estimated market value of the collateral declines, the lenders have the right to require additional collateral. If the estimated market value of the collateral subsequently increases, we have the right to call back excess collateral.
Mortgage Loan Financing
We typically finance our real estate investments with long-term, non-recourse mortgage financing. These mortgage loans have carrying amounts of $425.7 million, net of unamortized premiums of $3.5 million as of March 31, 2025, representing proceeds received upon financing greater than the contractual amounts due under these agreements. The premiums are being amortized over the remaining life of the respective debt instruments using the effective interest method. We recorded $0.2 million of premium amortization, which decreased interest expense for the three months ended March 31, 2025. During the three months ended March 31, 2025, we executed no new term debt agreements.
Hedging Strategies
We may enter into interest rate and credit spread derivative contracts to mitigate our exposure to changes in interest rates and credit spreads. We generally seek to hedge the interest rate risk on the financing of assets that have a duration longer than five years, including newly-originated conduit first mortgage loans and securities if long enough in duration. We monitor our asset profile and our hedge positions to manage our interest rate and credit spread exposures, and we seek to match fund our assets according to the liquidity characteristics and expected holding periods of our assets.
Financial Covenants
We generally seek to maintain a debt-to-equity ratio of approximately 3.0:1.0 or below. We expect this ratio to fluctuate during the course of a fiscal year due to the normal course of business. This ratio may also fluctuate as a result of our conduit lending operations, in which we generally securitize our inventory of conduit loans at intervals, and also because of changes in our asset mix, due in part to such securitizations. We generally seek to match fund our assets according to their liquidity characteristics and expected hold period. We believe that the defensive positioning of our predominantly senior secured assets and our financing strategy has allowed us to maintain financial flexibility to capitalize on an attractive range of market opportunities as they have arisen.
We and our subsidiaries may incur substantial additional debt in the future. However, we are subject to certain restrictions on our ability to incur additional debt in the indentures governing the Notes (the “Indentures”) and our other debt agreements. Under the Indentures, we may not incur certain types of indebtedness unless our consolidated non-funding debt to equity ratio (as defined in the Indentures) is less than or equal to 1.75:1.00 or if the unencumbered assets of the Company and its subsidiaries is less than 120% of their unsecured indebtedness, although our subsidiaries are permitted to incur indebtedness where recourse is limited to the assets and/or the general credit of such subsidiary.
Our borrowings under certain financing agreements are subject to financial covenants as defined in such agreements, including minimum net worth requirements, minimum liquidity levels, maximum leverage ratios, minimum fixed charge coverage or interest coverage ratios. These restrictions, which would permit us to incur substantial additional debt, are subject to significant qualifications and exceptions.
Further, certain of our financing arrangements and loans on our real property are secured by our assets, including pledges of the equity of certain subsidiaries or the assets of certain subsidiaries. From time to time, certain of these financing arrangements and loans may prohibit certain of our subsidiaries from paying dividends to us, from making distributions on such subsidiary’s capital stock, from repaying to us any loans or advances to such subsidiary from us or from transferring any of such subsidiary’s property or other assets to us or other of our subsidiaries. In addition, one of our subsidiaries was previously a captive insurance company subject to state regulations, which required regulatory approval for dividend distributions, limiting the Company’s ability to utilize cash held by our subsidiary. Effective January 31, 2025, the subsidiary is no longer licensed as a captive insurer and is no longer subject to state regulation.
We are in compliance with all covenants as described in this Quarterly Report as of March 31, 2025.
Results of Operations
A discussion regarding our results of operations for the three months ended March 31, 2025 compared to the three months ended December 31, 2024 is presented below.
Three months ended March 31, 2025 compared to the three months ended December 31, 2024
The following table sets forth information regarding our consolidated results of operations ($ in thousands): | | | | | | | | | | | | | | | | | | | | | | | | | | | | | | | |
| | | | Three Months Ended | | |
| | | | | | March 31, 2025 | | December 31, 2024 | | | | Difference | | | | | | | | |
| | | | | | | | | | | | | | | | | | | |
| Net interest income | | | | | | | | | | | | | | | | | | | |
| Interest income | | | | | $ | 64,326 | | | $ | 78,102 | | | | | $ | (13,776) | | | | | | | | | |
| Interest expense | | | | | 43,997 | | | 50,890 | | | | | (6,893) | | | | | | | | | |
| Net interest income (expense) | | | | | 20,329 | | | 27,212 | | | | | (6,883) | | | | | | | | | |
| Provision for (release of) loan loss reserves, net | | | | | (81) | | | 47 | | | | | (128) | | | | | | | | | |
| Net interest income (expense) after provision for (release of) loan loss reserves | | | | | 20,410 | | | 27,165 | | | | | (6,755) | | | | | | | | | |
| Other income (loss) | | | | | | | | | | | | | | | | | | | |
| Real estate operating income | | | | | 21,773 | | | 23,368 | | | | | (1,595) | | | | | | | | | |
| | | | | | | | | | | | | | | | | | | |
| | | | | | | | | | | | | | | | | | | |
| Net result from mortgage loan receivables held for sale | | | | | 162 | | | (608) | | | | | 770 | | | | | | | | | |
| | | | | | | | | | | | | | | | | | | |
| | | | | | | | | | | | | | | | | | | |
| | | | | | | | | | | | | | | | | | | |
| Gain (loss) on real estate, net | | | | | 3,807 | | | 12,419 | | | | | (8,612) | | | | | | | | | |
| | | | | | | | | | | | | | | | | | | |
| Fee and other income | | | | | 5,285 | | | 4,753 | | | | | 532 | | | | | | | | | |
| Net result from derivative transactions | | | | | 323 | | | 1,549 | | | | | (1,226) | | | | | | | | | |
| Earnings (loss) from investment in unconsolidated ventures | | | | | (732) | | | (68) | | | | | (664) | | | | | | | | | |
| | | | | | | | | | | | | | | | | | | |
| Gain on extinguishment of debt | | | | | 256 | | | (9) | | | | | 265 | | | | | | | | | |
| Total other income (loss) | | | | | 30,874 | | | 41,404 | | | | | (10,530) | | | | | | | | | |
| Costs and expenses | | | | | | | | | | | | | | | | | | | |
| Compensation and employee benefits | | | | | 18,761 | | | 11,754 | | | | | 7,007 | | | | | | | | | |
| Operating expenses | | | | | 4,516 | | | 4,863 | | | | | (347) | | | | | | | | | |
| Real estate operating expenses | | | | | 8,766 | | | 9,637 | | | | | (871) | | | | | | | | | |
| Investment related expenses | | | | | 1,188 | | | 1,809 | | | | | (621) | | | | | | | | | |
| Depreciation and amortization | | | | | 7,336 | | | 7,466 | | | | | (130) | | | | | | | | | |
| Total costs and expenses | | | | | 40,567 | | | 35,529 | | | | | 5,038 | | | | | | | | | |
| Income (loss) before taxes | | | | | 10,717 | | | 33,040 | | | | | (22,323) | | | | | | | | | |
| Income tax expense (benefit) | | | | | (838) | | | 1,711 | | | | | (2,549) | | | | | | | | | |
| Net income (loss) | | | | | $ | 11,555 | | | $ | 31,329 | | | | | $ | (19,774) | | | | | | | | | |
| | | | | | | | | | | | | | | | | | | |
| | | | | | | | | | | | | | | | | | | |
| | | | | | | | | | | | | | | | | | | |
| | | | | | | | | | | | | | | | | | | |
| | | | | | | | | | | | | | | | | | | |
Investment Overview
Activity for the three months ended March 31, 2025 included fundings of $316.4 million and paydowns of $181.9 million, which contributed to a $137.6 million increase of commercial mortgage loans. Activity for the three months ended March 31, 2025 included securities purchases of $521.8 million, $85.2 million of amortization and paydowns and $39.9 million of sales which contributed to a net increase in our securities portfolio of $395.5 million. In addition, we purchased $1.4 billion of short-term U.S. Treasury securities during the three months ended March 31, 2025, and $1.8 billion matured during the three months ended March 31, 2025.
Activity for the three months ended December 31, 2024 included fundings of $123.4 million and paydowns of $575.3 million, contributing to a $448.9 million decrease of commercial mortgage loans. Activity for the three months ended December 31, 2024 included securities purchases of $315.0 million, sales of $21.6 million and $68.2 million of amortization and paydowns, which contributed to a net increase in our securities portfolio of $228.1 million. Activity for the three months ended December 31, 2024 included real estate investment sales of $44.6 million. In addition, we purchased $3.3 billion of short-term U.S. Treasury securities during the three months ended December 31, 2024, and $3.6 billion matured during the three months ended December 31, 2024.
Net Interest Income
The $13.8 million decrease in interest income was primarily attributable to net payoffs within our loan portfolio, partially offset by an increase in interest earned from CMBS securities due to purchases. There was a $0.3 billion increase in average securities investments from $1.0 billion for the three months ended December 31, 2024 to $1.3 billion for the three months ended March 31, 2025. There was a $0.3 billion decrease in average loan investments from $1.9 billion for the three months ended December 31, 2024 to $1.6 billion for the three months ended March 31, 2025.
The $6.9 million decrease in interest expense was primarily attributable to the redemption of all outstanding obligations of LCCM 2021-FL2.
The decrease in net interest income before provision for loan losses of $6.9 million is primarily driven by loan payoffs and paydowns, partially offset by the redemption of all outstanding obligations of LCCM 2021-FL2.
As of March 31, 2025 and December 31, 2024, the weighted average yield on our mortgage loan receivables was 8.6% and 9.3%, respectively. As of March 31, 2025 and December 31, 2024, the weighted average interest rate on borrowings against our mortgage loan receivables was 6.3% and 6.4%, respectively. The decrease in the rate on borrowings against our mortgage loan receivables from March 31, 2025 to December 31, 2024 was primarily due to decreases in prevailing interest rates. As of March 31, 2025, we had outstanding borrowings secured by our mortgage loan receivables equal to 19.9% of the carrying value of our mortgage loan receivables, compared to 42.4% as of December 31, 2024.
As of March 31, 2025 and December 31, 2024, the weighted average yield on our securities was 5.7% and 6.0%, respectively. As of March 31, 2025 and December 31, 2024, we did not have any borrowings against our securities.
Our real estate portfolio is comprised of non-interest bearing assets; however, interest incurred on mortgage financing collateralized by such real estate is included in interest expense. As of March 31, 2025 and December 31, 2024, the weighted average interest rate on mortgage borrowings against our real estate was 6.1% and 6.0%, respectively. As of March 31, 2025, we had outstanding borrowings secured by our real estate equal to 65.0% of the carrying value of our real estate, compared to 66.6% as of December 31, 2024.
Real Estate Operating Income
The decrease of $1.6 million in real estate operating income was primarily attributable to sales that occurred during the three months ended December 31, 2024, for which there was no operating income during the three months ended March 31, 2025.
Net Result from Mortgage Loan Receivables Held for Sale
Net result from mortgage loan receivables held for sale includes unrealized losses on loans held for sale related to lower of cost or market adjustments and realized gains and losses from the sale of loans. During the three months ended March 31, 2025, we recorded $0.2 million of unrealized gains on loans related to lower of cost or market adjustments on our conduit loans. During the three months ended December 31, 2024, we recorded an unrealized loss related to a lower of cost or market adjustment of $(0.6) million. Income from sales of loans, net is subject to market conditions impacting timing, size and pricing and as such may vary significantly quarter to quarter.
Gain (Loss) on Real Estate, net
The decrease of $8.6 million of gain on real estate, net during the three months ended March 31, 2025 compared to the three months ended December 31, 2024 was the result of decreased property sales during the three months ended March 31, 2025 compared to property sales during the three months ended December 31, 2024. Refer to Note 5, Real Estate and Related Lease Intangibles, Net, for further detail.
Fee and Other Income
We generate fee income on the loans we originate and in which we invest and include unrealized and realized gains and losses on securities within fee and other income. The $0.5 million increase in fee and other income was primarily due to an increase in unrealized and realized gains on securities, and the timing of loan payoffs and late fees received for the three months ended March 31, 2025 as compared to the three months ended December 31, 2024.
Net Result from Derivative Transactions
The total net result from derivative transactions is comprised of hedging interest expense, realized gains/losses related to hedge terminations and unrealized gains/losses related to changes in the fair value of asset hedges. Net result from derivative transactions of $323 thousand was comprised of a realized gain of $288 thousand and an unrealized gain of $35 thousand for the three months ended March 31, 2025. Net result from derivative transactions of $1.5 million was comprised of a realized gain of $1.8 million and an unrealized loss of $0.3 million for the three months ended December 31, 2024. The hedge positions primarily relate to fixed rate conduit loans and securities investments. The derivative positions that generated these results were a combination of five and ten year U.S. treasury rate futures that we employed in an effort to hedge the interest rate risk primarily on the financing of our fixed rate assets and the net interest income we earn against the impact of changes in interest rates. The gain during the three months ended March 31, 2025 was primarily related to movement in interest rates during the three months ended March 31, 2025.
Gain (Loss) on Extinguishment of Debt
During the three months ended March 31, 2025, there was $0.3 million of gain on extinguishment of debt as the Company retired: (1) $8.0 million of principal of the 2025 Notes for a repurchase price of $8.0 million, recognizing a $6 thousand net gain on extinguishment of debt after recognizing $7 thousand of unamortized debt issuance costs associated with the retired debt; and (2) $12.4 million of principal of the 2027 Notes for a repurchase price of $12.2 million, recognizing a $0.2 million net gain on extinguishment of debt after recognizing $40 thousand of unamortized debt issuance costs associated with the retired debt.
During the three months ended December 31, 2024, there was $9 thousand of loss on extinguishment of debt as the Company retired $26.3 million of principal of the 2025 Notes for a repurchase price of $26.2 million, recognizing a $9 thousand net loss on extinguishment of debt after recognizing $40 thousand of unamortized debt issuance costs associated with the retired debt.
Compensation and Employee Benefits
Compensation and employee benefits are comprised primarily of salaries, bonuses, stock-based compensation and other employee benefits. The increase of $7.0 million in compensation expense was primarily attributable to the immediate vesting of shares that were granted during the three months ended March 31, 2025, partially offset by a decrease in bonus accrual for the three months ended March 31, 2025 as compared to the three months ended December 31, 2024.
Operating Expenses
Operating expenses are primarily comprised of professional fees, and lease, technology and administrative expenses. The decrease of $0.3 million during the three months ended March 31, 2025 compared to the three months ended December 31, 2024 was primarily related to a decrease in professional fees, information technology and administrative expenses.
Real Estate Operating Expenses
The decrease of $0.9 million in real estate operating expenses during the three months ended March 31, 2025 compared to the three months ended December 31, 2024 was primarily attributable to property sales that occurred during the three months ended December 31, 2024, for which there was no operating expenses during the three months ended March 31, 2025.
Investment Related Expenses
Investment related expenses are comprised primarily of custodian fees, financing costs, servicing fees related to loans, and other deal related expenses. The decrease of $0.6 million during the three months ended March 31, 2025 compared to the three months ended December 31, 2024 was primarily attributable to a decrease in deal related expenses.
Depreciation and Amortization
The $0.1 million decrease in depreciation and amortization during the three months ended March 31, 2025 compared to the three months ended December 31, 2024 was primarily attributable to property sales that occurred during the three months ended December 31, 2024, for which there was no depreciation and amortization during the three months ended March 31, 2025.
Income Tax (Benefit) Expense
Most of our consolidated income tax provision relates to business units held in our TRSs. The decrease in expense during the three months ended March 31, 2025 compared to the three months ended December 31, 2024 is primarily a result of changes in our income in our TRSs.
Results of Operations
A discussion regarding our results of operations for the three months ended March 31, 2025 compared to the three months ended March 31, 2024 is presented below.
Three months ended March 31, 2025 compared to the three months ended March 31, 2024
The following table sets forth information regarding our consolidated results of operations ($ in thousands):
| | | | | | | | | | | | | | | | | |
| Three Months Ended March 31, |
| 2025 | | 2024 | | Difference |
| | | | | |
| Net interest income | | | | | |
| Interest income | $ | 64,326 | | | $ | 95,912 | | | $ | (31,586) | |
| Interest expense | 43,997 | | | 58,771 | | | (14,774) | |
| Net interest income (expense) | 20,329 | | | 37,141 | | | (16,812) | |
| Provision for (release of) loan loss reserves, net | (81) | | | 5,768 | | | (5,849) | |
| Net interest income (expense) after provision for (release of) loan loss reserves | 20,410 | | | 31,373 | | | (10,963) | |
| Other income (loss) | | | | | |
| Real estate operating income | 21,773 | | | 23,887 | | | (2,114) | |
| | | | | |
| | | | | |
| Net result from mortgage loan receivables held for sale | 162 | | | 87 | | | 75 | |
| | | | | |
| | | | | |
| | | | | |
| Gain (loss) on real estate, net | 3,807 | | | — | | | 3,807 | |
| | | | | |
| Fee and other income | 5,285 | | | 3,700 | | | 1,585 | |
| Net result from derivative transactions | 323 | | | 4,019 | | | (3,696) | |
| Earnings (loss) from investment in unconsolidated ventures | (732) | | | (15) | | | (717) | |
| | | | | |
| Gain on extinguishment of debt | 256 | | | 177 | | | 79 | |
| Total other income (loss) | 30,874 | | | 31,855 | | | (981) | |
| Costs and expenses | | | | | |
| Compensation and employee benefits | 18,761 | | | 20,789 | | | (2,028) | |
| Operating expenses | 4,516 | | | 4,643 | | | (127) | |
| Real estate operating expenses | 8,766 | | | 9,146 | | | (380) | |
| Investment related expenses | 1,188 | | | 1,993 | | | (805) | |
| Depreciation and amortization | 7,336 | | | 8,302 | | | (966) | |
| Total costs and expenses | 40,567 | | | 44,873 | | | (4,306) | |
| Income (loss) before taxes | 10,717 | | | 18,355 | | | (7,638) | |
| Income tax expense (benefit) | (838) | | | 1,925 | | | (2,763) | |
| Net income (loss) | $ | 11,555 | | | $ | 16,430 | | | $ | (4,875) | |
| | | | | |
| | | | | |
| | | | | |
| | | | | |
| | | | | |
Investment Overview
Activity for the three months ended March 31, 2025 included fundings of $316.4 million and paydowns of $181.9 million, which contributed to a $137.6 million increase in commercial mortgage loans. Activity for the three months ended March 31, 2025 included securities purchases of $521.8 million, $85.2 million of amortization and paydowns, and sales of $39.9 million, which contributed to a net increase in our securities portfolio of $395.5 million. In addition, we purchased $1.4 billion of short-term U.S. Treasury securities during the three months ended March 31, 2025, of which $1.8 billion matured during the three months ended March 31, 2025.
Activity for the three months ended March 31, 2024 included fundings of $48.7 million and paydowns of $395.3 million, which contributed to a $357.1 million decrease in commercial mortgage loans. Activity for the three months ended March 31, 2024 included securities purchases of $70.6 million, sales of $4.8 million and $88.4 million of amortization and paydowns, which contributed to a net decrease in our securities portfolio of $19.0 million. We acquired $14.1 million in real estate via foreclosure. In addition, we purchased $2.0 billion of short-term U.S. Treasury securities during the three months ended March 31, 2024, of which $1.9 billion matured during the three months ended March 31, 2024.
Net Interest Income
The $31.6 million decrease in interest income was primarily attributable to net payoffs within our loan portfolio, partially offset by an increase in interest earned on CMBS securities due to purchases. There was a $1.4 billion decrease in average loan investments from $3.0 billion for the three months ended March 31, 2024 to $1.6 billion for the three months ended March 31, 2025. There was a $0.8 billion increase in average securities investments from $0.5 billion for the three months ended March 31, 2024 to $1.3 billion for the three months ended March 31, 2025.
The $14.8 million decrease in interest expense is primarily related to lower outstanding balances on our securities and loan repurchase facilities, the payoff of our FHLB borrowings, redemption of all outstanding obligations of LCCM 2021-FL2, as well as a reduction in expense as a result of redemptions of our Notes, partially offset by the issuance of our 2031 Notes.
As of March 31, 2025, the weighted average yield on our mortgage loan receivables was 8.6%, compared to 9.4% as of March 31, 2024. As of March 31, 2025, the weighted average interest rate on borrowings against our mortgage loan receivables was 6.3%, compared to 7.2% as of March 31, 2024 primarily due to decreases in prevailing interest rates. As of March 31, 2025, we had outstanding borrowings secured by our mortgage loan receivables equal to 19.9% of the carrying value of our mortgage loan receivables, compared to 55.3% as of March 31, 2024.
As of March 31, 2025 the weighted average yield on our securities was 5.7%, compared to 6.8% as of March 31, 2024. As of March 31, 2025, we did not have any borrowings against our securities. As of March 31, 2024, the weighted average interest rate on borrowings against our securities was 5.8%. As of March 31, 2024, we had outstanding borrowings secured by our securities equal to 19.6% of the carrying value of our real estate securities.
Our real estate is comprised of non-interest bearing assets; however, interest incurred on mortgage financing collateralized by such real estate is included in interest expense. As of March 31, 2025, the weighted average interest rate on mortgage borrowings against our real estate assets was 6.1%, compared to 6.0% as of March 31, 2024. As of March 31, 2025, we had outstanding borrowings secured by our real estate equal to 65.0% of the carrying value of our real estate, compared to 65.3% as of March 31, 2024.
Provision for (release of) Loan Loss Reserves
The release of loan loss reserves for the three months ended March 31, 2025 of $(0.1) million was primarily due to a decrease in the size of our balance sheet first mortgage loan portfolio as a result of repayments, offset by continued uncertainty in macroeconomic market conditions affecting commercial real estate. For additional information, refer to Note 3, Mortgage Loan Receivables, in the consolidated financial statements.
The provision for loan loss reserves the three months ended March 31, 2024 was $5.8 million. The increase in provision associated with the general reserve during the three months ended March 31, 2024 was primarily due to adverse changes in macroeconomic market conditions affecting commercial real estate partially offset by a decrease in the size of our balance sheet first mortgage loan portfolio as a result of repayments.
For additional information, refer to “Allowance for Credit Losses and Non-Accrual Status” in Note 3, Mortgage Loan Receivables, to the consolidated financial statements.
Real Estate Operating Income
The decrease of $2.1 million in real estate operating income was primarily attributable to real estate sales that occurred between March 31, 2024 and March 31, 2025, partially offset by foreclosures that occurred during the same period. Refer to Note 5, Real Estate and Related Lease Intangibles, Net, for further details.
Net Result from Mortgage Loan Receivables Held for Sale
Net result from mortgage loan receivables held for sale includes unrealized losses on loans held for sale related to lower of cost or market adjustments and realized gains and losses from the sale of loans. During the three months ended March 31, 2025, we recorded $0.2 million of unrealized gains on loans related to lower of cost or market adjustments on our conduit loans. During the three months ended March 31, 2024, we recorded $0.1 million of unrealized losses on loans related to lower of cost or market adjustments on our conduit loans. Income from sales of loans, net is subject to market conditions impacting timing, size and pricing and as such may vary significantly quarter to quarter.
Gain (Loss) on Real Estate, net
The increase of $3.8 million of gain on real estate, net during the three months ended March 31, 2025 compared to the three months ended March 31, 2024 was the result of property sales during the three months ended March 31, 2025 compared to no property sales during the three months ended March 31, 2024. Refer to Note 5, Real Estate and Related Lease Intangibles, Net, for further detail.
Fee and Other Income
We generate fee income on the loans we originate and in which we invest and include unrealized and realized gains and losses on securities within fee and other income. The $1.6 million increase in fee and other income was primarily due to an increase in unrealized and realized gains on securities, and the timing of loan payoffs and late fees received for the three months ended March 31, 2025 as compared to the three months ended March 31, 2024.
Net Result from Derivative Transactions
Net result from derivative transactions of $323 thousand was comprised of a realized gain of $288 thousand and an unrealized gain of $35 thousand for the three months ended March 31, 2025. Net result from derivative transactions of $4.0 million was comprised of a realized gain of $4.8 million and an unrealized loss of $0.8 million for the three months ended March 31, 2024. The hedge positions primarily relate to fixed rate conduit loans and securities investments. The derivative positions that generated these results were a combination of five and ten year U.S. treasury rate futures that we employed in an effort to hedge the interest rate risk primarily on the financing of our fixed rate assets and the net interest income we earn against the impact of changes in interest rates. The net gain in 2025 was primarily related to changes in interest rates during the three months ended March 31, 2025.
Gain on Extinguishment of Debt
Gain on extinguishment of debt totaled $0.3 million for the three months ended March 31, 2025. During the three months ended March 31, 2025, the Company retired: (1) $8.0 million of principal of the 2025 Notes for a repurchase price of $8.0 million, recognizing an $6 thousand net gain on extinguishment of debt after recognizing $7 thousand of unamortized debt issuance costs associated with the retired debt; and (2) $12.4 million of principal of the 2027 Notes for a repurchase price of $12.2 million, recognizing a $0.2 million net gain on extinguishment of debt after recognizing $40 thousand of unamortized debt issuance costs associated with the retired debt.
Gain on extinguishment of debt totaled $0.2 million for the three months ended March 31, 2024. During the three months ended March 31, 2024, the Company retired $2.0 million of principal of the 2029 Notes for a repurchase price of $1.8 million, recognizing a $0.2 million net gain on extinguishment of debt after recognizing $21 thousand of unamortized debt issuance costs associated with the retired debt.
Compensation and Employee Benefits
Compensation and employee benefits are comprised primarily of salaries, bonuses, stock-based compensation and other employee benefits. The decrease of $2.0 million in compensation expense is primarily due to a decrease in bonus compensation expense for the three months ended March 31, 2025 as compared three months ended March 31, 2024.
Operating Expenses
Operating expenses are primarily comprised of professional fees, lease expense and technology expenses. The decrease during the three months ended March 31, 2025 as compared to March 31, 2024 of $0.1 million was primarily related to a decrease in professional fees.
Real Estate Operating Expenses
The decrease of $0.4 million in real estate operating expenses was primarily attributable to real estate sales that occurred between March 31, 2024 and March 31, 2025, partially offset by foreclosures that occurred during the same period. Refer to Note 5, Real Estate and Related Lease Intangibles, Net, for further details.
Investment Related Expenses
Investment related expenses are comprised primarily of custodian fees, financing costs, servicing fees related to loans and other loan related expenses. The decrease during the three months ended March 31, 2025 as compared to March 31, 2024 of $0.8 million was primarily attributable to a decrease in loan related expenses as a result of a smaller loan portfolio.
Depreciation and Amortization
The decrease of $1.0 million in depreciation and amortization was primarily attributable to real estate sales that occurred between March 31, 2024 and March 31, 2025, partially offset by foreclosures that occurred during the same period. Refer to Note 5, Real Estate and Related Lease Intangibles, Net, for further details.
Income Tax (Benefit) Expense
Most of our consolidated income tax provision related to the business units held in our TRSs. The decrease in expense of $2.8 million during the three months ended March 31, 2025 as compared to March 31, 2024 is primarily a result of changes in income generated by our TRSs.
Liquidity and Capital Resources
The management of our liquidity and capital diversity and allocation strategies is critical to the success and growth of our business. We manage our sources of liquidity to complement our asset composition and to diversify our exposure across multiple capital markets and counterparties.
We require substantial amounts of capital to support our business. The management team, in consultation with our board of directors, establishes our overall liquidity and capital allocation strategies. A key objective of those strategies is to support the execution of our business strategy while maintaining sufficient ongoing liquidity throughout the business cycle to service our financial obligations as they become due. When making funding and capital allocation decisions, members of our senior management consider: business performance; the availability of, and costs and benefits associated with, different funding sources; current and expected capital markets and general economic conditions; our asset composition and capital structure; and our targeted liquidity profile and risks relating to our funding needs.
To ensure that Ladder can effectively address the funding needs of the Company on a timely basis, we maintain a diverse array of liquidity sources including: (1) cash and cash equivalents; (2) cash generated from operations; (3) proceeds from debt financing; (4) principal repayments on investments including mortgage loans and securities; (5) proceeds from securitizations and sales of loans; (6) proceeds from the sale of securities; (7) proceeds from the sale of real estate; and (8) proceeds from the issuance of equity capital. We use these funding sources to meet our obligations on a timely basis and have the ability to use our significant unencumbered asset base to further finance our business.
Our primary uses of liquidity are for: (1) the funding of loan, real estate-related and securities investments; (2) the repayment of short-term and long-term borrowings and related interest; (3) the funding of our operating expenses; and (4) distributions to our equity investors to comply with the REIT distribution requirements. We require short-term liquidity to fund loans that we originate and hold on our consolidated balance sheet pending sale, including through whole loan sale, participation, or securitization. We generally require longer-term funding to finance the loans and real estate-related investments that we hold for investment. We have historically used the aforementioned funding sources to meet the operating and investment needs as they have arisen and have been able to do so by applying a rigorous approach to long and short-term cash and debt forecasting.
In addition, as a REIT, we are also required to make sufficient dividend payments to our shareholders in amounts at least sufficient to maintain our REIT status. Under IRS guidance, we may elect to pay a portion of our dividends in stock, subject to a cash/stock election by our shareholders, to optimize our level of capital retention. Accordingly, our cash requirement to pay dividends to maintain REIT status could be substantially reduced at the discretion of the board of directors.
Our principal debt financing sources include: (1) long-term senior unsecured notes in the form of corporate bonds; (2) an unsecured Revolving Credit Facility; (3) CLO issuances; (4) committed and uncommitted secured funding provided by banks and other lenders; and (5) long term non-recourse mortgage financing.
In the future, we may also use other sources of financing to fund the acquisition of our assets, including credit facilities, warehouse facilities, repurchase facilities and other secured and unsecured forms of borrowing. These financings may be collateralized or non-collateralized, may involve one or more lenders and may accrue interest at either fixed or floating rates. We may also seek to raise further equity capital or issue debt securities in order to fund our future investments.
Refer to “Financial Covenants” and “Our Financing Strategies” for further disclosure of our diverse financing sources and, for a summary of our financial obligations, refer to the Contractual Obligations table below. All of our existing financial obligations due within the following year can be extended for one or more additional years at our discretion, refinanced or repaid at maturity or are incurred in the normal course of business (i.e., interest payments/loan funding obligations).
Cash Flows
We held cash and cash equivalents of $479.8 million and restricted cash of $13.7 million as of March 31, 2025. We held cash and cash equivalents of $1.3 billion and restricted cash of $12.6 million as of December 31, 2024.
The following table provides a breakdown of the net change in our cash, cash equivalents, and restricted cash ($ in thousands):
| | | | | | | | | | | | | | | |
| | Three Months Ended March 31, | | | | |
| | 2025 | | 2024 | | | | |
| Net cash provided by (used in) operating activities | $ | (28,727) | | | $ | (20,375) | | | | | |
| Net cash provided by (used in) investing activities | (373,783) | | | 337,135 | | | | | |
| Net cash provided by (used in) financing activities | (410,202) | | | (160,211) | | | | | |
| Net increase (decrease) in cash, cash equivalents and restricted cash | $ | (812,712) | | | $ | 156,549 | | | | | |
Three months ended March 31, 2025
We experienced a net decrease in cash, cash equivalents and restricted cash of $(812.7) million for the three months ended March 31, 2025, reflecting cash used in operating activities of $(28.7) million, cash used in investing activities of $(373.8) million and cash used in financing activities of $(410.2) million.
Net cash used in operating activities of $(28.7) million was primarily driven by conduit loan originations, partially offset by net interest income and net operating income on our real estate portfolio.
Net cash used in investing activities of $(373.8) million was driven by $(521.8) million in purchases of securities and $(253.0) million of origination of mortgage loans held for investment, partially offset by $264.0 million of repayment from mortgage loan receivables, $84.5 million in repayments on securities, $39.9 million of proceeds from sale of securities and $13.1 million in proceeds from sale of real estate.
Net cash used in financing activities of $(410.2) million was primarily as a result of net repayments of borrowings of $(366.8) million, $(30.7) million of dividend payments, $(8.7) million payment to satisfy minimum federal and state tax withholdings on restricted stock, $(2.3) million purchase of treasury stock, and $(1.7) million in deferred financing cost.
Three months ended March 31, 2024
We experienced a net increase in cash, cash equivalents and restricted cash of $156.5 million for the three months ended March 31, 2024, reflecting cash used in operating activities of $(20.4) million, cash provided by investing activities of $337.1 million and cash used in financing activities of $(160.2) million.
Net cash used in operating activities of $(20.4) million was primarily driven by the payment of 2023 performance based compensation in 2024, partially offset by net interest income and increases in net operating income on our real estate portfolio.
Net cash provided by investing activities of $337.1 million was driven by $362.9 million of repayment from mortgage loan receivables, $88.1 million in repayments on securities, and $4.8 million of proceeds from sale of securities, partially offset by $(70.6) million in purchases of securities and $(48.7) million of origination of mortgage loans held for investment.
Net cash used in financing activities of $(160.2) million was primarily as a result of net repayments of borrowings of $(118.2) million, $(30.9) million of dividend payments, $(8.9) million of shares acquired to satisfy minimum federal and state tax withholdings on restricted stock, $(0.6) million purchase of treasury stock, and $(1.3) million in deferred financing cost.
Unencumbered Assets
As of March 31, 2025, we held unencumbered cash of $479.8 million, unencumbered loans of $1.2 billion, unencumbered securities of $1.5 billion, unencumbered real estate of $223.8 million and $249.7 million of other assets not encumbered by any portion of secured indebtedness. As of December 31, 2024, we held unencumbered cash and cash equivalents of $1.3 billion, unencumbered loans of $689.7 million, unencumbered securities of $1.1 billion, unencumbered real estate of $213.4 million and $409.1 million of other assets not encumbered by any portion of secured indebtedness.
Borrowings under various financing arrangements
Our financing strategies are critical to the success and growth of our business. We manage our leverage policies to complement our asset composition and to diversify our exposure across multiple counterparties. Our borrowings under various financing arrangements as of March 31, 2025 are set forth in the table below ($ in thousands):
| | | | | |
| March 31, 2025 |
| Loan repurchase facilities | $ | 62,738 | |
| |
| |
| |
| |
| Mortgage debt(1) | 425,690 | |
| |
| CLO debt | 275,623 | |
| |
| Senior unsecured notes(2) | 2,005,703 | |
| |
| |
| Total debt obligations, net | $ | 2,769,754 | |
(1)Presented net of unamortized debt issuance costs of $0.9 million and net of premiums of $3.5 million as of March 31, 2025.
(2)Presented net of unamortized debt issuance costs of $15.4 million as of March 31, 2025.
The Company’s repurchase agreements include financial covenants, including minimum net worth requirements, minimum liquidity levels, maximum leverage ratios and minimum fixed charge or interest coverage ratios. We were in compliance with all covenants as of March 31, 2025 and December 31, 2024. Further, certain of our financing arrangements and loans on our real property are secured by the assets of the Company, including pledges of the equity of certain subsidiaries or the assets of certain subsidiaries. From time to time, certain of these financing arrangements and loans may prohibit certain of our subsidiaries from paying dividends to the Company, from making distributions on such subsidiary’s capital stock, from repaying to the Company any loans or advances to such subsidiary from the Company or from transferring any of such subsidiary’s property or other assets to the Company or other subsidiaries of the Company.
Senior Unsecured Notes
As of March 31, 2025, the Company had $2.0 billion of senior unsecured notes outstanding. These unsecured financings were comprised of $287.7 million in aggregate principal amount of 5.25% senior notes due 2025 (the “2025 Notes”), $599.5 million in aggregate principal amount of 4.25% senior notes due 2027 (the “2027 Notes”), $633.9 million in aggregate principal amount of 4.75% senior notes due 2029 (the “2029 Notes”) and $500.0 million in aggregate principal amount of 7.00% senior notes due 2031 (the “2031 Notes”, collectively with the 2025 Notes, the 2027 Notes and the 2029 Notes, the “Notes”).
As of December 31, 2024, the Company had $2.0 billion of senior unsecured notes outstanding. These unsecured financings were comprised of $295.7 million in aggregate principal amount of the 2025 Notes, $611.9 million in aggregate principal amount of the 2027 Notes, $633.9 million in aggregate principal amount of the 2029 Notes and $500.0 million in aggregate principal amount of the 2031 Notes. The 2031 Notes were issued during the year ended December 31, 2024 with an aggregate principal balance of $500.0 million.
LCFH issued the Notes with Ladder Capital Finance Corporation (“LCFC”), as co-issuers on a joint and several basis. LCFC is a 100% owned finance subsidiary of LCFH with no assets, operations, revenues or cash flows other than those related to the issuance, administration and repayment of the Notes. The Company and certain subsidiaries of LCFH currently guarantee the obligations under the Notes and the indenture. The Company believes it was in compliance with all covenants of the Notes as of March 31, 2025 and 2024. The Notes are presented net of unamortized debt issuance costs of $15.4 million and $16.5 million as of March 31, 2025 and December 31, 2024, respectively.
The Notes require interest payments semi-annually in cash in arrears, are unsecured, and are subject to an unencumbered assets to unsecured debt covenant. The Company may redeem the Notes prior to their stated maturity, in whole or in part, at any time or from time to time, with required notice and at a redemption price as specified in each respective indenture governing the
Notes, plus accrued and unpaid interest, if any, to the redemption date. The board of directors has authorized the Company to repurchase any or all of the Notes from time to time without further approval.
During the three months ended March 31, 2025, the Company repurchased $8.0 million of the 2025 Notes and $12.4 million of the 2027 Notes recognizing a net gain on extinguishment of debt of $6 thousand and $250 thousand, respectively.
Revolving Credit Facility
The Company’s Revolving Credit Facility is available on a revolving basis to finance the Company’s working capital needs and for general corporate purposes. On January 2, 2025, the Company increased the aggregate maximum borrowing amount of the Revolving Credit Facility to $850.0 million, following the upsize to $725 million on December 20, 2024. The Revolving Credit Facility also allows the Company to enter into additional incremental revolving commitments up to an aggregate facility size of $1.3 billion subject to certain customary conditions. Borrowings under the Revolving Credit Facility bear interest at a rate equal to adjusted term SOFR plus a margin. The margin for borrowings is adjustable based on the Company’s credit rating and is between 77.5 basis points and 170 basis points. As of March 31, 2025, the Company had no outstanding borrowings on the Revolving Credit Facility.
The obligations under the Revolving Credit Facility are guaranteed by the Company and certain of its subsidiaries. The Revolving Credit Facility is secured by a pledge of the shares of (or other ownership or equity interests in) certain subsidiaries to the extent the pledge is not restricted under existing regulations, law or contractual obligations.
Following the date on which the Company has received an investment grade rating from at least two rating agencies, the Revolving Credit Facility will be automatically amended, the pledge of the shares of (or other ownership or equity interest in) certain subsidiaries will be terminated, and each guarantor (other than Ladder Capital Corp and any subsidiary that is a trigger guarantor) will be released and discharged from all obligations as a guarantor and/or pledgor. There is no guarantee that the Company will achieve or maintain an investment grade rating.
Collateralized Loan Obligations (“CLO”) Debt
As of March 31, 2025, the Company had $275.6 million of matched term, non-mark-to-market and non-recourse CLO debt included in debt obligations on its consolidated balance sheets.
As of December 31, 2024, the Company had $601.4 million of matched term, non-mark-to-market and non-recourse CLO debt included in debt obligations on its consolidated balance sheets. Unamortized debt issuance costs of $0.1 million were included in CLO debt as of December 31, 2024.
On July 13, 2021, the Company financed a pool of $607.5 million of loans at an 82% advance rate on a matched term, non-mark-to-market and non-recourse basis in a managed CLO transaction (“LCCM 2021-FL2”), which generated $498.2 million of gross proceeds to Ladder. The Company retained an 18% subordinate and controlling interest in LCCM 2021-FL2. The Company retained control over major decisions made with respect to the administration of the loans in LCCM 2021-FL2, including broad discretion in managing these loans, and has the ability to appoint the special servicer. On February 18, 2025, the Company redeemed all outstanding obligations of LCCM 2021-FL2.
On December 2, 2021, the Company financed a pool of $729.4 million of loans at a 77.6% advance rate on a matched term, non-mark-to-market and non-recourse basis in a managed CLO transaction (“LCCM 2021-FL3”), which generated $566.2 million of gross proceeds to Ladder. The Company retained a 15.6% subordinate and controlling interest in the LCCM 2021-FL3 and held two additional tranches totaling 6.8% as investments. The Company retained control over major decisions made with respect to the administration of the loans in LCCM 2021-FL3, including broad discretion in managing these loans, and has the ability to appoint the special servicer. LCCM 2021-FL3 is a VIE and the Company is the primary beneficiary and, therefore, consolidates the VIE. Refer to Note 9, Consolidated Variable Interest Entities for further detail.
Committed Loan Financing Facilities
The Company is a party to multiple committed loan repurchase agreement facilities, totaling $1.1 billion of credit capacity as of March 31, 2025. As of March 31, 2025, the Company had $62.7 million of borrowings outstanding, with an additional $1.0 billion of committed financing available. As of December 31, 2024, the Company had $62.7 million of borrowings outstanding,
with an additional $1.1 billion of committed financing available. Assets pledged as collateral under these facilities are generally limited to first lien whole mortgage loans, mezzanine loans and certain interests in such first mortgage and mezzanine loans.
The Company has the option to extend some of its existing facilities subject to a number of customary conditions. The lenders have sole discretion to include collateral in these facilities and to determine the market value of the collateral. In certain cases the lenders may require additional collateral, a full or partial repayment of the facilities (margin call) or a reduction in undrawn availability under the facilities. Typically, the facilities are established with stated guidelines regarding the maximum percentage of the collateral asset’s market value that can be borrowed. The Company often borrows at a lower percentage of the collateral asset’s value than the maximum leaving the Company with excess borrowing capacity that can be drawn upon at a later date and/or applied against future margin calls so that they can be satisfied on a cashless basis.
Securities Repurchase Financing
The Company is a party to master repurchase agreements with several counterparties to finance its investments in securities. The securities that serve as collateral for these borrowings are typically highly liquid AAA-rated CMBS with relatively short duration and significant subordination. The lenders have sole discretion to determine the market value of the collateral on a daily basis, and, if the estimated market value of the collateral declines, the lenders have the right to require additional collateral. If the estimated market value of the collateral subsequently increases, the Company has the right to call back excess collateral. As of March 31, 2025, the Company had no securities repurchase agreements outstanding.
Mortgage Loan Financing
The Company typically finances its real estate investments with long-term, non-recourse mortgage financing. These mortgage loans have carrying amounts of $425.7 million and $446.4 million, net of unamortized premiums of $3.5 million and $3.7 million as of March 31, 2025 and December 31, 2024, respectively, representing proceeds received upon financing greater than the contractual amounts due under these agreements. The premiums are being amortized over the remaining life of the respective debt instruments using the effective interest method. The Company recorded $0.2 million of premium amortization, which decreased interest expense for the three months ended March 31, 2025 and 2024. During the three months ended March 31, 2025, the Company executed no new term debt agreements. During the three months ended March 31, 2024 the Company executed five new term debt agreements to finance properties in its real estate portfolio with a carrying amount of $40.1 million.
Stock Repurchases
On April 24, 2024, the board of directors authorized the repurchase of $75.0 million of the Company’s Class A common stock from time to time without further approval. This authorization increased the remaining outstanding authorization per the July 27, 2022 authorization from $43.6 million to $75.0 million. Stock repurchases by the Company are generally made for cash in open market transactions at prevailing market prices but may also be made in privately negotiated transactions or otherwise. The timing and amount of purchases are determined based upon prevailing market conditions, our liquidity requirements, contractual restrictions and other factors. As of March 31, 2025, the Company has a remaining amount available for repurchase of $66.8 million, which represents 4.6% in the aggregate of its outstanding Class A common stock, based on the closing price of $11.41 per share on such date. Refer to Note 10, Equity, to our consolidated financial statements included elsewhere in this Quarterly Report, for disclosure of the Company’s repurchase activity.
Subsequent to quarter end, on April 23, 2025, the board of directors authorized the repurchase of $100.0 million of the Company’s Class A common stock from time to time without further approval. This authorization increased the remaining outstanding authorization per the April 24, 2024 authorization from $66.8 million to $100.0 million.
The following table is a summary of the Company’s repurchase activity of its Class A common stock during the three months ended March 31, 2025 ($ in thousands):
| | | | | | | | | | | | | | |
| | Shares | | Amount(1) |
| Authorizations remaining as of December 31, 2024 | | | | $ | 67,604 | |
| | | | |
| Repurchases paid: | | | | |
| January 1, 2025 - January 31, 2025 | | — | | | — | |
| February 1, 2025 - February 28, 2025 | | — | | | — | |
| March 1, 2025 - March 31, 2025 | | 70,506 | | | (805) | |
| | | | |
| | | | |
| | | | |
| | | | |
| | | | |
| | | | |
| | | | |
| | | | |
| | | | |
| Authorizations remaining as of March 31, 2025 | | | | $ | 66,799 | |
(1)Amount excludes commissions paid associated with share repurchases.
(2)On April 24, 2024, the Board authorized repurchases up to $75.0 million in aggregate.
Dividends
In order for the Company to maintain its qualification as a REIT under Sections 856 through 860 of the Internal Revenue Code (the “Code”), it must annually distribute at least 90% of its taxable income. The Company has paid and in the future intends to declare regular quarterly distributions to its shareholders in aggregating to an amount approximating at least 90% of the REIT’s annual net taxable income.
All distributions are made at the discretion of our board of directors and depend on our earnings, our financial condition, any debt covenants, maintenance of our REIT qualification, restrictions on making distributions under Delaware law and other factors as our board of directors may deem relevant from time to time.
Refer to Note 10, Equity, to our consolidated financial statements included elsewhere in this Quarterly Report, for disclosure of dividends declared.
Principal Repayments on Investments
We receive principal amortization on our loans and securities as part of the normal course of our business. Repayment of mortgage loan receivables provided net cash of $264.0 million for the three months ended March 31, 2025 and $362.9 million for the three months ended March 31, 2024. Repayment of real estate securities provided net cash of $84.5 million for the three months ended March 31, 2025, and $88.1 million for the three months ended March 31, 2024.
Proceeds from Securitizations and Sales of Loans
We sell our conduit mortgage loans to securitization trusts and to other third parties as part of our normal course of business and from time to time will sell balance sheet mortgage loans. There were no proceeds from sales of mortgage loans for the three months ended March 31, 2025. There were $40.4 million proceeds from sales of mortgage loans for the three months ended March 31, 2024.
Proceeds from the Sale of Securities
We sell our investments in CMBS, including CRE CLOs, U.S. Agency securities, corporate bonds, U.S. Treasury securities, and equity securities as a part of our normal course of business. Proceeds from sales of securities provided net cash of $39.9 million for the three months ended March 31, 2025, and $4.8 million for the three months ended March 31, 2024.
Proceeds from the Sale of Real Estate
There were $13.1 million of proceeds from sales of real estate, net of closing costs for the three months ended March 31, 2025. There were no proceeds from sales of real estate, net for the three months ended March 31, 2024.
Other Potential Sources of Financing
In the future, we may also use other sources of financing to fund the acquisition of our assets, including credit facilities, warehouse facilities, repurchase facilities and other secured and unsecured forms of borrowing. These financings may be
collateralized or non-collateralized, may involve one or more lenders and may accrue interest at either fixed or floating rates. We may also seek to raise further equity capital or issue debt securities in order to fund our future investments.
Contractual Obligations
Contractual obligations as of March 31, 2025 were as follows ($ in thousands):
| | | | | | | | | | | | | | | | | | | | | | | | | | | | | |
| Contractual Obligations (1) |
| Less than 1 Year | | 1-3 Years | | 3-5 Years | | More than 5 Years | | Total |
| Secured financings(2) | $ | 38,309 | | | $ | 295,054 | | | $ | 59,964 | | | $ | 92,490 | | | $ | 485,817 | |
| | | | | | | | | |
| Senior unsecured notes | 287,699 | | | 599,490 | | | 633,919 | | | 500,000 | | | 2,021,108 | |
| Interest payable(3) | 95,975 | | | 124,210 | | | 61,024 | | | 24,746 | | | 305,955 | |
| Other funding obligations(4) | 3,099 | | | 4,786 | | | | | — | | | 7,885 | |
| | | | | | | | | |
| Operating lease obligations | 3,243 | | | 5,100 | | | 4,715 | | | 8,630 | | | 21,688 | |
| Total | $ | 428,325 | | | $ | 1,028,640 | | | $ | 759,622 | | | $ | 625,866 | | | $ | 2,842,453 | |
(1)As more fully disclosed in Note 6, Debt Obligations, Net, to our consolidated financial statements included elsewhere in this Quarterly Report, the allocation of repayments under our committed loan repurchase facilities is based on the earlier of: (i) the maturity date of each agreement; or (ii) the maximum maturity date of the collateral loans, assuming all extension options are exercised by the borrower.
(2)Total does not include $275.6 million of consolidated CLO debt obligations, as the satisfaction of these liabilities will not require cash outlays from us.
(3)Comprised of interest on secured financings and on senior unsecured notes. For borrowings with variable interest rates, we used the rates in effect as of March 31, 2025 to determine the future interest payment obligations.
(4)Comprised primarily of our off-balance sheet unfunded commitment to provide additional first mortgage loan financing as of March 31, 2025. The allocation of our unfunded loan commitments is based on the earlier of the commitment expiration date or the final maturity date, however, we may be obligated to fund these commitments earlier than such date. This amount excludes $32.2 million of future funding commitments that require the occurrence of certain “good news” events, such as the owner concluding a lease agreement with a major tenant in the building or reaching a pre-determined net operating income which may or may not be achieved.
The table above does not include amounts due under our derivative agreements as those contracts do not have fixed and determinable payments. Our contractual obligations will be refinanced and/or repaid from earnings as well as amortization and sales of our liquid collateral. We have made investments in various unconsolidated ventures of which our maximum exposure to loss from these investments is limited to the carrying value of our investments.
Future Liquidity Needs
In addition to the future contractual obligations above, the Company, in the coming year and beyond, as a part of its normal course of business will require cash to fund unfunded loan commitments and new investments in a combination of balance sheet mortgage loans, conduit loans, real estate investments and securities as it deems appropriate as well as necessary expenses as a part of general corporate purposes. These new investments and general corporate expenses may be funded with existing cash, proceeds from loan and securities payoffs, through financing using our Revolving Credit Facility or loan and security financing facilities, or through additional debt or equity raises. The Company has no known material cash requirements other than its contractual obligations in the above table, unfunded commitments and future general corporate expenses.
Unfunded Loan Commitments
We may be a party to financial instruments with off-balance sheet risk in the normal course of business to meet the financial needs of our borrowers. These commitments are not reflected on the consolidated balance sheets. As of March 31, 2025, our off-balance sheet arrangements consisted of $39.8 million of unfunded commitments of mortgage loan receivables held for investment. 81% of these unfunded commitments require the occurrence of certain “good news” events, such as the owner concluding a lease agreement with a major tenant in the building or reaching some pre-determined net operating income. As of December 31, 2024, our off-balance sheet arrangements consisted of $34.6 million of unfunded commitments of mortgage loan receivables held for investment to provide additional first mortgage loan financing. Such commitments are subject to our borrowers’ satisfaction of certain financial and nonfinancial covenants and involve, to varying degrees, elements of credit risk
in excess of the amount recognized in the consolidated balance sheets. Commitments are subject to our loan borrowers’ satisfaction of certain financial and nonfinancial covenants and may or may not be funded depending on a variety of circumstances including timing, credit metric hurdles, and other nonfinancial events occurring.
Interest Rate Environment
The nature of the Company’s business exposes it to market risk arising from changes in interest rates. Changes, both increases and decreases, in the rates the Company is able to charge its borrowers, the yields the Company is able to achieve in its securities investments, and the Company’s cost of borrowing directly impacts its net income. The Company’s net interest income includes interest from both fixed and floating rate debt. The percentage of the Company’s assets and liabilities bearing interest at fixed and floating rates may change over time, and asset composition may differ materially from debt composition. Refer to Item 3 “Quantitative and Qualitative Disclosures about Market Risk” for further disclosures surrounding the impact of rising or falling interest rate on our earnings.
Critical Accounting Estimates
The preparation of financial statements in accordance with GAAP requires management to make estimates and judgments in certain circumstances that affect amounts reported as assets, liabilities, revenues and expenses. We have established detailed policies and control procedures intended to ensure that valuation methods, including any judgments made as part of such methods, are well controlled, reviewed and applied consistently from period to period. We base our estimates on historical corporate and industry experience and various other assumptions that we believe to be appropriate under the circumstances. The Company’s critical accounting estimates are those which require assumptions to be made about matters that are highly uncertain. Different estimates could have a material effect on the Company’s financial results. For all of these estimates, we caution that future events rarely develop exactly as forecasted and, therefore, routinely require adjustment.
During 2025, management reviewed and evaluated these critical accounting estimates and policies and believes they are appropriate. The following discussion describes critical accounting estimates that require more significant judgment by management. This summary should be read in conjunction with a more complete discussion of our significant accounting policies which are described in Note 2, Significant Accounting Policies, to our consolidated financial statements included elsewhere in this Quarterly Report.
Allowance for Loan Losses
The Company uses a current expected credit loss model (“CECL”) for estimating the provision for loan losses on its loan portfolio. The CECL model requires the consideration of possible credit losses over the life of an instrument and includes a portfolio-based component and an asset-specific component. The Company engages a third-party service provider to provide market data and a credit loss model. The credit loss model is a forward-looking, econometric, commercial real estate (“CRE”) loss forecasting tool. It is comprised of a probability of default (“PD”) model and a loss given default (“LGD”) model that, layered together with the Company’s loan-level data, fair value of collateral, net operating income of collateral, selected forward-looking macroeconomic variables, and pool-level mean loss rates, produces life of loan expected losses (“EL”) at the loan and portfolio level. Where management has determined that the credit loss model does not fully capture certain external factors, including portfolio trends or loan-specific factors, a qualitative adjustment to the reserve is recorded. In addition, interest receivable on loans is not included in the Company’s CECL calculations as the Company performs timely write offs of aged interest receivable. The Company has made a policy election to write off aged receivables through interest income as opposed to through the CECL provision on its statements of income.
Loans for which the borrower or sponsor is experiencing financial difficulty, and where repayment of the loan is expected substantially through the operation or sale of the underlying collateral, are considered collateral dependent loans. For collateral dependent loans, the Company may elect a practical expedient that allows the Company to measure expected losses based on the difference between the collateral’s fair value and the amortized cost basis of the loan. When the repayment or satisfaction of the loan is dependent on a sale, rather than operations of the collateral, the fair value is adjusted for the estimated costs to sell the collateral. If foreclosure is probable, the Company is required to measure for expected losses using this methodology.
The Company generally will use the direct capitalization rate valuation methodology or the sales comparison approach to estimate the fair value of the collateral for loans and in certain cases will obtain external appraisals. Determining fair value of the collateral may take into account a number of assumptions including, but not limited to, cash flow projections, market capitalization rates, discount rates and data regarding recent comparable sales of similar properties. Such assumptions are generally based on current market conditions and are subject to economic and market uncertainties.
The Company’s loans are typically collateralized by real estate directly or indirectly. As a result, the Company regularly evaluates the extent and impact of any credit deterioration associated with the performance and/or value of the underlying collateral property as well as the financial and operating capability of the borrower/sponsor on a loan-by-loan basis. Specifically, a property’s operating results and any cash reserves are analyzed and used to assess: (i) whether cash flow from operations is sufficient to cover the debt service requirements currently and into the future; (ii) the ability of the borrower to refinance the loan at maturity; and/or (iii) the property’s liquidation value. The Company also evaluates the financial wherewithal of any loan guarantors as well as the borrower’s competency in managing and operating the properties. In addition, the Company considers the overall economic environment, real estate sector, and geographic submarket in which the collateral property is located. Such impairment analyses are completed and reviewed by asset management and underwriting personnel, who utilize various data sources, including: (i) periodic financial data such as property occupancy, tenant profile, rental rates, operating expenses, the borrowers’ business plan, and capitalization and discount rates; (ii) site inspections; and (iii) current credit spreads and other market data and ultimately presented to management for approval.
When a debtor is experiencing financial difficulties and a loan is modified, the effect of the modification will be included in the Company’s assessment of the CECL allowance for loan losses. If the Company provides principal forgiveness, the amortized cost basis of the loan is written off against the allowance for loan losses. Generally, when modifying loans, the Company will seek to protect its position by requiring incremental pay downs, additional collateral or guarantees and, in some cases, lookback features or equity interests to offset concessions granted should conditions impacting the loan improve.
The Company designates a loan as a non-accrual loan generally when: (i) the principal or coupon interest components of loan payments become 90-days past due; or (ii) in the opinion of the Company, recovery of principal and coupon interest is doubtful. Interest income on non-accrual loans in which the Company reasonably expects a recovery of the loan’s outstanding principal balance is recognized when received in cash. Otherwise, income recognition will be suspended and any cash received will be applied as a reduction to the amortized cost basis. A non-accrual loan is returned to accrual status at such time as the loan becomes contractually current and future principal and coupon interest are reasonably assured to be received. A loan will be charged-off when management has determined principal and coupon interest is no longer realizable and deemed non-recoverable.
The CECL accounting estimate is subject to uncertainty as a result of changing macro-economic market conditions, as well as the vintage and location of the underlying assets as disclosed in Note 3, Mortgage Loan Receivables, to our consolidated financial statements included elsewhere in this Quarterly Report. The provision for loan losses for the three months ended March 31, 2025 and March 31, 2024 was $(0.1) million and $5.8 million, respectively.
The allowance for loan losses at March 31, 2025 and December 31, 2024 was $52.8 million and $52.8 million, respectively. The allowance includes $0.6 million and $0.5 million of reserves for unfunded commitments at March 31, 2025 and December 31, 2024, respectively. The estimate is sensitive to the assumptions used to represent future expected economic conditions.
Acquisition of Real Estate
We generally acquire real estate assets or land and development assets through purchases and may also acquire such assets through foreclosure or deed-in-lieu of foreclosure (collectively, “foreclosure”) in full or partial satisfaction of defaulted loans. Purchased properties are classified as real estate, net or land and development, net on our consolidated balance sheets. When we intend to hold, operate or develop the property for a period of at least 12 months, the asset is classified as real estate, net, and if the asset meets the held-for-sale criteria, the asset is classified as real estate held for sale. Upon purchase, the properties are recorded at cost. Foreclosed assets classified as real estate and land and development are initially recorded at their estimated fair value and assets classified as held for sale are recorded at their estimated fair value less costs to sell. The excess of the carrying value of the loan over these amounts is charged-off against the reserve for loan losses. In both cases, upon acquisition, tangible and intangible assets and liabilities acquired are recorded at their relative fair values.
Identified Intangible Assets and Liabilities
We record intangible assets and liabilities acquired at their relative fair values, and determine whether such intangible assets and liabilities have finite or indefinite lives. As of March 31, 2025 and December 31, 2024, all such acquired intangible assets and liabilities have finite lives. We review finite lived intangible assets for impairment whenever events or changes in circumstances indicate that their carrying amount may not be recoverable. If we determine the carrying value of an intangible asset is not recoverable, we will record an impairment charge to the extent its carrying value exceeds its estimated fair value. Impairments of intangibles are recorded in impairment of assets in our consolidated statements of income.
Impairment or Disposal of Long-lived Assets
Real estate assets to be disposed of are reported at the lower of their carrying amount or estimated fair value less costs to sell and are included in real estate held for sale on our consolidated balance sheets. The difference between the estimated fair value less costs to sell and the carrying value will be recorded as an impairment charge. Impairment for real estate assets are included in impairment of assets in our consolidated statements of operations. Once the asset is classified as held for sale, depreciation expense is no longer recorded.
We periodically review real estate to be held and used, and land and development assets for impairment in value, whenever events or changes in circumstances indicate that the carrying amount of such assets may not be recoverable. The asset’s value is impaired only if management’s estimate of the aggregate future cash flows (undiscounted and without interest charges) to be generated by the asset (taking into account the anticipated holding period of the asset) is less than the carrying value. Such estimate of cash flows considers factors such as expected future operating income, trends and prospects, as well as the effects of demand, competition and other economic factors. To the extent impairment has occurred, the loss will be measured as the excess of the carrying amount of the property over the fair value of the asset and reflected as an adjustment to the basis of the asset. Impairments of real estate and land and development assets are recorded in impairment of assets in our consolidated statements of operations.
There were no properties classified as held for sale as of March 31, 2025 or December 31, 2024. We did not record any impairments of real estate for the three months ended March 31, 2025 or March 31, 2024.
Fair Value of Assets and Liabilities
The degree of management judgment involved in determining the fair value of assets and liabilities is dependent upon the availability of quoted market prices or observable market parameters. For financial and nonfinancial assets and liabilities that trade actively and have quoted market prices or observable market parameters, there is minimal subjectivity involved in measuring fair value. When observable market prices and parameters are not fully available, management judgment is necessary to estimate fair value. In addition, changes in market conditions may reduce the availability of quoted prices or observable data. For example, reduced liquidity in the capital markets or changes in secondary market activities could result in observable market inputs becoming unavailable. Therefore, when market data is not available, we would use valuation techniques requiring more management judgment to estimate the appropriate fair value measurement.
Recently Adopted Accounting Pronouncements and Recent Accounting Pronouncements Pending Adoption
Our recently adopted accounting pronouncements and recent accounting pronouncements pending adoption are described in Note 2, Significant Accounting Policies, to our consolidated financial statements included elsewhere in this Quarterly Report.
Reconciliation of Non-GAAP Financial Measures
Distributable Earnings
The Company utilizes distributable earnings, a non-GAAP financial measure, as a supplemental measure of our operating performance. We believe distributable earnings assists investors in comparing our operating performance and our ability to pay dividends across reporting periods on a more relevant and consistent basis by excluding from GAAP measures certain non-cash expenses and unrealized results as well as eliminating timing differences related to conduit securitization gains and changes in the values of assets and derivatives. In addition, we use distributable earnings: (i) to evaluate our earnings from operations because management believes that it may be a useful performance measure; and (ii) because our board of directors considers distributable earnings in determining the amount of quarterly dividends. In addition, we believe it is useful to present distributable earnings prior to charge-offs of allowance for credit losses to reflect our direct operating results and help existing and potential future holders of our Class A common stock assess the performance of our business excluding such charge-offs. Distributable earnings prior to charge-offs of allowance for credit losses is used as an additional performance metric to consider when declaring our dividends.
We define distributable earnings as income before taxes adjusted for: (i) net (income) loss attributable to noncontrolling interests in consolidated ventures; (ii) our share of real estate depreciation, amortization and gain adjustments and (earnings) loss from investments in unconsolidated ventures in excess of distributions received; (iii) the impact of derivative gains and losses related to hedging fair value variability of fixed rate assets caused by interest rate fluctuations and overall portfolio market risk as of the end of the specified accounting period; (iv) economic gains or losses on loan sales, certain of which may not be recognized under GAAP accounting in consolidation for which risk has substantially transferred during the period, as well as the exclusion of the related GAAP economics in subsequent periods; (v) unrealized gains or losses related to our investments in securities recorded at fair value in current period earnings; (vi) unrealized and realized provision for loan losses and real estate impairment; (vii) non-cash stock-based compensation; and (viii) certain non-recurring transactional items.
We exclude the effects of our share of real estate depreciation and amortization. Given GAAP gains and losses on sales of real estate include the effects of previously-recognized real estate depreciation and amortization, our adjustment eliminates the portion of the GAAP gain or loss that is derived from depreciation and amortization.
As discussed in Note 2, Significant Accounting Policies, to our consolidated financial statements included elsewhere in this Quarterly Report, our derivative instruments do not qualify for hedge accounting under GAAP and, therefore, any net payments under, or fluctuations in the fair value of derivatives are recognized currently in our income statement. The Company utilizes derivative instruments to hedge exposure to interest rate risk associated with fixed rate mortgage loans, fixed rate securities, and/or overall portfolio market risks. Distributable earnings excludes the GAAP results from derivative activity until the associated mortgage loan or security for which the derivative position is hedging is sold or paid off, or the hedge position for overall portfolio market risk is closed, at which point any gain or loss is recognized in distributable earnings in that period. For derivative activity associated with securities or mortgage loans held for investment, any hedging gain or loss is amortized over the expected life of the underlying asset for distributable earnings. We believe that adjusting for these specifically identified gains and losses associated with hedging positions adjusts for timing differences between when we recognize the gains or losses associated with our assets and the gains and losses associated with derivatives used to hedge such assets.
We originate conduit loans, which are first mortgage loans on stabilized, income producing commercial real estate properties that we intend to sell into third-party CMBS securitizations. Mortgage loans receivable held for sale are recorded at the lower of cost or market under GAAP. For purposes of distributable earnings, we exclude the impact of unrealized lower of cost or market adjustments on conduit loans held for sale and include the realized gains or losses in distributable earnings in the period when the loan is sold. Our conduit business includes mortgage loans made to third parties and may also include mortgage loans secured by real estate owned in our real estate segment. Such mortgage loans receivable secured by real estate owned in our real estate segment are eliminated in consolidation within our GAAP financial statements until the loans are sold in a third-party securitization. Upon the sale of a loan to a third-party securitization trust (for cash), the related mortgage note payable is recognized on our GAAP financial statements. For purposes of distributable earnings, we include adjustments for economic gains and losses related to the sale of these inter-segment loans for which risk has substantially transferred during the period and exclude the resultant GAAP recognition of amortization of any related premium/discount on such mortgage loans payable recognized in interest expense during the subsequent periods. This adjustment is reflected in distributable earnings when there is a true risk transfer on the mortgage loan sale and settlement. Conversely, if the economic risk was not substantially transferred, no adjustments to net income would be made relating to those transactions for distributable earnings purposes. Management believes recognizing these amounts for distributable earnings purposes in the period of transfer of economic risk is a useful supplemental measure of our performance.
As more fully discussed in Note 2, Significant Accounting Policies, to our consolidated financial statements included elsewhere in this Quarterly Report, we invest in certain securities that are recorded at fair value with changes in fair value recorded in current period earnings. For purposes of distributable earnings, we exclude the impact of unrealized gains and losses associated with these securities and include realized gains or losses in connection with any disposition of securities. Distributable earnings includes declines in fair value deemed to be an impairment for GAAP purposes if the decline is determined to be non-recoverable and the loss to be nearly certain to be eventually realized. In those cases, an impairment is included in distributable earnings for the period in which such determination was made.
We include adjustments for unrealized and realized provision for loan losses and real estate impairment. For purposes of distributable earnings, management recognizes loan and real estate losses as being realized generally in the period in which the asset is sold or the Company determines a decline in value to be non-recoverable and the loss to be nearly certain.
Set forth below is an unaudited reconciliation of income (loss) before taxes to distributable earnings (in thousands):
| | | | | | | | | | | | | | | |
| Three Months Ended | | |
| March 31, | | December 31, | | | | |
| 2025 | | 2024 | | | | |
| Income (loss) before taxes | $ | 10,717 | | | $ | 33,040 | | | | | |
| Net (income) loss attributable to noncontrolling interests in consolidated ventures | 220 | | | 55 | | | | | |
| Our share of real estate depreciation, amortization and gain adjustments (1) | 4,503 | | | (2,225) | | | | | |
| Adjustments for derivative results and loan sale activity (2) | (435) | | | (474) | | | | | |
| Unrealized (gain) loss on fair value securities | (687) | | | 903 | | | | | |
| | | | | | | |
| Adjustment for impairment | (81) | | | 47 | | | | | |
| Non-cash stock-based compensation | 11,215 | | | 2,237 | | | | | |
| | | | | | | |
| | | | | | | |
| | | | | | | |
| | | | | | | |
| | | | | | | |
| Distributable earnings | $ | 25,452 | | | $ | 33,583 | | | | | |
| | | | | | | | | | | | | | | | | | |
| |
| | | | | | | | |
| (1) | The following is an unaudited reconciliation of GAAP depreciation and amortization to our share of real estate depreciation, amortization and gain adjustments and (earnings) loss from investment in unconsolidated ventures in excess of distributions received ($ in thousands): |
| | Three Months Ended | | |
| | March 31, | | December 31, | | | | |
| | 2025 | | 2024 | | | | |
| Total GAAP depreciation and amortization | $ | 7,336 | | | $ | 7,466 | | | | | |
| Depreciation and amortization related to non-rental property fixed assets | (108) | | | (110) | | | | | |
| Non-controlling interests in consolidated ventures’ share of depreciation and amortization | (119) | | | (115) | | | | | |
| Our share of operating lease income from above/below market lease intangible amortization | (402) | | | (413) | | | | | |
| Our share of real estate depreciation and amortization | 6,707 | | | 6,828 | | | | | |
| | | | | | | | |
| | | | | | | | |
| Accumulated depreciation and amortization on real estate sold (a) | (2,936) | | | (9,146) | | | | | |
| Adjustment for (earnings) loss from investments in unconsolidated ventures in excess of distributions received | 732 | | | 68 | | | | | |
| Our share of real estate depreciation, amortization and gain adjustments | $ | 4,503 | | | $ | (2,250) | | | | | |
| | | | | | | | |
| (a) GAAP gains/losses on sales of real estate include the effects of previously-recognized real estate depreciation and amortization. For purposes of distributable earnings, our share of real estate depreciation and amortization is eliminated and, accordingly, the resultant gains/losses also must be adjusted. The following is an unaudited reconciliation of the related consolidated GAAP amounts to the amounts reflected in distributable earnings ($ in thousands): |
| | Three Months Ended | | |
| | March 31, | | December 31, | | | | |
| | 2025 | | 2024 | | | | |
| GAAP realized gain/loss on sale of real estate, net | $ | 3,807 | | | $ | 12,419 | | | | | |
| Adjusted (gain)/loss on sale of real estate for purposes of distributable earnings | (871) | | | (3,298) | | | | | |
| Accumulated depreciation and amortization on real estate sold | $ | 2,936 | | | $ | 9,121 | | | | | |
| | | | | | | | |
| | | | | | | | | | | | | | | | | | |
| | | | | | | | |
| (2) | The following is an unaudited reconciliation of GAAP net results from derivative transactions to our adjustments for derivative results and loan sale activity within distributable earnings ($ in thousands): |
| | Three Months Ended | | |
| | March 31, | | December 31, | | | | |
| | 2025 | | 2024 | | | | |
| GAAP net results from derivative transactions | $ | (323) | | | $ | (1,549) | | | | | |
| | | | | | | | |
| Unrealized lower of cost or market adjustments related to loans held for sale | (162) | | | 608 | | | | | |
| Amortization of (premium)/discount on mortgage loan financing included in interest expense | (178) | | | (209) | | | | | |
| Recognized derivative results | 228 | | | 676 | | | | | |
| Adjustments for derivative results and loan sale activity | $ | (435) | | | $ | (474) | | | | | |
| | | | | | | | |
| |
| |
| | | | | |
Distributable earnings has limitations as an analytical tool. Some of these limitations are:
•Distributable earnings does not reflect the impact of certain cash charges resulting from matters we consider not to be indicative of our ongoing operations and is not necessarily indicative of cash necessary to fund cash needs; and
•Other companies in our industry may calculate distributable earnings differently than we do, limiting its usefulness as a comparative measure.
Because of these limitations, distributable earnings should not be considered in isolation or as a substitute for net income (loss) attributable to shareholders or any other performance measures calculated in accordance with GAAP. Our non-GAAP financial measures should not be considered an alternative to cash flows from operations as a measure of our liquidity.
In addition, distributable earnings should not be considered to be the equivalent to REIT taxable income calculated to determine the minimum amount of dividends the Company is required to distribute to shareholders to maintain REIT status. In order for the Company to maintain its qualification as a REIT under the Internal Revenue Code of 1986, as amended, we must annually distribute at least 90% of our REIT taxable income. The Company has declared, and intends to continue declaring, regular quarterly distributions to its shareholders in an amount approximating the REIT’s net taxable income.
In the future, we may incur gains and losses that are the same as or similar to some of the adjustments in this presentation. Our presentation of distributable earnings should not be construed as an inference that our future results will be unaffected by unusual or non-recurring items.
Item 3. Quantitative and Qualitative Disclosures about Market Risk
For a discussion of current market conditions, refer to “Management’s Discussion and Analysis of Financial Condition and Results of Operations."
Interest Rate Risk
The nature of the Company’s business exposes it to market risk arising from changes in interest rates. Changes, both increases and decreases, in the rates the Company is able to charge its borrowers, the yields the Company is able to achieve in its securities investments, and the Company’s cost of borrowing directly impacts its net income. The Company’s net interest income includes interest from both fixed and floating rate debt. The percentage of the Company’s assets and liabilities bearing interest at fixed and floating rates may change over time, and asset composition may differ materially from debt composition. Another component of interest rate risk is the effect changes in interest rates will have on the market value of the assets the Company acquires. The Company faces the risk that the market value of its assets will increase or decrease at different rates than that of its liabilities, including its hedging instruments. The Company mitigates interest rate risk through utilization of hedging instruments, primarily interest rate futures agreements. Interest rate futures agreements are utilized to hedge against future interest rate increases on the Company’s borrowings and potential adverse changes in the value of certain assets that result from interest rate changes. The Company generally seeks to hedge assets that have a duration longer than five years, including newly originated conduit first mortgage loans, most of its U.S. Agency securities portfolio, and other securities if long enough in duration.
The following table summarizes the change in net income for a 12-month period commencing March 31, 2025 and the change in fair value of our investments and indebtedness assuming an increase or decrease of 100 basis points in the relevant benchmark interest rates on March 31, 2025, both adjusted for the effects of our interest rate hedging activities ($ in thousands):
| | | | | | | | | | | |
| Projected change
in net income(1) | | Projected change
in portfolio
value |
| | | |
| Change in interest rate: | | | |
| Decrease by 1.00% | $ | (27,396) | | | $ | 8,146 | |
| Increase by 1.00% | 28,893 | | | (8,032) | |
(1) Subject to limits for floors on our floating rate investments and indebtedness.
Market Risk
As market volatility increases or liquidity decreases, the market value of the Company’s assets may be adversely impacted.
The Company’s securities investments are reflected at their estimated fair value. The change in estimated fair value of securities available-for-sale is reflected in accumulated other comprehensive income. The change in estimated fair value of Agency interest-only securities is recorded in current period earnings. The estimated fair value of these securities fluctuates primarily due to changes in interest rates and other factors. Generally, in a rising interest rate environment, the estimated fair value of these securities would be expected to decrease; conversely, in a decreasing interest rate environment, the estimated fair value of these securities would be expected to increase.
The Company’s fixed rate mortgage loan portfolio is subject to the same risks. However, to the extent those loans are classified as held for sale, they are reflected at the lower of cost or market. Otherwise, held for investment mortgage loans are reflected at values equal to the unpaid principal balances net of certain fees, costs and loan loss allowances.
Concentrations of market risk may exist with respect to the Company’s investments. Market risk is a potential loss the Company may incur as a result of change in the fair values of its investments. The Company may also be subject to risk associated with concentrations of investments in geographic regions and industries.
Liquidity Risk
Market disruptions may lead to a significant decline in transaction activity in all or a significant portion of the asset classes in which the Company invests and may at the same time lead to a significant contraction in short-term and long-term debt and equity funding sources. A decline in liquidity of real estate and real estate-related investments, as well as a lack of availability of observable transaction data and inputs, may make it more difficult to sell the Company’s investments or determine their fair
values. As a result, the Company may be unable to sell its investments, or only be able to sell its investments at a price that may be materially different from the fair values presented. Also, in such conditions, there is no guarantee that the Company’s borrowing arrangements or other arrangements for obtaining leverage will continue to be available or, if available, will be available on terms and conditions acceptable to the Company. In addition, a decline in market value of the Company’s assets may have particular adverse consequences in instances where it borrowed money based on the fair value of its assets. A decrease in the market value of the Company’s assets may result in the lender requiring it to post additional collateral or otherwise sell assets at a time when it may not be in the Company’s best interest to do so. The Company’s subsidiary, Tuebor Captive Insurance Company LLC (“Tuebor”), was previously a captive insurance company subject to state regulations, which required regulatory approval for dividend distributions, limiting the Company's ability to utilize cash held by Tuebor. Effective January 31, 2025, Tuebor is no longer licensed as a captive insurer and is no longer subject to state regulation.
Credit Risk
The Company is subject to varying degrees of credit risk in connection with its investments. The Company seeks to manage credit risk by performing deep credit fundamental analyses of potential assets and through ongoing asset management. The Company’s investment guidelines do not limit the amount of its equity that may be invested in any type of its assets; however, investments greater than a certain size are subject to approval by the Risk and Underwriting Committee of the board of directors.
Our portfolio’s low weighted average loan-to-value, based on the loan balances and the “as-is” third-party Financial Institutions Reform, Recovery and Enforcement Act of 1989 (“FIRREA”) appraised values at origination, of 66.5% as of March 31, 2025 reflects significant equity value that our sponsors are motivated to protect through periods of cyclical disruption. While we believe the principal amounts of our loans are generally adequately protected by underlying collateral value, there is a risk that we will not realize the entire principal value of certain investments.
Credit Spread Risk
Credit spread risk is the risk that interest rate spreads between two different financial instruments will change. In general, fixed-rate commercial mortgages and CMBS are priced based on a spread to Treasury or interest rate swaps. The Company generally benefits if credit spreads narrow during the time that it holds a portfolio of mortgage loans or CMBS investments, and the Company may experience losses if credit spreads widen during the time that it holds a portfolio of mortgage loans or CMBS investments. The Company actively monitors its exposure to changes in credit spreads and the Company may enter into credit total return swaps or take positions in other credit-related derivative instruments to moderate its exposure against losses associated with a widening of credit spreads.
Risks Related to Real Estate
Real estate and real estate-related assets, including loans and commercial real estate-related securities, are subject to volatility and may be affected adversely by a number of factors, including, but not limited to, national, regional and local economic conditions (which may be adversely affected by industry slowdowns, economic downturns and other factors); local real estate conditions; changes or continued weakness in specific industry segments; construction quality, age and design; demographic factors; environmental conditions; competition from comparable property types or properties; changes in tenant mix or performance and retroactive changes to building or similar codes and rent regulations. In addition, decreases in property values reduce the value of the collateral and the potential proceeds available to a borrower to repay the underlying loans, which could also cause the Company to suffer losses.
Covenant Risk
In the normal course of business, the Company enters into loan and securities repurchase agreements and credit facilities with certain lenders to finance its real estate investment transactions. These agreements contain, among other conditions, events of default and various covenants and representations. If such events are not cured by the Company or waived by the lenders, the lenders may decide to curtail or limit extension of credit, and the Company may be forced to repay its advances or loans. In addition, the Company’s Notes are subject to covenants, including maintenance of unencumbered assets, limitations on the incurrence of additional debt, restricted payments, liens, sales of assets, affiliate transactions and other covenants typical for financings of this type. The Company’s failure to comply with these covenants could result in an event of default, which could result in the Company being required to repay these borrowings before their due date.
We were in compliance with all covenants as described in this Quarterly Report as of March 31, 2025.
Diversification Risk
The Company’s investments include mortgage loan receivables collateralized by commercial real estate, owned real estate and real estate backed securities. The Company’s mortgage loan investments are primarily middle market focused, spread across geographically diverse regions within the United States, and granular in nature with an average loan balance of approximately $25 million to $30 million. The primary assets of the Company are therefore concentrated in the commercial real estate sector, and accordingly, the investment portfolio of the Company may be subject to more rapid change in value than would be the case if the Company were to maintain a wide diversification among investments or industry sectors. Furthermore, even within the commercial real estate sector, the investment portfolio may be relatively concentrated in terms of geography and type of real estate investment. This lack of diversification may subject the investments of the Company to more rapid change in value than would be the case if the assets of the Company were more widely diversified.
Regulatory Risk
Effective January 31, 2025, the Company’s subsidiary, Tuebor, is no longer licensed as a captive insurer and is no longer subject to state regulation.
Effective as of July 16, 2021, LCAM is a registered investment adviser under the Investment Advisors Act of 1940, as amended and currently provides investment advisory services solely to Ladder-sponsored collateralized loan obligation trusts (“CLO Issuers”). The CLO Issuers invest primarily in first mortgage loans secured by commercial real estate originated or acquired by Ladder and in participation interests in such loans. LCAM is entitled to receive a management fee connection with the advisory, administrative and monitoring services it performs for the CLO Issuer as the collateral manager; however, LCAM has waived this fee for so long as it or any of its affiliates serves as collateral manager for the CLO Issuers.
A registered investment adviser is subject to U.S. federal and state laws and regulations primarily intended to benefit its clients. These laws and regulations include requirements relating to, among other things, fiduciary duties to clients, maintaining an effective compliance program, solicitation agreements, conflicts of interest, record keeping and reporting requirements, disclosure requirements, custody arrangements, limitations on agency cross and principal transactions between an investment adviser and its advisory clients and general anti-fraud prohibitions. In addition, these laws and regulations generally grant supervisory agencies and bodies broad administrative powers, including the power to limit or restrict us from conducting our advisory activities in the event we fail to comply with those laws and regulations. Sanctions that may be imposed for a failure to comply with applicable legal requirements include the suspension of individual employees, limitations on our engaging in various advisory activities for specified periods of time, disgorgement, the revocation of registrations, and other censures and fines.
We may become subject to additional regulatory and compliance burdens if our investment adviser subsidiary expands its product offerings and investment platform.
Item 4. Controls and Procedures
Disclosure Controls and Procedures
The Company’s management, with the participation of the Chief Executive Officer and the Chief Financial Officer, conducted an evaluation of the effectiveness of the design and operation of our disclosure controls and procedures as required by Rules 13a-15 and 15d-15 under the Exchange Act as of March 31, 2025. Based upon that evaluation, the Chief Executive Officer and Chief Financial Officer have concluded that our disclosure controls and procedures were effective, as of March 31, 2025, to provide reasonable assurance that information required to be disclosed by us in reports that we file or submit under the Exchange Act is recorded, processed, summarized and reported within the time periods specified in the applicable rules and forms, and that it is accumulated and communicated to our management, including our Chief Executive Officer and Chief Financial Officer, as appropriate to allow timely decisions regarding required disclosure. A control system, no matter how well conceived and operated, can provide only reasonable, not absolute, assurance that the objectives of the control system are met. Further, the design of a control system must reflect the fact that there are resource constraints and the benefits of controls must be considered relative to their costs. Due to the inherent limitations in all control systems, no evaluation of controls can provide absolute assurance that all control issues and instances of fraud, if any, have been detected.
Changes in Internal Control Over Financial Reporting
There were no changes in our internal control over financial reporting (as defined in Rule 13a-15(f) under the Exchange Act) during the quarter ended March 31, 2025 that have materially affected, or are reasonably likely to materially affect, our internal control over financial reporting.
Part II
Item 1. Legal Proceedings
From time to time, we may be involved in litigation and claims incidental to the conduct of our business in the ordinary course. Further, certain of our subsidiaries, such as our registered investment adviser, are subject to scrutiny by government regulators, which could result in enforcement proceedings or litigation related to regulatory compliance matters. We are not presently a party to any material enforcement proceedings, litigation related to regulatory compliance matters or any other type of material litigation matters. We maintain insurance policies in amounts and with the coverage and deductibles we believe are adequate, based on the nature and risks of our business, historical experience and industry standards.
Item 1A. Risk Factors
There have been no material changes during the three months ended March 31, 2025 to the risk factors in Item 1A in our Annual Report.
Item 2. Unregistered Sales of Equity Securities and Use of Proceeds
a) Sales of Unregistered Securities
None.
c) Issuer Purchases of Equity Securities
The following table summarizes the share repurchase activity for the three months ended March 31, 2025 ($ in thousands, except per share data and average price paid per share):
| | | | | | | | | | | | | | |
| Period | Total Number of Shares Purchased | Average Price Paid per Share | Total Number of Shares Purchased as Part of Publicly Announced Plans or Programs (1) | Approximate Dollar Value of Shares that May Yet Be Purchased Under the Plans or Programs (1) |
| January 1, 2025 - January 31, 2025 | — | | — | | — | | 67,604 | |
| February 1, 2025 - February 28, 2025 | — | | — | | — | | 67,604 | |
| March 1, 2025 - March 31, 2025 | 70,506 | | 11.42 | | 70,506 | | 66,799 | |
| Total (2) | 70,506 | | $ | 11.42 | | 70,506 | | $ | 66,799 | |
(1)On July 27, 2022, the Board authorized repurchases up to $50.0 million in aggregate. On April 24, 2024, the board of directors authorized the repurchase of $75.0 million of the Company’s Class A common stock from time to time without further approval. This authorization increased the remaining outstanding authorization per the July 27, 2022 authorization from $43.6 million to $75.0 million.
(2)Subsequent to quarter end, on April 23, 2025, the board of directors authorized the repurchase of $100.0 million of the Company’s Class A common stock from time to time without further approval. This authorization increased the remaining outstanding authorization per the April 24, 2024 authorization from $66.8 million to $100.0 million.
Item 3. Defaults Upon Senior Securities
None.
Item 4. Mine Safety Disclosures
Not applicable.
Item 5. Other Information
During the three months ended March 31, 2025, no director or officer of the Company adopted or terminated a "Rule 10b5-1 trading arrangement" or "non-Rule 10b5-1 trading arrangement," as each term is defined in Item 408(a) of Regulation S-K.
Item 6. Exhibits
| | | | | | | | |
| EXHIBIT INDEX |
| | |
EXHIBIT
NO. | | DESCRIPTION |
| | |
| | |
| | |
| | |
| | |
| | |
| | |
| | |
| | |
| | |
| | |
| | |
| | |
| | |
| | |
| 101 | | 101.SCH* iXBRL Schema Document.
101.CAL* iXBRL Calculation Linkbase Document.
101.DEF* iXBRL Definition Linkbase Document.
101.LAB* iXBRL Label Linkbase Document.
101.PRE* iXBRL Presentation Linkbase Document. |
| 104 | | Cover Page Interactive Data File (formatted in inline XBRL and contained in Exhibit 101) |
* The certifications attached hereto as Exhibits 32.1 and 32.2 are furnished to the SEC pursuant to Section 906 of the Sarbanes-Oxley Act of 2002 and shall not be deemed “filed” for purposes of Section 18 of the Exchange Act, nor shall they be deemed incorporated by reference in any filing under the Securities Act, except as shall be expressly set forth by specific reference in such filing.
SIGNATURES
Pursuant to the requirements of the Securities Exchange Act of 1934, the Registrant has duly caused this report to be signed on its behalf by the undersigned, thereunto duly authorized.
| | | | | | | | | | | |
| | | LADDER CAPITAL CORP |
| | | (Registrant) |
| | |
| | |
| Date: April 25, 2025 | | By: | /s/ BRIAN HARRIS |
| | | | Brian Harris |
| | | | Chief Executive Officer |
| | |
| Date: April 25, 2025 | | By: | /s/ PAUL J. MICELI |
| | | | Paul J. Miceli |
| | | | Chief Financial Officer |