false2024FY00016908200.80.80.80.8P2YP4Y0.800.80P1YP2YP4Yhttp://fasb.org/us-gaap/2024#NotesPayableCurrent393748748458iso4217:USDxbrli:sharesiso4217:USDxbrli:sharescvna:classxbrli:purecvna:segmentcvna:siteutr:sqftutr:acrecvna:centercvna:renewal_optioncvna:aircraftcvna:agreement_typecvna:votecvna:milecvna:casecvna:tranchecvna:interestRateCap00016908202024-01-012024-12-310001690820us-gaap:CommonStockMember2024-01-012024-12-3100016908202024-06-300001690820us-gaap:CommonClassAMember2025-02-140001690820us-gaap:CommonClassBMember2025-02-1400016908202024-12-3100016908202023-12-310001690820us-gaap:RelatedPartyMember2024-12-310001690820us-gaap:RelatedPartyMember2023-12-310001690820us-gaap:CommonClassAMember2023-12-310001690820us-gaap:CommonClassAMember2024-12-310001690820us-gaap:CommonClassBMember2024-12-310001690820us-gaap:CommonClassBMember2023-12-310001690820cvna:UsedVehicleSalesMember2024-01-012024-12-310001690820cvna:UsedVehicleSalesMember2023-01-012023-12-310001690820cvna:UsedVehicleSalesMember2022-01-012022-12-310001690820us-gaap:RelatedPartyMembercvna:WholesaleSalesAndRevenuesMember2024-01-012024-12-310001690820us-gaap:RelatedPartyMembercvna:WholesaleSalesAndRevenuesMember2023-01-012023-12-310001690820us-gaap:RelatedPartyMembercvna:WholesaleSalesAndRevenuesMember2022-01-012022-12-310001690820cvna:WholesaleSalesAndRevenuesMember2024-01-012024-12-310001690820cvna:WholesaleSalesAndRevenuesMember2023-01-012023-12-310001690820cvna:WholesaleSalesAndRevenuesMember2022-01-012022-12-310001690820us-gaap:RelatedPartyMemberus-gaap:ProductAndServiceOtherMember2024-01-012024-12-310001690820us-gaap:RelatedPartyMemberus-gaap:ProductAndServiceOtherMember2023-01-012023-12-310001690820us-gaap:RelatedPartyMemberus-gaap:ProductAndServiceOtherMember2022-01-012022-12-310001690820us-gaap:ProductAndServiceOtherMember2024-01-012024-12-310001690820us-gaap:ProductAndServiceOtherMember2023-01-012023-12-310001690820us-gaap:ProductAndServiceOtherMember2022-01-012022-12-3100016908202023-01-012023-12-3100016908202022-01-012022-12-310001690820us-gaap:RelatedPartyMember2024-01-012024-12-310001690820us-gaap:RelatedPartyMember2023-01-012023-12-310001690820us-gaap:RelatedPartyMember2022-01-012022-12-310001690820us-gaap:CommonStockMemberus-gaap:CommonClassAMember2021-12-310001690820us-gaap:CommonStockMemberus-gaap:CommonClassBMember2021-12-310001690820us-gaap:AdditionalPaidInCapitalMember2021-12-310001690820us-gaap:RetainedEarningsMember2021-12-310001690820us-gaap:NoncontrollingInterestMember2021-12-3100016908202021-12-310001690820us-gaap:RetainedEarningsMember2022-01-012022-12-310001690820us-gaap:NoncontrollingInterestMember2022-01-012022-12-310001690820us-gaap:CommonStockMemberus-gaap:CommonClassAMembercvna:FollowOnPublicOfferingMember2022-01-012022-12-310001690820us-gaap:AdditionalPaidInCapitalMembercvna:FollowOnPublicOfferingMember2022-01-012022-12-310001690820cvna:FollowOnPublicOfferingMember2022-01-012022-12-310001690820us-gaap:AdditionalPaidInCapitalMember2022-01-012022-12-310001690820us-gaap:CommonStockMemberus-gaap:CommonClassAMember2022-01-012022-12-310001690820us-gaap:AdditionalPaidInCapitalMembercvna:CarvanaGroupMember2022-01-012022-12-310001690820cvna:CarvanaGroupMember2022-01-012022-12-310001690820us-gaap:CommonStockMemberus-gaap:CommonClassAMember2022-12-310001690820us-gaap:CommonStockMemberus-gaap:CommonClassBMember2022-12-310001690820us-gaap:AdditionalPaidInCapitalMember2022-12-310001690820us-gaap:RetainedEarningsMember2022-12-310001690820us-gaap:NoncontrollingInterestMember2022-12-3100016908202022-12-310001690820us-gaap:RetainedEarningsMember2023-01-012023-12-310001690820us-gaap:NoncontrollingInterestMember2023-01-012023-12-310001690820us-gaap:CommonStockMemberus-gaap:CommonClassAMembercvna:FollowOnPublicOfferingMember2023-01-012023-12-310001690820us-gaap:AdditionalPaidInCapitalMembercvna:FollowOnPublicOfferingMember2023-01-012023-12-310001690820cvna:FollowOnPublicOfferingMember2023-01-012023-12-310001690820us-gaap:CommonStockMembercvna:ClassBCommonStockLLCUnitsMember2023-01-012023-12-310001690820us-gaap:NoncontrollingInterestMembercvna:ClassBCommonStockLLCUnitsMember2023-01-012023-12-310001690820cvna:ClassBCommonStockLLCUnitsMember2023-01-012023-12-310001690820us-gaap:AdditionalPaidInCapitalMember2023-01-012023-12-310001690820us-gaap:CommonStockMemberus-gaap:CommonClassAMember2023-01-012023-12-310001690820us-gaap:CommonStockMemberus-gaap:CommonClassBMember2023-01-012023-12-310001690820us-gaap:CommonStockMemberus-gaap:CommonClassAMember2023-12-310001690820us-gaap:CommonStockMemberus-gaap:CommonClassBMember2023-12-310001690820us-gaap:AdditionalPaidInCapitalMember2023-12-310001690820us-gaap:RetainedEarningsMember2023-12-310001690820us-gaap:NoncontrollingInterestMember2023-12-310001690820us-gaap:RetainedEarningsMember2024-01-012024-12-310001690820us-gaap:NoncontrollingInterestMember2024-01-012024-12-310001690820us-gaap:CommonStockMemberus-gaap:CommonClassAMembercvna:FollowOnPublicOfferingMember2024-01-012024-12-310001690820us-gaap:AdditionalPaidInCapitalMembercvna:FollowOnPublicOfferingMember2024-01-012024-12-310001690820cvna:FollowOnPublicOfferingMember2024-01-012024-12-310001690820us-gaap:AdditionalPaidInCapitalMember2024-01-012024-12-310001690820us-gaap:CommonStockMemberus-gaap:CommonClassAMember2024-01-012024-12-310001690820us-gaap:CommonStockMemberus-gaap:CommonClassBMember2024-01-012024-12-310001690820us-gaap:AdditionalPaidInCapitalMembercvna:CarvanaGroupMember2024-01-012024-12-310001690820cvna:CarvanaGroupMember2024-01-012024-12-310001690820us-gaap:CommonStockMemberus-gaap:CommonClassAMember2024-12-310001690820us-gaap:CommonStockMemberus-gaap:CommonClassBMember2024-12-310001690820us-gaap:AdditionalPaidInCapitalMember2024-12-310001690820us-gaap:RetainedEarningsMember2024-12-310001690820us-gaap:NoncontrollingInterestMember2024-12-310001690820cvna:CarvanaGroupMember2024-12-310001690820cvna:A2028SeniorSecuredNotesMemberus-gaap:SeniorNotesMember2024-01-012024-12-310001690820cvna:AtTheMarketOfferingATMOfferingMember2024-01-012024-12-310001690820cvna:PurchaseAndSaleAgreementMemberus-gaap:SubsequentEventMemberus-gaap:ConsumerLoanMember2025-01-030001690820srt:MinimumMemberus-gaap:BuildingAndBuildingImprovementsMember2024-12-310001690820srt:MaximumMemberus-gaap:BuildingAndBuildingImprovementsMember2024-12-310001690820srt:MinimumMemberus-gaap:TransportationEquipmentMember2024-12-310001690820us-gaap:SoftwareAndSoftwareDevelopmentCostsMember2024-12-310001690820srt:MinimumMemberus-gaap:FurnitureAndFixturesMember2024-12-310001690820srt:MaximumMemberus-gaap:FurnitureAndFixturesMember2024-12-310001690820us-gaap:RelatedPartyMembercvna:DriveTimeAutomotiveGroupInc.Membercvna:MasterDealerAgreementMember2023-12-310001690820us-gaap:RelatedPartyMembercvna:DriveTimeAutomotiveGroupInc.Membercvna:MasterDealerAgreementMember2024-12-310001690820us-gaap:ShippingAndHandlingMember2024-01-012024-12-310001690820us-gaap:ShippingAndHandlingMember2023-01-012023-12-310001690820us-gaap:ShippingAndHandlingMember2022-01-012022-12-3100016908202022-01-012022-01-010001690820cvna:ReportableSegmentMember2024-01-012024-12-310001690820cvna:ReportableSegmentMember2023-01-012023-12-310001690820cvna:ReportableSegmentMember2022-01-012022-12-310001690820cvna:ADESAUSPhysicalAuctionAcquisitionMember2022-05-090001690820cvna:ADESAUSPhysicalAuctionAcquisitionMember2022-05-092022-05-0900016908202022-05-090001690820cvna:ADESAUSPhysicalAuctionAcquisitionMemberus-gaap:CustomerRelationshipsMember2022-12-310001690820cvna:ADESAUSPhysicalAuctionAcquisitionMemberus-gaap:CustomerRelationshipsMember2022-01-012022-12-310001690820cvna:ADESAUSPhysicalAuctionAcquisitionMemberus-gaap:DevelopedTechnologyRightsMember2022-12-310001690820cvna:ADESAUSPhysicalAuctionAcquisitionMemberus-gaap:DevelopedTechnologyRightsMember2022-01-012022-12-310001690820cvna:ADESAUSPhysicalAuctionAcquisitionMember2024-01-012024-12-310001690820cvna:ADESAUSPhysicalAuctionAcquisitionMembercvna:WholesaleSalesAndRevenuesMember2023-01-012023-12-310001690820cvna:ADESAUSPhysicalAuctionAcquisitionMembercvna:WholesaleSalesAndRevenuesMember2022-01-012022-12-310001690820cvna:ADESAUSPhysicalAuctionAcquisitionMember2023-01-012023-12-310001690820cvna:ADESAUSPhysicalAuctionAcquisitionMember2022-01-012022-12-310001690820us-gaap:LandAndLandImprovementsMember2024-12-310001690820us-gaap:LandAndLandImprovementsMember2023-12-310001690820us-gaap:BuildingAndBuildingImprovementsMember2024-12-310001690820us-gaap:BuildingAndBuildingImprovementsMember2023-12-310001690820us-gaap:TransportationEquipmentMember2024-12-310001690820us-gaap:TransportationEquipmentMember2023-12-310001690820us-gaap:SoftwareAndSoftwareDevelopmentCostsMember2023-12-310001690820us-gaap:FurnitureAndFixturesMember2024-12-310001690820us-gaap:FurnitureAndFixturesMember2023-12-310001690820cvna:ExcludingConstructionInProgressMember2024-12-310001690820cvna:ExcludingConstructionInProgressMember2023-12-310001690820us-gaap:ConstructionInProgressMember2024-12-310001690820us-gaap:ConstructionInProgressMember2023-12-310001690820us-gaap:CostOfSalesMemberus-gaap:PropertyPlantAndEquipmentMember2024-01-012024-12-310001690820us-gaap:CostOfSalesMemberus-gaap:PropertyPlantAndEquipmentMember2023-01-012023-12-310001690820us-gaap:CostOfSalesMemberus-gaap:PropertyPlantAndEquipmentMember2022-01-012022-12-310001690820us-gaap:SellingGeneralAndAdministrativeExpensesMemberus-gaap:PropertyPlantAndEquipmentMember2024-01-012024-12-310001690820us-gaap:SellingGeneralAndAdministrativeExpensesMemberus-gaap:PropertyPlantAndEquipmentMember2023-01-012023-12-310001690820us-gaap:SellingGeneralAndAdministrativeExpensesMemberus-gaap:PropertyPlantAndEquipmentMember2022-01-012022-12-310001690820us-gaap:CustomerRelationshipsMember2024-12-310001690820us-gaap:CustomerRelationshipsMember2023-12-310001690820us-gaap:DevelopedTechnologyRightsMember2024-12-310001690820us-gaap:DevelopedTechnologyRightsMember2023-12-3100016908202014-11-300001690820us-gaap:RelatedPartyMembercvna:BlueMoundTexasDelancoNewJerseyMembercvna:DriveTimeAutomotiveGroupInc.Memberus-gaap:BuildingMembercvna:LeaseAgreementForFullyOperationalInspectionAndReconditioningCenterMember2014-11-012014-11-300001690820us-gaap:RelatedPartyMembercvna:BlueMoundTexasDelancoNewJerseyMembercvna:DriveTimeAutomotiveGroupInc.Memberus-gaap:BuildingMembercvna:LeaseAgreementForFullyOperationalInspectionAndReconditioningCenterMember2014-11-300001690820us-gaap:RelatedPartyMembercvna:WinderGeorgiaMembercvna:DriveTimeAutomotiveGroupInc.Memberus-gaap:BuildingMembercvna:LeaseAgreementForFullyOperationalInspectionAndReconditioningCenterMember2017-02-012017-02-280001690820us-gaap:RelatedPartyMembercvna:WinderGeorgiaMembercvna:DriveTimeAutomotiveGroupInc.Memberus-gaap:BuildingMembercvna:LeaseAgreementForFullyOperationalInspectionAndReconditioningCenterMember2017-02-280001690820us-gaap:RelatedPartyMembercvna:VerdeInvestmentsInc.andDriveTimeAutomotiveGroupInc.Membercvna:LeaseAgreementForFullyOperationalInspectionAndReconditioningCenterMember2024-01-012024-12-310001690820us-gaap:RelatedPartyMembercvna:VerdeInvestmentsInc.andDriveTimeAutomotiveGroupInc.Membercvna:LeaseAgreementForFullyOperationalInspectionAndReconditioningCenterMember2023-01-012023-12-310001690820us-gaap:RelatedPartyMembercvna:VerdeInvestmentsInc.andDriveTimeAutomotiveGroupInc.Membercvna:LeaseAgreementForFullyOperationalInspectionAndReconditioningCenterMember2022-01-012022-12-310001690820us-gaap:RelatedPartyMembercvna:DriveTimeAutomotiveGroupInc.Membercvna:CorporateHeadquartersOfficeLeaseAndSubleasedOfficeSpaceFirstFloorMember2016-09-300001690820us-gaap:RelatedPartyMembercvna:DriveTimeAutomotiveGroupInc.Membercvna:CorporateHeadquartersOfficeLeaseAndSubleasedOfficeSpaceFirstFloorMember2016-09-012016-09-300001690820us-gaap:RelatedPartyMembercvna:DriveTimeAutomotiveGroupInc.Membercvna:SubleasedOfficeSpaceFirstFloorMember2024-01-012024-12-310001690820us-gaap:RelatedPartyMembercvna:DriveTimeAutomotiveGroupInc.Membercvna:SubleasedOfficeSpaceFirstFloorMember2023-01-012023-12-310001690820us-gaap:RelatedPartyMembercvna:DriveTimeAutomotiveGroupInc.Membercvna:SubleasedOfficeSpaceFirstFloorMember2022-01-012022-12-310001690820cvna:TempeArizonaMemberus-gaap:RelatedPartyMembercvna:VerdeInvestmentsInc.Membercvna:OfficeBuildingLeaseMember2019-12-310001690820cvna:TempeArizonaMemberus-gaap:RelatedPartyMembercvna:VerdeInvestmentsInc.Membercvna:OfficeBuildingLeaseMember2019-12-012019-12-310001690820cvna:TempeArizonaMemberus-gaap:RelatedPartyMembercvna:VerdeInvestmentsInc.Membercvna:OfficeBuildingLeaseMember2024-01-012024-12-310001690820cvna:TempeArizonaMemberus-gaap:RelatedPartyMembercvna:VerdeInvestmentsInc.Membercvna:OfficeBuildingLeaseMember2023-01-012023-12-310001690820cvna:TempeArizonaMemberus-gaap:RelatedPartyMembercvna:VerdeInvestmentsInc.Membercvna:OfficeBuildingLeaseMember2022-01-012022-12-310001690820us-gaap:RelatedPartyMembercvna:DriveTimeAutomotiveGroupInc.Membercvna:WholesaleSalesAndRevenuesMember2024-01-012024-12-310001690820us-gaap:RelatedPartyMembercvna:DriveTimeAutomotiveGroupInc.Membercvna:WholesaleSalesAndRevenuesMember2023-01-012023-12-310001690820us-gaap:RelatedPartyMembercvna:DriveTimeAutomotiveGroupInc.Membercvna:WholesaleSalesAndRevenuesMember2022-01-012022-12-310001690820us-gaap:RelatedPartyMembercvna:DriveTimeAutomotiveGroupInc.Membercvna:WholesaleMarketplaceRevenuesMember2024-01-012024-12-310001690820us-gaap:RelatedPartyMembercvna:DriveTimeAutomotiveGroupInc.Membercvna:WholesaleMarketplaceRevenuesMember2023-01-012023-12-310001690820us-gaap:RelatedPartyMembercvna:DriveTimeAutomotiveGroupInc.Membercvna:WholesaleMarketplaceRevenuesMember2022-01-012022-12-310001690820us-gaap:RelatedPartyMembercvna:DriveTimeAutomotiveGroupInc.Membercvna:UsedVehiclesMember2024-12-310001690820us-gaap:RelatedPartyMembercvna:DriveTimeAutomotiveGroupInc.Membercvna:UsedVehiclesMember2023-12-310001690820us-gaap:RelatedPartyMembercvna:DriveTimeAutomotiveGroupInc.Membercvna:UsedVehicleSalesMember2024-01-012024-12-310001690820us-gaap:RelatedPartyMembercvna:DriveTimeAutomotiveGroupInc.Membercvna:UsedVehicleSalesMember2023-01-012023-12-310001690820us-gaap:RelatedPartyMembercvna:DriveTimeAutomotiveGroupInc.Membercvna:UsedVehicleSalesMember2022-01-012022-12-310001690820us-gaap:RelatedPartyMembercvna:DriveTimeAutomotiveGroupInc.Membercvna:MasterDealerAgreementMember2024-01-012024-12-310001690820us-gaap:RelatedPartyMembercvna:DriveTimeAutomotiveGroupInc.Membercvna:MasterDealerAgreementMember2023-01-012023-12-310001690820us-gaap:RelatedPartyMembercvna:DriveTimeAutomotiveGroupInc.Membercvna:MasterDealerAgreementMember2022-01-012022-12-310001690820us-gaap:RelatedPartyMembercvna:DriveTimeAutomotiveGroupInc.Memberus-gaap:ProductAndServiceOtherMember2024-01-012024-12-310001690820us-gaap:RelatedPartyMembercvna:DriveTimeAutomotiveGroupInc.Memberus-gaap:ProductAndServiceOtherMember2023-01-012023-12-310001690820us-gaap:RelatedPartyMembercvna:DriveTimeAutomotiveGroupInc.Memberus-gaap:ProductAndServiceOtherMember2022-01-012022-12-310001690820us-gaap:RelatedPartyMembercvna:DriveTimeAutomotiveGroupInc.Membercvna:ServicingandAdministrativeFeesMember2024-01-012024-12-310001690820us-gaap:RelatedPartyMembercvna:DriveTimeAutomotiveGroupInc.Membercvna:ServicingandAdministrativeFeesMember2023-01-012023-12-310001690820us-gaap:RelatedPartyMembercvna:DriveTimeAutomotiveGroupInc.Membercvna:ServicingandAdministrativeFeesMember2022-01-012022-12-310001690820cvna:VerdeInvestmentsInc.Memberus-gaap:RelatedPartyMemberus-gaap:AirTransportationEquipmentMembercvna:AircraftTimeSharingAgreementMember2015-10-220001690820cvna:VerdeInvestmentsInc.Memberus-gaap:RelatedPartyMemberus-gaap:AirTransportationEquipmentMembercvna:AircraftTimeSharingAgreementAmended2017Member2018-12-310001690820cvna:VerdeInvestmentsInc.Memberus-gaap:RelatedPartyMemberus-gaap:AirTransportationEquipmentMembercvna:AircraftTimeSharingAgreementMember2015-10-222015-10-220001690820cvna:VerdeInvestmentsInc.Memberus-gaap:RelatedPartyMemberus-gaap:AirTransportationEquipmentMembercvna:AircraftTimeSharingAgreementMember2023-01-012023-12-310001690820cvna:VerdeInvestmentsInc.Memberus-gaap:RelatedPartyMemberus-gaap:AirTransportationEquipmentMembercvna:AircraftTimeSharingAgreementMember2022-01-012022-12-310001690820cvna:VerdeInvestmentsInc.Memberus-gaap:RelatedPartyMemberus-gaap:AirTransportationEquipmentMembercvna:AircraftTimeSharingAgreementMember2024-01-012024-12-310001690820srt:ChiefExecutiveOfficerMemberus-gaap:RelatedPartyMemberus-gaap:CommonClassAMembercvna:ContributionAgreementMember2022-01-052022-01-050001690820srt:ChiefExecutiveOfficerMemberus-gaap:RelatedPartyMembercvna:ContributionAgreementMember2022-01-052022-01-050001690820us-gaap:RestrictedStockUnitsRSUMembersrt:ChiefExecutiveOfficerMemberus-gaap:RelatedPartyMembercvna:ContributionAgreementMember2022-01-012022-03-310001690820us-gaap:RestrictedStockUnitsRSUMembersrt:ChiefExecutiveOfficerMemberus-gaap:RelatedPartyMembercvna:ContributionAgreementMember2022-01-052022-01-050001690820us-gaap:RestrictedStockUnitsRSUMemberus-gaap:RelatedPartyMembercvna:ContributionAgreementMember2022-02-222022-02-220001690820us-gaap:RestrictedStockUnitsRSUMembersrt:ChiefExecutiveOfficerMemberus-gaap:RelatedPartyMembercvna:ContributionAgreementMember2024-01-012024-12-310001690820us-gaap:RestrictedStockUnitsRSUMembersrt:ChiefExecutiveOfficerMemberus-gaap:RelatedPartyMembercvna:ContributionAgreementMember2023-01-012023-12-310001690820us-gaap:RelatedPartyMembercvna:ConditionalSaleOfEquityToRelatedPartyMember2023-07-172023-07-170001690820us-gaap:RelatedPartyMembercvna:ClassALLCUnitsMember2023-08-182023-08-180001690820us-gaap:RelatedPartyMemberus-gaap:CommonClassBMember2023-08-182023-08-180001690820us-gaap:RelatedPartyMemberus-gaap:CommonClassAMember2023-08-180001690820us-gaap:RelatedPartyMembercvna:ClassALLCUnitsMember2023-08-180001690820cvna:PurchaseAndSaleAgreementMemberus-gaap:ConsumerLoanMember2024-01-110001690820cvna:PurchaseAndSaleAgreementMemberus-gaap:ConsumerLoanMember2024-12-310001690820cvna:PurchaseAndSaleAgreementMemberus-gaap:ConsumerLoanMember2023-12-310001690820cvna:PurchaseAndSaleAgreementMemberus-gaap:ConsumerLoanMember2022-12-310001690820cvna:SecuritizationTransactionMember2024-12-310001690820cvna:SecuritizationTransactionMember2023-12-310001690820cvna:SecuritizationTransactionMember2022-12-310001690820cvna:FixedPoolLoanSaleMemberus-gaap:ConsumerLoanMember2024-01-012024-12-310001690820cvna:FixedPoolLoanSaleMemberus-gaap:ConsumerLoanMember2022-01-012022-12-310001690820cvna:FixedPoolLoanSaleMemberus-gaap:ConsumerLoanMember2023-01-012023-12-310001690820cvna:MasterPurchaseAndSaleAgreementAndMasterTransferAgreementsMemberus-gaap:ConsumerLoanMember2024-01-012024-12-310001690820cvna:MasterPurchaseAndSaleAgreementAndMasterTransferAgreementsMemberus-gaap:ConsumerLoanMember2023-01-012023-12-310001690820cvna:MasterPurchaseAndSaleAgreementAndMasterTransferAgreementsMemberus-gaap:ConsumerLoanMember2022-01-012022-12-310001690820us-gaap:VariableInterestEntityNotPrimaryBeneficiaryMember2024-12-310001690820us-gaap:VariableInterestEntityNotPrimaryBeneficiaryMember2023-12-310001690820us-gaap:VariableInterestEntityNotPrimaryBeneficiaryMembercvna:RatedNotesMember2024-12-310001690820us-gaap:VariableInterestEntityNotPrimaryBeneficiaryMembercvna:RatedNotesMember2023-12-310001690820us-gaap:VariableInterestEntityNotPrimaryBeneficiaryMembercvna:CertificatesAndOtherAssetsMember2024-12-310001690820us-gaap:VariableInterestEntityNotPrimaryBeneficiaryMembercvna:CertificatesAndOtherAssetsMember2023-12-310001690820cvna:FloorPlanFacilityMemberus-gaap:LineOfCreditMember2024-12-310001690820cvna:FloorPlanFacilityMemberus-gaap:LineOfCreditMember2023-12-310001690820cvna:FinanceReceivableFacilitiesMemberus-gaap:LineOfCreditMember2024-12-310001690820cvna:FinanceReceivableFacilitiesMemberus-gaap:LineOfCreditMember2023-12-310001690820cvna:FinancingOfBeneficialInterestsInSecuritizationsMember2024-12-310001690820cvna:FinancingOfBeneficialInterestsInSecuritizationsMember2023-12-310001690820cvna:RealEstateFinancingMember2024-12-310001690820cvna:RealEstateFinancingMember2023-12-310001690820cvna:SeniorSecuredNotesMemberus-gaap:SeniorNotesMember2024-12-310001690820cvna:SeniorSecuredNotesMemberus-gaap:SeniorNotesMember2023-12-310001690820cvna:SeniorUnsecuredNotesEffectiveSeptember2018Memberus-gaap:SeniorNotesMember2024-12-310001690820cvna:SeniorUnsecuredNotesEffectiveSeptember2018Memberus-gaap:SeniorNotesMember2023-12-310001690820cvna:FloorPlanFacility18MonthMemberus-gaap:LineOfCreditMember2023-11-010001690820cvna:FloorPlanFacility18MonthMemberus-gaap:LineOfCreditMembercvna:Under50CurrentInventoryMember2023-11-012023-11-010001690820cvna:FloorPlanFacility18MonthMemberus-gaap:LineOfCreditMembercvna:Under50CurrentInventoryMember2023-11-010001690820cvna:FloorPlanFacility18MonthMemberus-gaap:LineOfCreditMembercvna:Over50CurrentInventoryMember2023-11-012023-11-010001690820cvna:FloorPlanFacility18MonthMemberus-gaap:LineOfCreditMembercvna:Over50CurrentInventoryMember2023-11-010001690820cvna:FloorPlanFacilityMemberus-gaap:LineOfCreditMember2023-11-012023-11-010001690820cvna:FloorPlanFacilityMemberus-gaap:LineOfCreditMember2023-11-010001690820cvna:Under50CurrentInventoryMemberus-gaap:LineOfCreditMember2023-11-010001690820cvna:Between505999CurrentInventoryMemberus-gaap:LineOfCreditMember2023-11-010001690820cvna:FloorPlanFacility18MonthMemberus-gaap:LineOfCreditMembercvna:Between505999CurrentInventoryMembersrt:MinimumMember2023-11-010001690820cvna:FloorPlanFacility18MonthMemberus-gaap:LineOfCreditMembercvna:Between505999CurrentInventoryMembersrt:MaximumMember2023-11-010001690820cvna:Between606099CurrentInventoryMemberus-gaap:LineOfCreditMember2023-11-010001690820cvna:FloorPlanFacility18MonthMemberus-gaap:LineOfCreditMembercvna:Between606099CurrentInventoryMembersrt:MinimumMember2023-11-010001690820cvna:FloorPlanFacility18MonthMemberus-gaap:LineOfCreditMembercvna:Between606099CurrentInventoryMembersrt:MaximumMember2023-11-010001690820cvna:Over70CurrentInventoryMemberus-gaap:LineOfCreditMember2023-11-010001690820cvna:FloorPlanFacility18MonthMemberus-gaap:LineOfCreditMembercvna:Over70CurrentInventoryMember2023-11-010001690820cvna:FloorPlanFacility12MonthMemberus-gaap:LineOfCreditMember2024-12-310001690820cvna:SPVANAIICreditFacilityMemberus-gaap:RevolvingCreditFacilityMember2020-02-290001690820cvna:SPVANAIICreditFacilityMemberus-gaap:RevolvingCreditFacilityMember2021-12-310001690820cvna:SPVANAIIICreditFacilityMemberus-gaap:RevolvingCreditFacilityMember2021-04-300001690820cvna:SPVANAIIICreditFacilityMemberus-gaap:RevolvingCreditFacilityMember2021-12-310001690820cvna:SPVANAIVCreditFacilityMemberus-gaap:RevolvingCreditFacilityMember2022-03-310001690820cvna:SPVANAVICreditFacilityMemberus-gaap:RevolvingCreditFacilityMember2023-05-310001690820cvna:SPVANAIVCreditFacilityMemberus-gaap:RevolvingCreditFacilityMember2024-12-310001690820cvna:SPVANAIVCreditFacilityMemberus-gaap:RevolvingCreditFacilityMember2023-12-310001690820cvna:FinanceReceivableFacilitiesMemberus-gaap:RevolvingCreditFacilityMember2023-12-310001690820cvna:SeniorSecuredNotesDue2028Memberus-gaap:SeniorNotesMember2024-12-310001690820cvna:SeniorSecuredNotesDue2028Memberus-gaap:SeniorNotesMember2023-12-310001690820cvna:SeniorSecuredNotesDue2030Memberus-gaap:SeniorNotesMember2024-12-310001690820cvna:SeniorSecuredNotesDue2030Memberus-gaap:SeniorNotesMember2023-12-310001690820cvna:SeniorSecuredNotesDue2031Memberus-gaap:SeniorNotesMember2024-12-310001690820cvna:SeniorSecuredNotesDue2031Memberus-gaap:SeniorNotesMember2023-12-310001690820us-gaap:SeniorNotesMember2024-01-012024-12-310001690820us-gaap:SeniorNotesMember2023-01-012023-12-310001690820us-gaap:SeniorNotesMember2024-12-310001690820us-gaap:SeniorNotesMember2023-12-310001690820cvna:SeniorSecuredNotesDue2028Memberus-gaap:SeniorNotesMember2024-02-152024-02-150001690820cvna:SeniorSecuredNotesDue2030Memberus-gaap:SeniorNotesMember2024-02-152024-02-150001690820cvna:SeniorSecuredNotesDue2031Memberus-gaap:SeniorNotesMember2024-02-152024-02-150001690820cvna:SeniorSecuredNotesDue2028Memberus-gaap:SeniorNotesMember2024-08-152024-08-150001690820cvna:SeniorSecuredNotesDue2030Memberus-gaap:SeniorNotesMember2024-08-152024-08-150001690820cvna:SeniorSecuredNotesDue2031Memberus-gaap:SeniorNotesMember2024-08-152024-08-150001690820cvna:SeniorSecuredNotesMemberus-gaap:SeniorNotesMember2023-09-010001690820cvna:SeniorSecuredNotesMemberus-gaap:SeniorNotesMember2023-09-012023-09-010001690820cvna:SeniorUnsecuredNotesMemberus-gaap:SeniorNotesMember2023-09-010001690820cvna:SeniorUnsecuredNotesEffectiveSeptember2018Memberus-gaap:SeniorNotesMember2023-09-010001690820cvna:SeniorUnsecuredNotesEffectiveOctober20205625Member2023-09-012023-09-0100016908202023-09-012023-09-010001690820cvna:SeniorUnsecuredNotesEffectiveOctober20205625Memberus-gaap:SeniorNotesMember2022-12-310001690820cvna:SeniorUnsecuredNotesEffectiveOctober20205625Membercvna:SeniorSecuredNotesDue2028Memberus-gaap:SeniorNotesMember2023-09-010001690820cvna:SeniorUnsecuredNotesEffectiveOctober20205625Membercvna:SeniorSecuredNotesDue2030Memberus-gaap:SeniorNotesMember2023-09-010001690820cvna:SeniorUnsecuredNotesEffectiveOctober20205625Membercvna:SeniorSecuredNotesDue2031Memberus-gaap:SeniorNotesMember2023-09-010001690820cvna:SeniorUnsecuredNotesEffectiveOctober20205625Membercvna:SeniorSecuredNotesMemberus-gaap:SeniorNotesMember2023-09-010001690820cvna:SeniorUnsecuredNotesEffectiveMarch20215500Memberus-gaap:SeniorNotesMember2022-12-310001690820cvna:SeniorUnsecuredNotesEffectiveMarch20215500Member2023-09-012023-09-010001690820cvna:SeniorUnsecuredNotesEffectiveMarch20215500Membercvna:SeniorSecuredNotesDue2028Memberus-gaap:SeniorNotesMember2023-09-010001690820cvna:SeniorUnsecuredNotesEffectiveMarch20215500Membercvna:SeniorSecuredNotesDue2030Memberus-gaap:SeniorNotesMember2023-09-010001690820cvna:SeniorUnsecuredNotesEffectiveMarch20215500Membercvna:SeniorSecuredNotesDue2031Memberus-gaap:SeniorNotesMember2023-09-010001690820cvna:SeniorUnsecuredNotesEffectiveMarch20215500Membercvna:SeniorSecuredNotesMemberus-gaap:SeniorNotesMember2023-09-010001690820cvna:SeniorUnsecuredNotesEffectiveOctober20205875Memberus-gaap:SeniorNotesMember2022-12-310001690820cvna:SeniorUnsecuredNotesEffectiveOctober20205875Member2023-09-012023-09-010001690820cvna:SeniorUnsecuredNotesEffectiveOctober20205875Membercvna:SeniorSecuredNotesDue2028Memberus-gaap:SeniorNotesMember2023-09-010001690820cvna:SeniorUnsecuredNotesEffectiveOctober20205875Membercvna:SeniorSecuredNotesDue2030Memberus-gaap:SeniorNotesMember2023-09-010001690820cvna:SeniorUnsecuredNotesEffectiveOctober20205875Membercvna:SeniorSecuredNotesDue2031Memberus-gaap:SeniorNotesMember2023-09-010001690820cvna:SeniorUnsecuredNotesEffectiveOctober20205875Membercvna:SeniorSecuredNotesMemberus-gaap:SeniorNotesMember2023-09-010001690820cvna:SeniorUnsecuredNotesEffectiveAugust20214875Memberus-gaap:SeniorNotesMember2022-12-310001690820cvna:SeniorUnsecuredNotesEffectiveAugust20214875Member2023-09-012023-09-010001690820cvna:SeniorUnsecuredNotesEffectiveAugust20214875Membercvna:SeniorSecuredNotesDue2028Memberus-gaap:SeniorNotesMember2023-09-010001690820cvna:SeniorUnsecuredNotesEffectiveAugust20214875Membercvna:SeniorSecuredNotesDue2030Memberus-gaap:SeniorNotesMember2023-09-010001690820cvna:SeniorUnsecuredNotesEffectiveAugust20214875Membercvna:SeniorSecuredNotesDue2031Memberus-gaap:SeniorNotesMember2023-09-010001690820cvna:SeniorUnsecuredNotesEffectiveAugust20214875Membercvna:SeniorSecuredNotesMemberus-gaap:SeniorNotesMember2023-09-010001690820cvna:SeniorUnsecuredNotesEffectiveMay202210250Memberus-gaap:SeniorNotesMember2022-12-310001690820cvna:SeniorUnsecuredNotesEffectiveMay202210250Member2023-09-012023-09-010001690820cvna:SeniorUnsecuredNotesEffectiveMay202210250Membercvna:SeniorSecuredNotesDue2028Memberus-gaap:SeniorNotesMember2023-09-010001690820cvna:SeniorUnsecuredNotesEffectiveMay202210250Membercvna:SeniorSecuredNotesDue2030Memberus-gaap:SeniorNotesMember2023-09-010001690820cvna:SeniorUnsecuredNotesEffectiveMay202210250Membercvna:SeniorSecuredNotesDue2031Memberus-gaap:SeniorNotesMember2023-09-010001690820cvna:SeniorUnsecuredNotesEffectiveMay202210250Membercvna:SeniorSecuredNotesMemberus-gaap:SeniorNotesMember2023-09-010001690820cvna:SeniorUnsecuredNotesMemberus-gaap:SeniorNotesMember2022-12-310001690820cvna:SeniorUnsecuredNotesMember2023-09-012023-09-010001690820cvna:SeniorSecuredNotesDue2028Memberus-gaap:SeniorNotesMember2023-09-010001690820cvna:SeniorSecuredNotesDue2030Memberus-gaap:SeniorNotesMember2023-09-010001690820cvna:SeniorSecuredNotesDue2031Memberus-gaap:SeniorNotesMember2023-09-010001690820cvna:SeniorUnsecuredNotesEffectiveOctober20205625Memberus-gaap:SeniorNotesMember2024-12-310001690820cvna:SeniorUnsecuredNotesEffectiveOctober20205625Memberus-gaap:SeniorNotesMember2023-12-310001690820cvna:SeniorUnsecuredNotesEffectiveMarch20215500Memberus-gaap:SeniorNotesMember2024-12-310001690820cvna:SeniorUnsecuredNotesEffectiveMarch20215500Memberus-gaap:SeniorNotesMember2023-12-310001690820cvna:SeniorUnsecuredNotesEffectiveOctober20205875Memberus-gaap:SeniorNotesMember2024-12-310001690820cvna:SeniorUnsecuredNotesEffectiveOctober20205875Memberus-gaap:SeniorNotesMember2023-12-310001690820cvna:SeniorUnsecuredNotesEffectiveAugust20214875Memberus-gaap:SeniorNotesMember2024-12-310001690820cvna:SeniorUnsecuredNotesEffectiveAugust20214875Memberus-gaap:SeniorNotesMember2023-12-310001690820cvna:SeniorUnsecuredNotesEffectiveMay202210250Memberus-gaap:SeniorNotesMember2024-12-310001690820cvna:SeniorUnsecuredNotesEffectiveMay202210250Memberus-gaap:SeniorNotesMember2023-12-310001690820cvna:SeniorUnsecuredNotesMemberus-gaap:SeniorNotesMember2024-12-310001690820cvna:SeniorUnsecuredNotesMemberus-gaap:SeniorNotesMember2023-12-310001690820cvna:SeniorUnsecuredNotesEffectiveAugust20214875Memberus-gaap:SeniorNotesMemberus-gaap:DebtInstrumentRedemptionPeriodOneMember2024-01-012024-12-310001690820cvna:SeniorUnsecuredNotesMemberus-gaap:SeniorNotesMemberus-gaap:DebtInstrumentRedemptionPeriodOneMember2024-01-012024-12-310001690820cvna:SeniorUnsecuredNotesEffectiveMay202210250Memberus-gaap:SeniorNotesMemberus-gaap:DebtInstrumentRedemptionPeriodOneMember2024-01-012024-12-310001690820srt:MinimumMember2024-01-012024-12-310001690820srt:MaximumMember2024-01-012024-12-310001690820us-gaap:AssetPledgedAsCollateralMemberus-gaap:VariableInterestEntityNotPrimaryBeneficiaryMember2024-12-310001690820us-gaap:AssetPledgedAsCollateralMemberus-gaap:VariableInterestEntityNotPrimaryBeneficiaryMember2023-12-310001690820us-gaap:CommonClassAMember2024-01-012024-12-310001690820us-gaap:CommonClassBMembercvna:GarciaPartiesMember2024-01-012024-12-310001690820cvna:GarciaPartiesMember2024-01-012024-12-310001690820us-gaap:CommonClassBMember2024-01-012024-12-310001690820cvna:CarvanaSubMember2024-01-012024-12-310001690820cvna:CarvanaGroupMembercvna:ClassACommonUnitsMember2024-12-310001690820cvna:CarvanaGroupMembercvna:ClassACommonUnitsMember2023-12-310001690820cvna:CarvanaGroupMembercvna:ClassBCommonUnitsMember2024-12-310001690820cvna:CarvanaGroupMembercvna:ClassBCommonUnitsMember2023-12-310001690820us-gaap:CommonClassAMembercvna:AtTheMarketOfferingATMOfferingMember2023-07-192023-07-190001690820us-gaap:CommonClassAMembercvna:AtTheMarketOfferingATMOfferingMember2024-01-012024-12-310001690820us-gaap:CommonClassAMembercvna:AtTheMarketOfferingATMOfferingMember2023-01-012023-12-310001690820us-gaap:CommonClassAMembercvna:AtTheMarketOfferingATMOfferingMember2024-12-310001690820us-gaap:CommonClassAMembercvna:AtTheMarketOfferingATMOfferingMember2023-12-310001690820cvna:AtTheMarketOfferingATMOfferingMember2023-01-012023-12-310001690820cvna:LLCUnitsMembercvna:ExchangeAgreementMember2024-01-012024-12-310001690820cvna:LLCUnitsMembercvna:ExchangeAgreementMember2023-01-012023-12-310001690820us-gaap:CommonClassBMembercvna:ExchangeAgreementMember2024-01-012024-12-310001690820us-gaap:CommonClassBMembercvna:ExchangeAgreementMember2023-01-012023-12-310001690820us-gaap:CommonClassAMembercvna:ExchangeAgreementMember2024-01-012024-12-310001690820us-gaap:CommonClassAMembercvna:ExchangeAgreementMember2023-01-012023-12-310001690820cvna:ClassANonConvertiblePreferredUnitsMember2024-12-310001690820cvna:ClassANonConvertiblePreferredUnitsMember2023-12-310001690820cvna:SeniorUnsecuredNotesEffectiveSeptember2018Memberus-gaap:SeniorNotesMember2018-10-022018-10-020001690820cvna:CarvanaGroupMembercvna:ClassANonConvertiblePreferredUnitsMember2018-10-020001690820cvna:ClassANonConvertiblePreferredUnitsMember2024-01-012024-12-310001690820cvna:CarvanaGroupMembercvna:ClassANonConvertiblePreferredUnitsMember2023-12-310001690820us-gaap:CommonClassAMember2017-05-032017-05-030001690820us-gaap:CommonClassBMember2017-05-032017-05-030001690820us-gaap:CommonClassAMembercvna:ExchangeAgreementMember2017-05-032017-05-030001690820cvna:RestrictedStockUnitsAndRestrictedStockExcludingMilestoneGiftMember2024-01-012024-12-310001690820cvna:RestrictedStockUnitsAndRestrictedStockExcludingMilestoneGiftMember2023-01-012023-12-310001690820cvna:RestrictedStockUnitsAndRestrictedStockExcludingMilestoneGiftMember2022-01-012022-12-310001690820us-gaap:EmployeeStockOptionMember2024-01-012024-12-310001690820us-gaap:EmployeeStockOptionMember2023-01-012023-12-310001690820us-gaap:EmployeeStockOptionMember2022-01-012022-12-310001690820cvna:PropertyPlantAndEquipmentAndFinanceLeaseRightOfUseAssetAfterAccumulatedDepreciationAndAmortizationMember2024-01-012024-12-310001690820cvna:PropertyPlantAndEquipmentAndFinanceLeaseRightOfUseAssetAfterAccumulatedDepreciationAndAmortizationMember2023-01-012023-12-310001690820cvna:PropertyPlantAndEquipmentAndFinanceLeaseRightOfUseAssetAfterAccumulatedDepreciationAndAmortizationMember2022-01-012022-12-310001690820cvna:InventoryNetMember2024-01-012024-12-310001690820cvna:InventoryNetMember2023-01-012023-12-310001690820cvna:InventoryNetMember2022-01-012022-12-310001690820cvna:RestrictedStockUnitsAndRestrictedStockMember2024-12-310001690820cvna:RestrictedStockUnitsAndRestrictedStockMember2024-01-012024-12-310001690820us-gaap:EmployeeStockOptionMember2024-12-310001690820cvna:TwoThousandSeventeenOmnibusIncentivePlanMemberus-gaap:CommonClassAMember2023-05-010001690820cvna:TwoThousandSeventeenOmnibusIncentivePlanMemberus-gaap:CommonClassAMember2024-12-310001690820cvna:TwoThousandSeventeenOmnibusIncentivePlanMemberus-gaap:CommonClassAMember2024-01-012024-12-310001690820cvna:TwoThousandSeventeenOmnibusIncentivePlanMemberus-gaap:RestrictedStockMembersrt:MinimumMember2024-01-012024-12-310001690820us-gaap:RestrictedStockMembercvna:TwoThousandSeventeenOmnibusIncentivePlanMember2022-01-012022-12-310001690820cvna:TwoThousandSeventeenOmnibusIncentivePlanMemberus-gaap:RestrictedStockMemberus-gaap:CommonClassAMember2022-01-012022-12-310001690820us-gaap:RestrictedStockMembercvna:TwoThousandSeventeenOmnibusIncentivePlanMember2023-01-012023-12-310001690820us-gaap:RestrictedStockMembercvna:TwoThousandSeventeenOmnibusIncentivePlanMember2024-01-012024-12-310001690820us-gaap:RestrictedStockUnitsRSUMembercvna:TwoThousandSeventeenOmnibusIncentivePlanMember2024-01-012024-12-310001690820cvna:RSAsRSUsMembercvna:TwoThousandSeventeenOmnibusIncentivePlanMember2024-01-012024-12-310001690820cvna:TwoThousandSeventeenOmnibusIncentivePlanMemberus-gaap:RestrictedStockUnitsRSUMemberus-gaap:CommonClassAMember2023-01-012023-12-310001690820cvna:TwoThousandSeventeenOmnibusIncentivePlanMemberus-gaap:RestrictedStockUnitsRSUMemberus-gaap:CommonClassAMember2022-01-012022-12-310001690820cvna:TwoThousandSeventeenOmnibusIncentivePlanMemberus-gaap:RestrictedStockUnitsRSUMemberus-gaap:CommonClassAMember2024-01-012024-12-310001690820cvna:RSAsRSUsMembercvna:TwoThousandSeventeenOmnibusIncentivePlanMember2021-12-310001690820cvna:RSAsRSUsMembercvna:TwoThousandSeventeenOmnibusIncentivePlanMember2022-01-012022-12-310001690820cvna:RSAsRSUsMembercvna:TwoThousandSeventeenOmnibusIncentivePlanMember2022-12-310001690820cvna:RSAsRSUsMembercvna:TwoThousandSeventeenOmnibusIncentivePlanMember2023-01-012023-12-310001690820cvna:RSAsRSUsMembercvna:TwoThousandSeventeenOmnibusIncentivePlanMember2023-12-310001690820cvna:RSAsRSUsMembercvna:TwoThousandSeventeenOmnibusIncentivePlanMember2024-12-310001690820cvna:TwoThousandAndTwentyOneEmployeeStockPurchasePlanMemberus-gaap:EmployeeStockMemberus-gaap:CommonClassAMember2021-07-012021-07-010001690820cvna:TwoThousandAndTwentyOneEmployeeStockPurchasePlanMemberus-gaap:EmployeeStockMemberus-gaap:CommonClassAMembersrt:MinimumMember2021-07-012021-07-010001690820cvna:TwoThousandAndTwentyOneEmployeeStockPurchasePlanMemberus-gaap:EmployeeStockMemberus-gaap:CommonClassAMembersrt:MaximumMember2021-07-012021-07-010001690820cvna:TwoThousandAndTwentyOneEmployeeStockPurchasePlanMemberus-gaap:EmployeeStockMemberus-gaap:CommonClassAMember2021-07-010001690820cvna:TwoThousandAndTwentyOneEmployeeStockPurchasePlanMemberus-gaap:EmployeeStockMemberus-gaap:CommonClassAMember2024-01-012024-12-310001690820cvna:TwoThousandAndTwentyOneEmployeeStockPurchasePlanMemberus-gaap:EmployeeStockMemberus-gaap:CommonClassAMember2023-01-012023-12-310001690820cvna:TwoThousandAndTwentyOneEmployeeStockPurchasePlanMemberus-gaap:EmployeeStockMemberus-gaap:CommonClassAMember2022-01-012022-12-310001690820cvna:TwoThousandAndTwentyOneEmployeeStockPurchasePlanMemberus-gaap:EmployeeStockMemberus-gaap:CommonClassAMember2024-12-310001690820us-gaap:EmployeeStockMembercvna:TwoThousandAndTwentyOneEmployeeStockPurchasePlanMember2023-01-012023-12-310001690820us-gaap:EmployeeStockMembercvna:TwoThousandAndTwentyOneEmployeeStockPurchasePlanMember2022-01-012022-12-310001690820us-gaap:EmployeeStockMembercvna:TwoThousandAndTwentyOneEmployeeStockPurchasePlanMember2024-01-012024-12-310001690820cvna:TwoThousandSeventeenOmnibusIncentivePlanMemberus-gaap:EmployeeStockOptionMembercvna:SharebasedCompensationAwardTrancheFourMember2024-01-012024-12-310001690820cvna:TwoThousandSeventeenOmnibusIncentivePlanMemberus-gaap:EmployeeStockOptionMemberus-gaap:ShareBasedCompensationAwardTrancheTwoMember2024-01-012024-12-310001690820cvna:TwoThousandSeventeenOmnibusIncentivePlanMemberus-gaap:EmployeeStockOptionMemberus-gaap:ShareBasedCompensationAwardTrancheThreeMember2024-01-012024-12-310001690820cvna:TwoThousandSeventeenOmnibusIncentivePlanMemberus-gaap:EmployeeStockOptionMemberus-gaap:ShareBasedCompensationAwardTrancheOneMember2024-01-012024-12-310001690820us-gaap:EmployeeStockOptionMembercvna:TwoThousandSeventeenOmnibusIncentivePlanMember2024-01-012024-12-310001690820cvna:TwoThousandSeventeenOmnibusIncentivePlanMember2021-12-310001690820cvna:TwoThousandSeventeenOmnibusIncentivePlanMember2021-01-012021-12-310001690820cvna:TwoThousandSeventeenOmnibusIncentivePlanMember2022-01-012022-12-310001690820cvna:TwoThousandSeventeenOmnibusIncentivePlanMember2022-12-310001690820cvna:TwoThousandSeventeenOmnibusIncentivePlanMember2023-01-012023-12-310001690820cvna:TwoThousandSeventeenOmnibusIncentivePlanMember2023-12-310001690820cvna:TwoThousandSeventeenOmnibusIncentivePlanMember2024-01-012024-12-310001690820cvna:TwoThousandSeventeenOmnibusIncentivePlanMember2024-12-310001690820us-gaap:EmployeeStockOptionMembercvna:TwoThousandSeventeenOmnibusIncentivePlanMember2023-01-012023-12-310001690820us-gaap:EmployeeStockOptionMembercvna:TwoThousandSeventeenOmnibusIncentivePlanMember2022-01-012022-12-310001690820srt:MinimumMembercvna:ClassACommonUnitsMember2019-01-012019-12-310001690820srt:MaximumMembercvna:ClassACommonUnitsMember2019-01-012019-12-310001690820cvna:ClassACommonUnitsMember2019-01-012019-12-310001690820cvna:ClassACommonUnitsMember2024-01-012024-12-310001690820cvna:ClassACommonUnitsMember2021-12-310001690820cvna:ClassACommonUnitsMember2022-01-012022-12-310001690820cvna:ClassACommonUnitsMember2022-12-310001690820cvna:ClassACommonUnitsMember2023-01-012023-12-310001690820cvna:ClassACommonUnitsMember2023-12-310001690820cvna:ClassACommonUnitsMember2024-12-310001690820srt:MinimumMembercvna:ClassBCommonUnitsMember2015-03-012015-03-310001690820srt:MaximumMembercvna:ClassBCommonUnitsMember2015-03-012015-03-310001690820cvna:ClassBCommonUnitsMember2024-01-012024-12-310001690820cvna:ClassBCommonUnitsMember2023-01-012023-12-310001690820cvna:ClassBCommonUnitsMember2022-01-012022-12-310001690820srt:MinimumMembercvna:ClassBCommonUnitsMember2024-01-012024-12-310001690820srt:MaximumMembercvna:ClassBCommonUnitsMember2024-01-012024-12-310001690820cvna:ClassBCommonUnitsMember2021-12-310001690820cvna:ClassBCommonUnitsMember2022-12-310001690820cvna:ClassBCommonUnitsMember2023-12-310001690820cvna:ClassBCommonUnitsMember2024-12-310001690820cvna:ClassACommonUnitsMember2021-01-012021-12-310001690820cvna:ClassBCommonUnitsMember2021-01-012021-12-310001690820us-gaap:CommonClassAMember2023-01-012023-12-310001690820us-gaap:CommonClassAMember2022-01-012022-12-310001690820us-gaap:EmployeeStockOptionMemberus-gaap:CommonClassAMember2024-01-012024-12-310001690820us-gaap:EmployeeStockOptionMemberus-gaap:CommonClassAMember2023-01-012023-12-310001690820us-gaap:EmployeeStockOptionMemberus-gaap:CommonClassAMember2022-01-012022-12-310001690820cvna:RestrictedStockUnitsAndRestrictedStockMemberus-gaap:CommonClassAMember2024-01-012024-12-310001690820cvna:RestrictedStockUnitsAndRestrictedStockMemberus-gaap:CommonClassAMember2023-01-012023-12-310001690820cvna:RestrictedStockUnitsAndRestrictedStockMemberus-gaap:CommonClassAMember2022-01-012022-12-310001690820cvna:ClassACommonUnitsMemberus-gaap:CommonClassAMember2024-01-012024-12-310001690820cvna:ClassACommonUnitsMemberus-gaap:CommonClassAMember2023-01-012023-12-310001690820cvna:ClassACommonUnitsMemberus-gaap:CommonClassAMember2022-01-012022-12-310001690820cvna:ClassBCommonUnitsMemberus-gaap:CommonClassAMember2024-01-012024-12-310001690820cvna:ClassBCommonUnitsMemberus-gaap:CommonClassAMember2023-01-012023-12-310001690820cvna:ClassBCommonUnitsMemberus-gaap:CommonClassAMember2022-01-012022-12-310001690820us-gaap:EmployeeStockOptionMember2024-01-012024-12-310001690820us-gaap:EmployeeStockOptionMember2023-01-012023-12-310001690820us-gaap:EmployeeStockOptionMember2022-01-012022-12-310001690820cvna:RestrictedStockUnitsAndRestrictedStockMember2024-01-012024-12-310001690820cvna:RestrictedStockUnitsAndRestrictedStockMember2023-01-012023-12-310001690820cvna:RestrictedStockUnitsAndRestrictedStockMember2022-01-012022-12-310001690820cvna:ClassACommonUnitsMember2024-01-012024-12-310001690820cvna:ClassACommonUnitsMember2023-01-012023-12-310001690820cvna:ClassACommonUnitsMember2022-01-012022-12-310001690820cvna:ClassBCommonUnitsMember2024-01-012024-12-310001690820cvna:ClassBCommonUnitsMember2023-01-012023-12-310001690820cvna:ClassBCommonUnitsMember2022-01-012022-12-310001690820cvna:CarvanaGroupMemberus-gaap:AdditionalPaidInCapitalMembercvna:LLCUnitExchangesMember2024-01-012024-12-310001690820cvna:CarvanaGroupMemberus-gaap:AdditionalPaidInCapitalMembercvna:LLCUnitExchangesMember2023-01-012023-12-310001690820cvna:CarvanaGroupMemberus-gaap:AdditionalPaidInCapitalMembercvna:AtTheMarketOfferingATMOfferingMember2024-01-012024-12-310001690820cvna:CarvanaGroupMemberus-gaap:AdditionalPaidInCapitalMembercvna:AtTheMarketOfferingATMOfferingMember2023-01-012023-12-310001690820srt:MinimumMember2024-12-310001690820srt:MaximumMember2024-12-310001690820srt:MinimumMemberus-gaap:EquipmentMember2024-12-310001690820srt:MaximumMemberus-gaap:EquipmentMember2024-12-310001690820us-gaap:EquipmentMember2024-01-012024-12-310001690820us-gaap:NonrelatedPartyMember2024-01-012024-12-310001690820us-gaap:NonrelatedPartyMember2023-01-012023-12-310001690820us-gaap:NonrelatedPartyMember2022-01-012022-12-310001690820us-gaap:NonrelatedPartyMember2024-12-3100016908202022-11-022022-11-020001690820us-gaap:MoneyMarketFundsMemberus-gaap:FairValueMeasurementsRecurringMember2024-12-310001690820us-gaap:MoneyMarketFundsMemberus-gaap:FairValueInputsLevel1Memberus-gaap:FairValueMeasurementsRecurringMember2024-12-310001690820us-gaap:MoneyMarketFundsMemberus-gaap:FairValueInputsLevel2Memberus-gaap:FairValueMeasurementsRecurringMember2024-12-310001690820us-gaap:MoneyMarketFundsMemberus-gaap:FairValueInputsLevel3Memberus-gaap:FairValueMeasurementsRecurringMember2024-12-310001690820us-gaap:FairValueMeasurementsRecurringMember2024-12-310001690820us-gaap:FairValueInputsLevel1Memberus-gaap:FairValueMeasurementsRecurringMember2024-12-310001690820us-gaap:FairValueInputsLevel2Memberus-gaap:FairValueMeasurementsRecurringMember2024-12-310001690820us-gaap:FairValueInputsLevel3Memberus-gaap:FairValueMeasurementsRecurringMember2024-12-310001690820us-gaap:FairValueMeasurementsRecurringMemberus-gaap:WarrantMember2024-12-310001690820us-gaap:FairValueInputsLevel1Memberus-gaap:FairValueMeasurementsRecurringMemberus-gaap:WarrantMember2024-12-310001690820us-gaap:FairValueInputsLevel2Memberus-gaap:FairValueMeasurementsRecurringMemberus-gaap:WarrantMember2024-12-310001690820us-gaap:FairValueInputsLevel3Memberus-gaap:FairValueMeasurementsRecurringMemberus-gaap:WarrantMember2024-12-310001690820us-gaap:MoneyMarketFundsMemberus-gaap:FairValueMeasurementsRecurringMember2023-12-310001690820us-gaap:MoneyMarketFundsMemberus-gaap:FairValueInputsLevel1Memberus-gaap:FairValueMeasurementsRecurringMember2023-12-310001690820us-gaap:MoneyMarketFundsMemberus-gaap:FairValueInputsLevel2Memberus-gaap:FairValueMeasurementsRecurringMember2023-12-310001690820us-gaap:MoneyMarketFundsMemberus-gaap:FairValueInputsLevel3Memberus-gaap:FairValueMeasurementsRecurringMember2023-12-310001690820us-gaap:FairValueMeasurementsRecurringMember2023-12-310001690820us-gaap:FairValueInputsLevel1Memberus-gaap:FairValueMeasurementsRecurringMember2023-12-310001690820us-gaap:FairValueInputsLevel2Memberus-gaap:FairValueMeasurementsRecurringMember2023-12-310001690820us-gaap:FairValueInputsLevel3Memberus-gaap:FairValueMeasurementsRecurringMember2023-12-310001690820us-gaap:FairValueMeasurementsRecurringMemberus-gaap:WarrantMember2023-12-310001690820us-gaap:FairValueInputsLevel1Memberus-gaap:FairValueMeasurementsRecurringMemberus-gaap:WarrantMember2023-12-310001690820us-gaap:FairValueInputsLevel2Memberus-gaap:FairValueMeasurementsRecurringMemberus-gaap:WarrantMember2023-12-310001690820us-gaap:FairValueInputsLevel3Memberus-gaap:FairValueMeasurementsRecurringMemberus-gaap:WarrantMember2023-12-310001690820us-gaap:FairValueMeasurementsRecurringMembersrt:MinimumMemberus-gaap:FairValueInputsLevel3Memberus-gaap:MeasurementInputDiscountRateMemberus-gaap:ValuationTechniqueDiscountedCashFlowMemberus-gaap:VariableInterestEntityNotPrimaryBeneficiaryMember2024-12-310001690820us-gaap:FairValueMeasurementsRecurringMembersrt:MaximumMemberus-gaap:FairValueInputsLevel3Memberus-gaap:MeasurementInputDiscountRateMemberus-gaap:ValuationTechniqueDiscountedCashFlowMemberus-gaap:VariableInterestEntityNotPrimaryBeneficiaryMember2024-12-310001690820us-gaap:FairValueMeasurementsRecurringMembersrt:MinimumMemberus-gaap:FairValueInputsLevel3Memberus-gaap:MeasurementInputDiscountRateMemberus-gaap:ValuationTechniqueDiscountedCashFlowMemberus-gaap:VariableInterestEntityNotPrimaryBeneficiaryMember2023-12-310001690820us-gaap:FairValueMeasurementsRecurringMembersrt:MaximumMemberus-gaap:FairValueInputsLevel3Memberus-gaap:MeasurementInputDiscountRateMemberus-gaap:ValuationTechniqueDiscountedCashFlowMemberus-gaap:VariableInterestEntityNotPrimaryBeneficiaryMember2023-12-310001690820us-gaap:FairValueMeasurementsRecurringMemberus-gaap:FairValueInputsLevel3Membercvna:MeasurementInputWeightedAverageDiscountRateMemberus-gaap:ValuationTechniqueDiscountedCashFlowMemberus-gaap:VariableInterestEntityNotPrimaryBeneficiaryMember2024-12-310001690820us-gaap:FairValueMeasurementsRecurringMemberus-gaap:FairValueInputsLevel3Membercvna:MeasurementInputWeightedAverageDiscountRateMemberus-gaap:ValuationTechniqueDiscountedCashFlowMemberus-gaap:VariableInterestEntityNotPrimaryBeneficiaryMember2023-12-310001690820us-gaap:FairValueInputsLevel3Memberus-gaap:FairValueMeasurementsRecurringMemberus-gaap:VariableInterestEntityNotPrimaryBeneficiaryMember2024-01-012024-12-310001690820us-gaap:FairValueInputsLevel3Memberus-gaap:FairValueMeasurementsRecurringMemberus-gaap:VariableInterestEntityNotPrimaryBeneficiaryMember2023-01-012023-12-310001690820us-gaap:FairValueInputsLevel3Memberus-gaap:FairValueMeasurementsRecurringMemberus-gaap:VariableInterestEntityNotPrimaryBeneficiaryMember2023-12-310001690820us-gaap:FairValueInputsLevel3Memberus-gaap:FairValueMeasurementsRecurringMemberus-gaap:VariableInterestEntityNotPrimaryBeneficiaryMember2022-12-310001690820us-gaap:FairValueMeasurementsRecurringMember2024-01-012024-12-310001690820us-gaap:FairValueMeasurementsRecurringMember2023-01-012023-12-310001690820cvna:RootIncMember2021-10-310001690820cvna:RootIncMemberus-gaap:WarrantMember2021-10-310001690820cvna:Tranche1Member2022-09-010001690820cvna:Tranche2Member2022-09-010001690820cvna:Tranche3Member2022-09-010001690820us-gaap:MeasurementInputPriceVolatilityMember2024-12-310001690820us-gaap:MeasurementInputPriceVolatilityMember2023-12-310001690820us-gaap:FairValueInputsLevel3Membercvna:RootIncMemberus-gaap:WarrantMember2024-12-310001690820us-gaap:FairValueInputsLevel3Membercvna:RootIncMemberus-gaap:WarrantMember2023-01-012023-12-310001690820cvna:RootIncMemberus-gaap:WarrantMember2024-12-310001690820cvna:RootIncMemberus-gaap:WarrantMember2023-12-310001690820cvna:RootIncMemberus-gaap:WarrantMember2024-01-012024-12-310001690820cvna:RootIncMemberus-gaap:WarrantMember2023-01-012023-12-310001690820cvna:RootIncMemberus-gaap:WarrantMember2022-01-012022-12-310001690820us-gaap:FairValueInputsLevel3Membercvna:RootIncMemberus-gaap:WarrantMember2023-12-310001690820us-gaap:FairValueInputsLevel3Membercvna:RootIncMemberus-gaap:WarrantMember2022-12-310001690820us-gaap:FairValueInputsLevel3Membercvna:RootIncMemberus-gaap:WarrantMember2024-01-012024-12-310001690820us-gaap:InterestRateCapMember2023-12-310001690820us-gaap:FairValueInputsLevel2Membercvna:InterestRateCapExpiresJuly2027Member2023-12-310001690820us-gaap:FairValueInputsLevel2Membercvna:InterestRateCapExpiresApril2027Member2023-12-310001690820us-gaap:FairValueInputsLevel2Memberus-gaap:CarryingReportedAmountFairValueDisclosureMemberus-gaap:SeniorNotesMember2024-12-310001690820us-gaap:FairValueInputsLevel2Memberus-gaap:CarryingReportedAmountFairValueDisclosureMemberus-gaap:SeniorNotesMember2023-12-310001690820us-gaap:FairValueInputsLevel2Membercvna:SeniorUnsecuredNotesEffectiveSeptember2018Memberus-gaap:EstimateOfFairValueFairValueDisclosureMemberus-gaap:SeniorNotesMember2024-12-310001690820us-gaap:FairValueInputsLevel2Membercvna:SeniorUnsecuredNotesEffectiveSeptember2018Memberus-gaap:EstimateOfFairValueFairValueDisclosureMemberus-gaap:SeniorNotesMember2023-12-310001690820us-gaap:FairValueInputsLevel2Memberus-gaap:CarryingReportedAmountFairValueDisclosureMember2024-12-310001690820us-gaap:FairValueInputsLevel2Memberus-gaap:CarryingReportedAmountFairValueDisclosureMember2023-12-310001690820us-gaap:FairValueInputsLevel2Memberus-gaap:EstimateOfFairValueFairValueDisclosureMember2024-12-310001690820us-gaap:FairValueInputsLevel2Memberus-gaap:EstimateOfFairValueFairValueDisclosureMember2023-12-310001690820us-gaap:CommonClassAMemberus-gaap:SubsequentEventMembercvna:SecondARDistributionAgreementMember2025-02-192025-02-1900016908202024-10-012024-12-310001690820cvna:TomTairaMember2024-01-012024-12-310001690820cvna:TomTairaMember2024-10-012024-12-310001690820cvna:TomTairaMember2024-12-310001690820cvna:DanielGillMember2024-01-012024-12-310001690820cvna:DanielGillTradingArrangementJune2023PlanMembercvna:DanielGillMember2024-10-012024-12-310001690820cvna:DanielGillTradingArrangementDecember2024PlanMembercvna:DanielGillMember2024-10-012024-12-310001690820cvna:DanielGillTradingArrangementDecember2024PlanMembercvna:DanielGillMember2024-12-310001690820cvna:BenjaminHustonMember2024-01-012024-12-310001690820cvna:BenjaminHustonTradingArrangementDecember2024PlanMembercvna:BenjaminHustonMember2024-10-012024-12-310001690820cvna:BenjaminHustonTradingArrangementMarch2021PlanMembercvna:BenjaminHustonMember2024-10-012024-12-310001690820cvna:BenjaminHustonTradingArrangementMarch2021PlanMembercvna:BenjaminHustonMember2024-12-310001690820cvna:BenjaminHustonTradingArrangementDecember2024PlanMembercvna:BenjaminHustonMember2024-12-310001690820cvna:ErnestGarciaIIIMember2024-01-012024-12-310001690820cvna:ErnestGarciaIIIMember2024-10-012024-12-310001690820cvna:ErnestGarciaIIIMember2024-12-310001690820us-gaap:ValuationAllowanceOfDeferredTaxAssetsMember2023-12-310001690820us-gaap:ValuationAllowanceOfDeferredTaxAssetsMember2024-01-012024-12-310001690820us-gaap:ValuationAllowanceOfDeferredTaxAssetsMember2024-12-310001690820us-gaap:ValuationAllowanceOfDeferredTaxAssetsMember2022-12-310001690820us-gaap:ValuationAllowanceOfDeferredTaxAssetsMember2023-01-012023-12-310001690820us-gaap:ValuationAllowanceOfDeferredTaxAssetsMember2021-12-310001690820us-gaap:ValuationAllowanceOfDeferredTaxAssetsMember2022-01-012022-12-31
UNITED STATES
SECURITIES AND EXCHANGE COMMISSION
Washington, D.C. 20549
FORM 10-K
☒ ANNUAL REPORT PURSUANT TO SECTION 13 OR 15(d) OF THE SECURITIES EXCHANGE ACT OF 1934
For the fiscal year ended December 31, 2024
OR
☐ TRANSITION REPORT PURSUANT TO SECTION 13 OR 15(d) OF THE SECURITIES EXCHANGE ACT OF 1934
For the transition period from _____ to ______
Commission File Number: 001-38073
CARVANA CO.
(Exact name of registrant as specified in its charter)
| | | | | | | | | | | |
| Delaware | 81-4549921 |
| (State or other jurisdiction of incorporation or organization) | (I.R.S. Employer Identification No.) |
| |
| 300 E. Rio Salado Parkway | Tempe | Arizona | 85281 |
| (Address of principal executive offices) | (Zip Code) |
(602) 922-9866
(Registrant's telephone number, including area code)
| | | | | | | | |
| Securities registered pursuant to Section 12(b) of the Act: |
| | |
| Title of each class | Trading Symbol(s) | Name of each exchange on which registered |
| Class A Common Stock, Par Value $0.001 Per Share | CVNA | New York Stock Exchange |
| | |
| | |
Securities registered pursuant to Section 12(g) of the Act: None |
Indicate by check mark if the registrant is a well-known seasoned issuer, as defined in Rule 405 of the Securities Act. ☒ Yes q No
Indicate by check mark if the registrant is not required to file reports pursuant to Section 13 or Section 15(d) of the Act. q Yes ☒ No
Indicate by check mark whether the registrant (1) has filed all reports required to be filed by Section 13 or 15(d) of the Securities Exchange Act of 1934 during the preceding 12 months (or for such shorter period that the registrant was required to file such reports), and (2) has been subject to such filing requirements for the past 90 days. ☒ Yes q No
Indicate by check mark whether the registrant has submitted electronically every Interactive Data File required to be submitted pursuant to Rule 405 of Regulation S-T (§232.405 of this chapter) during the preceding 12 months (or for such shorter period that the registrant was required to submit such files). ☒ Yes q No
Indicate by check mark whether the registrant is a large accelerated filer, an accelerated filer, a non-accelerated filer, a smaller reporting company, or an emerging growth company. See the definitions of "large accelerated filer," "accelerated filer," "smaller reporting company," and "emerging growth company" in Rule 12b-2 of the Exchange Act.
| | | | | | | | | | | | | | |
| Large accelerated filer | ☒ | Accelerated filer | ☐ | |
Non-accelerated filer | ☐ | Smaller reporting company | ☐ | |
Emerging growth company | ☐ | | | |
If an emerging growth company, indicate by check mark if the registrant has elected not to use the extended transition period for complying with any new or revised financial accounting standards provided pursuant to Section 13(a) of the Exchange Act. | ¨ |
Indicate by check mark whether the registrant has filed a report on and attestation to its management's assessment of the effectiveness of its internal control over financial reporting under Section 404(b) of the Sarbanes-Oxley Act (15 U.S.C. 7262(b)) by the registered public accounting firm that prepared or issued its audit report. | ☒ |
| If securities are registered pursuant to Section 12(b) of the Act, indicate by check mark whether the financial statements of the registrant included in the filing reflect the correction of an error to previously issued financial statements. | ☐ |
| Indicate by check mark whether any of those error corrections are restatements that required a recovery analysis of incentive-based compensation received by any of the registrant’s executive officers during the relevant recovery period pursuant to §240.10D-1(b). | ☐ |
Indicate by check mark whether the registrant is a shell company (as defined in Rule 12b-2 of the Act). ☐ Yes ☒ No
As of June 30, 2024, the aggregate market value of the common stock of the registrant held by non-affiliates was $14.7 billion based on the closing price of the common stock on the New York Stock Exchange on June 28, 2024.
As of February 14, 2025, the registrant had 134,046,880 shares of Class A common stock outstanding and 79,119,471 shares of Class B common stock outstanding.
DOCUMENTS INCORPORATED BY REFERENCE
Portions of the registrant's Definitive Proxy Statement for its 2025 Annual Meeting of Shareholders are incorporated by reference into Part III of this Form 10-K.
CARVANA CO.
FORM 10-K
FOR THE FISCAL YEAR ENDED DECEMBER 31, 2024
INDEX | | | | | | | | |
| | Page |
PART I |
Item 1. | Business | |
Item 1A. | Risk Factors | |
Item 1B. | Unresolved Staff Comments | |
Item 1C. | Cybersecurity | |
Item 2. | Properties | |
Item 3. | Legal Proceedings | |
Item 4. | Mine Safety Disclosures | |
| | |
PART II |
Item 5. | Market for Registrant's Common Equity, Related Stockholder Matters, and Issuer Purchases of Equity Securities | |
Item 6. | [Reserved] | |
Item 7. | Management's Discussion and Analysis of Financial Condition and Results of Operations | |
Item 7A. | Quantitative and Qualitative Disclosures about Market Risk | |
Item 8. | Financial Statements and Supplementary Data | |
Item 9. | Changes in and Disagreements with Accountants on Accounting and Financial Disclosure | |
Item 9A. | Controls and Procedures | |
Item 9B. | Other Information | |
| Item 9C. | Disclosure Regarding Foreign Jurisdictions that Prevent Inspections | |
| | |
PART III |
Item 10. | Directors, Executive Officers and Corporate Governance | |
Item 11. | Executive Compensation | |
Item 12. | Security Ownership of Certain Beneficial Owners and Management and Related Stockholder Matters | |
Item 13. | Certain Relationships and Related Transactions, and Director Independence | |
Item 14. | Principal Accountant Fees and Services | |
| | |
PART IV |
Item 15. | Exhibit and Financial Statement Schedules | |
| Item 16. | Form 10-K Summary | |
| Signatures | |
PART I
In this Annual Report on Form 10-K, "we," "our," "us," "Carvana," and "the Company" refer to Carvana Co. and its consolidated subsidiaries, unless the context requires otherwise.
Forward-Looking and Cautionary Statements
This Annual Report on Form 10-K, as well as information included in oral statements or other written statements made or to be made by us, contain statements that constitute "forward-looking statements" within the meaning of the Private Securities Litigation Reform Act of 1995. Forward-looking statements are neither historical facts nor assurances of future performance. Instead, they are based on our current beliefs, expectations, and assumptions regarding the future of our business, future plans and strategies, and other future conditions. Forward-looking statements can be identified by words such as "anticipate," "believe," "contemplate," "continue," "could," "envision," "estimate," "expect," "intend," "may," "ongoing," "plan," "potential," "predict," "project," "should," "target," "will," "would," and other similar expressions or variations or negatives of these words, although not all forward-looking statements contain these identifying words. Examples of forward-looking statements include, among others, statements we make regarding:
•expectations relating to the used car market and our industry;
•macroeconomic conditions, economic slowdown or recessions;
•future financial position;
•expectations and plans regarding our business strategy;
•budgets, projected costs, and plans;
•future industry growth;
•financing sources;
•short-and long-term liquidity;
•the impact and outcome of litigation, government inquiries, and investigations; and
•all other statements regarding our intent, plans, beliefs, or expectations or those of our directors or officers.
We may not actually achieve the plans, intentions, or expectations disclosed in our forward-looking statements, and you should not place undue reliance on our forward-looking statements. Actual results or events could differ materially from the plans, intentions, and expectations disclosed in the forward-looking statements we make. Important factors that could cause actual results and events to differ materially from those indicated in the forward-looking statements include, among others, those discussed under Part I, Item 1A —"Risk Factors" in this Annual Report on Form 10-K. The forward-looking statements in this Annual Report on Form 10-K represent our views as of the date hereof. We undertake no obligation to publicly update any forward-looking statements whether as a result of new information, future developments or otherwise.
Market and Industry Data
Some of the market and industry data contained in this Annual Report on Form 10-K is based on industry publications or other publicly available information. Although we believe that these third-party sources are relevant and reliable, we have not independently verified and cannot assure you as to the accuracy or completeness of this information. As a result, you should be aware that the market and industry data contained herein, and our beliefs and estimates based on such data, may not be reliable.
ITEM 1. BUSINESS.
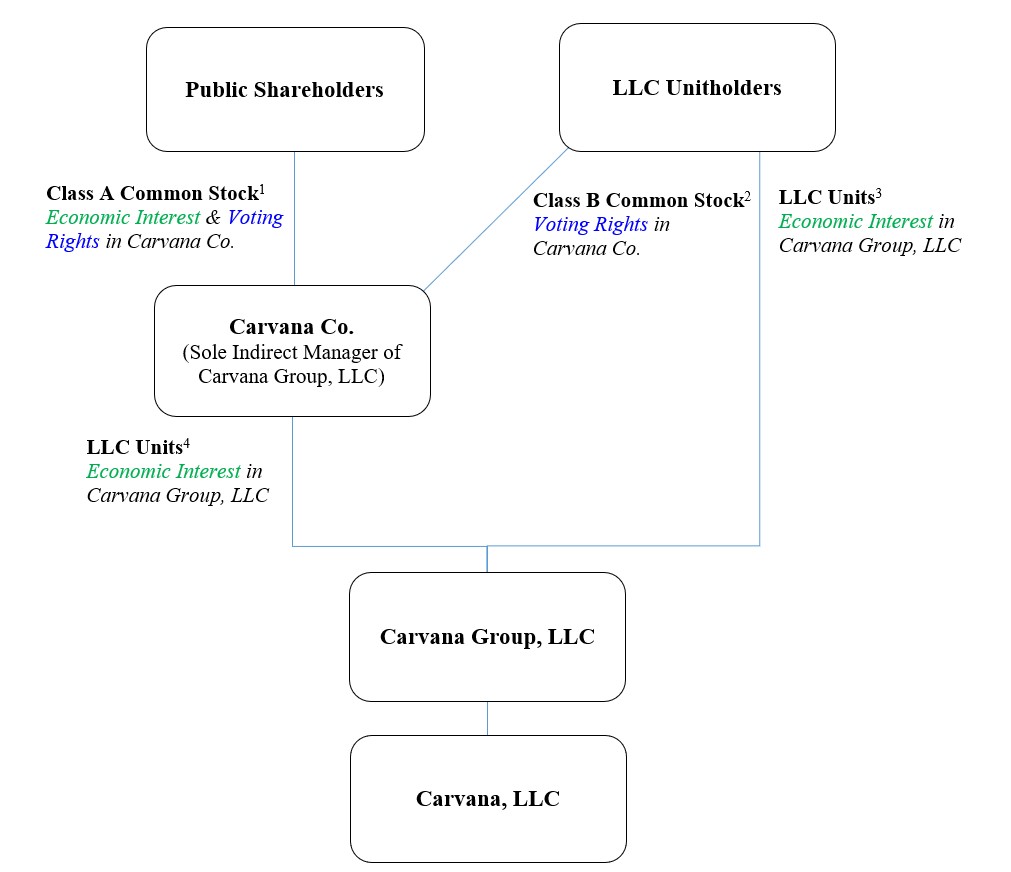
Carvana Co. is a holding company that was formed as a Delaware corporation in 2016 in order to operate the business of Carvana Group, LLC and its subsidiaries (collectively, "Carvana Group"). Carvana Co. Class A common stock trades on the New York Stock Exchange ("NYSE") under the symbol "CVNA."
Our Company
Carvana is the leading e-commerce platform for buying and selling used cars. We are transforming the used car buying and selling experience by giving consumers what they want - a wide selection, great value and quality, transparent pricing, and a simple, no pressure transaction. Our differentiated business model combines a comprehensive online sales experience with a vertically integrated supply chain, designed to sell high-quality vehicles to our customers transparently and efficiently at a low
price. The automotive retail industry is large – with approximately 36 million used auto retail transactions in the United States (“U.S.”) in 2023 according to Cox Automotive – and highly fragmented – with the top 10 used auto retailers in the U.S. accounting for less than 10% of the market share in 2023 according to Automotive News. These dynamics create an exceptional opportunity for disruption that our custom-built business model can capitalize on to remain well-positioned for long term growth. Over the years we have leveraged our growing logistics network, which spans 316 metropolitan statistical areas, and our in-house distribution network, servicing over 80% of the U.S. population as of December 31, 2024, to sell 2.2 million retail vehicles, generating $63.7 billion in total revenue since inception in 2012 through December 31, 2024.
Vehicle Acquisition. We primarily acquire our used vehicle inventory directly from customers, used car auctions, and wholesale used vehicle suppliers, including retail marketplace partners. Acquiring inventory directly from customers when they trade in or sell us their vehicles in a one-way transaction eliminates auction fees and provides for a more diverse set of vehicles. After answering a few questions about the vehicle condition and features, our online tool provides customers with an automated, conditional offer for their existing vehicle that can be applied to any vehicle purchase or paid directly without an associated vehicle purchase. Our online tool then allows customers to schedule a time to have their existing vehicle picked up at their home, and receive payment. We designed this process to be convenient, seamless, and to eliminate the need for a customer to visit a dealership or negotiate a private sale.
Inspection and Reconditioning. Once we acquire a vehicle, we leverage our in-house logistics network or a vendor to transport the vehicle to one of our inspection and reconditioning centers ("IRC") or auction locations with reconditioning capabilities (together with IRCs "Reconditioning Sites"), at which point the vehicle enters our inventory management system. We then begin an inspection process covering controls, features, brakes, tires, and cosmetics. Each Reconditioning Site leverages proprietary inventory management technology and includes trained technicians, vehicle lifts, paintless dent repair, and paint capabilities and receives on-site support from vendors with whom we have integrated systems to expedite ready access to parts and materials. We have a uniform set of cosmetic standards across all Reconditioning Sites to provide a consistent customer experience. When an inspection is complete, we estimate the necessary reconditioning cost for the vehicle to meet our standards and expected timing for that vehicle to be made available for sale on our website. Vehicles that do not meet Carvana standards are sold wholesale, either through our wholesale marketplace platform or through third party auctions.
Online Search and Shopping Experience. We offer a mobile-optimized website, where prospective retail car buyers can immediately begin browsing, researching, filtering, and identifying their vehicle of choice from an inventory of over 53,000 total website units that we offer for sale as of December 31, 2024. We leverage our patented, automated photo technology to offer an annotated virtual vehicle tour, which includes a 360-degree view of the interior and exterior of the actual vehicle and allows customers to view vehicle imperfections through high-definition photography. Our website also features integrations with various vehicle data providers for vehicle feature and option information to assist customers with purchase decisions.
Financing. We offer integrated financing using our proprietary loan origination platform. Customers who choose to apply for our in-house financing fill out a short prequalification form, and, if approved, are nearly instantaneously presented with an interactive set of conditional financing terms generated by our proprietary credit scoring and deal structuring algorithms for every vehicle in our inventory. Our financing tool intuitively and transparently shows the relationship between down payment, monthly payment and loan term to assist the customer in selecting the best payment plan tailored to their specific needs. This pre-approval involves a short process that does not impact customers’ credit unless they pursue a purchase and finance the transaction. For customers who choose not to utilize our financing, we also accept payment in cash or financing from third party lenders, such as banks or credit unions.
Complementary Products. As part of the integrated purchasing process, customers have the option to protect their vehicle with a vehicle service contract (“VSC”). VSCs provide customers with protection against the costs of certain mechanical repairs after the expiration of their vehicle’s original manufacturer warranty. In most states, customers financing their purchase with us are also offered guaranteed asset protection ("GAP") waiver coverage during checkout to provide customers with protection for the value of the loan. We have also partnered with Root, Inc. ("Root"), an online car insurance company, to offer an integrated auto insurance solution, through which customers in most states may conveniently access auto insurance directly from the Carvana e-commerce platform. We collectively refer to VSC, GAP, and auto insurance as complementary products.
Nationwide Logistics Network and Distinctive Fulfillment Experience. We have developed proprietary logistics software and an in-house nationwide delivery network which is aimed at allowing us to predictably and efficiently transport cars while providing customers with a distinctive fulfillment experience. Our logistics network and technologies that support it are based on a "hub and spoke" model, which connects Reconditioning Sites to vending machines and hubs via our fleet of multi-car and single-car haulers. This allows us to efficiently manage locations, routes, route capacities, trucks, and drivers while also dynamically optimizing for speed and cost. This proprietary logistics infrastructure enables us to offer our customers and
operations team highly accurate predictions of vehicle availability, to minimize delays, and promote a seamless and reliable customer experience. We offer customers in our markets a home delivery option that is typically conducted by a Carvana employee on a branded hauler. Customers in certain markets can also pick up their vehicles at one of our patented car vending machines, which are multi-story glass towers that store purchased vehicles, or at other customer-facing locations. As of December 31, 2024, we estimate that 75% of the U.S. population is within 100 miles of an IRC or auction site, which shortens the distance from our inventory pools to our customers to reduce delivery times.
Post-sale customer support. After purchase, our customer advocates handle post-sale coordination and assistance, including facilitating returns or exchanges under our seven-day return policy. As of December 31, 2024, customers rated us an average of 4.7 out of 5.0 from over 215,000 surveys on our website since inception, fostering repeat business and a strong referral network.
Strengths and Competitive Advantages
We aim to deliver the best selection, the best value, and the best experience for used car buyers and sellers. Since our inception, we have been developing and leveraging the following key strengths, which we believe provide for significant competitive advantages.
Purpose-Built Vertically Integrated E-commerce Platform
We believe our proprietary technology and vertically integrated business model allow us to enjoy a significantly lower variable cost structure versus traditional dealerships and to provide substantial value to our customers by providing a seamless, best-in-class car buying and selling experience. Our vertically integrated platform gives us control of all critical operations and transaction elements to allow us to facilitate a fast, simple, and consistent user experience. We control the algorithms that help determine the vehicles we make available to our customers, the prices of those vehicles, the financing terms offered to customers, complementary products, and the purchase prices and trade-in values we offer. Additionally, we control the logistics infrastructure that enables us to offer customers fast, specific, and reliable delivery and pick-up times. We have invested heavily in our customer-facing website to provide an intuitive user interface and have built a team of in-house customer advocates that is dedicated to providing first-rate customer service.
Differentiated Shopping Experience
We have developed technology that makes the online vehicle purchasing process intuitive, transparent and fun. Our patented photo technology, paired with custom photo processing and display technology, provides an interactive way for consumers to search for vehicles and take a virtual tour of the interior and exterior of a vehicle using annotated, high-definition photography. We believe this technology, coupled with our inspection process, uniform cosmetic standard, and seven-day return policy, generates the confidence and trust in our platform needed to buy a car online.
Proprietary Financing Technology
Our differentiated financing solutions provide customers with nearly instantaneous credit terms as well as flexibility and transparency in financing their vehicle purchase. We preapprove thousands of down payment and monthly payment combinations that allow customers to choose their preferred financing. We preapprove these terms utilizing "soft credit checks" which do not impact a customer’s credit unless they complete a purchase and financing transaction. Our proprietary credit and underwriting platform is trained on over ten years of Carvana-originated loans, giving us information to make credit decisions aimed to optimize risk, vehicle characteristics, deal structure, and customer credit. We believe this significantly enhances the quality of the loans that we generate and the value we can capture when we sell them through securitization transactions or to our financing partners.
Efficient Logistics Network and Distinctive Fulfillment Experience
We have developed proprietary logistics software and an in-house delivery network that differentiates us from competitors, and which is designed to predictably and efficiently transport cars while providing customers with a distinctive fulfillment experience. Our home delivery and pickup is typically conducted by a Carvana employee on a branded hauler, as soon as the same day in certain markets. Customers in certain markets can also pick up or drop off their vehicles at one of our patented car vending machines, or at another customer-facing location. Our vending machines provide an attractive and unique pickup experience for our customers and develop brand awareness while lowering our variable fulfillment expenses. Following the
opening of a vending machine in one of our markets, our market penetration has typically seen a meaningful increase while our variable operating costs per vehicle sold have typically decreased.
Scaled Used Vehicle Infrastructure
As of December 31, 2024, we leverage a network of Reconditioning Sites throughout the U.S. and proprietary software for our vehicle reconditioning and logistics activities that required significant investment in time and capital to develop. This infrastructure gives us capacity to inspect and recondition more than 1 million cars per year at full utilization.
Scale Driving Powerful Network Effects
Our business benefits from powerful network effects. As of December 31, 2024, we offer all customers a nationally pooled inventory of over 53,000 high-quality used vehicles on our website. Our customer research indicates that size and breadth of selection are primary determinants of a customer's choice of retailer. We use proprietary algorithms to optimize our inventory acquisition based on extensive used vehicle market and customer behavior data. Furthermore, our nationally pooled inventory system maximizes the scope of vehicle selection for our customers in any given location, increasing the likelihood that customers are able to find the make, model, year, and color combination that they desire.
Business and Growth Strategies
The foundation of our business is retail vehicle unit sales, which drives the majority of our revenue and allows us to capture additional revenue streams associated with financing, complementary products offerings, as well as trade-in vehicles. As we evolve, we believe we will continue to improve profitability associated with these revenues and expand our offering of complementary products. However, all of these additional revenue opportunities are derived from retail vehicle unit sales and, as a result, our business strategies are primarily focused on this metric.
Our ability to generate retail vehicle sales is a function of our market penetration in existing markets, the number of markets we operate in, and our ability to build and maintain our brand by offering great value, transparency, and outstanding customer service.
Since the launch of our first market twelve years ago, our vertically integrated, customer-centered offering has enabled us to become one of the largest and fastest growing used automotive retailers in the U.S. as of December 31, 2024. In 2022 and 2023, as a result of changes in the economy, the market, and the industry, we shifted our focus to driving profitability through fundamental operating efficiency. We believe these profitability initiatives allowed us to deliver substantial cost efficiency improvements and build a strong operational foundation for future growth. Throughout 2024, we remained focused on driving operational efficiency and profitability while also shifting towards the long-term phase of driving profitable growth. In this early stage, we are pursuing growth at a rate that seeks to balance the long-term benefits of scale with the continued opportunities we see to further enhance customer experiences. We have physical infrastructure for continued growth, which gives us capacity to recondition over approximately 1 million vehicles per year.
Further, the acquisition of ADESA US Auction, LLC in 2022 provided us with 56 additional locations that could be built out to increase our reconditioning capacity. Six of these ADESA auction sites have been built out to provide IRC capabilities, and the remaining sites provide continued potential for further growth.
With more than 36 million transactions in 2023, according to Cox Automotive, the used vehicle retail market represents a massive, highly fragmented industry, of which Carvana currently holds only approximately 1% of the market share. We believe we are well positioned to benefit from secular e-commerce trends. According to Federal Reserve Economic Data (FRED), e-commerce as a share of non-automotive retail has risen steadily for over 20 years and made up approximately 18% of all non-automotive retail transactions as of 2023. Within the automotive retail industry, e-commerce adoption has lagged behind that of other retail segments, but we believe that as customers continue becoming more accustomed to making larger purchases online, e-commerce will make up an increasing share of automotive retail as it has in other retail segments. The large scale and fragmentation of the used retail vehicle market, coupled with the ongoing adoption of e-commerce more broadly, presents a differentiated opportunity for continued growth. Carvana intends to take advantage of this market opportunity by executing the following key elements of our growth strategy:
Increase Sales Through Further Penetration of Our Existing Markets
Our growth has historically been driven by opening new markets and increasing market penetration in our existing markets. Our long-term plan includes marketing and actively building our brand image and awareness in existing markets by improving the speed and efficiency of our operations and increasing our inventory size.
Optimize Our Inventory Selection
We seek to continue to optimize and broaden the selection of vehicles we make available to our customers. Expanding our inventory selection increases the likelihood that each visitor to our site finds a vehicle that matches his or her preferences and benefits all existing markets simultaneously due to our nationally pooled inventory model. Expanding our inventory selection depends on our ability to source and acquire a sufficient number of appropriate used vehicles, including acquiring more vehicles from customers, to develop processes for effectively utilizing capacity in our Reconditioning Sites, and to hire and train employees to staff these centers.
Continue to Innovate and Extend Our Technology Leadership
We are a technology-native retailer. This has allowed us to develop numerous custom-built tools designed to interact with one another to provide seamless and best-in-class customer experiences. In the long term, we intend to continue to make significant investments in improving and adding to our customer offering. We believe that the complexity of automotive retail transactions provides substantial opportunity for technology investment and that our leadership and continued growth will enable us to responsibly invest in further differentiating ourselves from our competitors’ offerings.
Develop Broad Consumer Awareness of Our Brand
We believe our brand development efforts meaningfully impact our ability to acquire new customers. We intend to continue attracting new customers through advertising, customer referrals, customers selling us their vehicles, public relations, and social media. We operate 39 vending machines across the country which have catalyzed word-of-mouth publicity and increased awareness of our brand. Further, we believe that the shift of customer preference toward e-commerce has been, and will continue to be, a long-term asset to our brand awareness and growth.
Generate Referrals and Repeat Customers
We believe our growth is enhanced by providing a superior customer experience, which drives our ability to generate customer referrals and repeat sales. Our customers rated us an average of 4.7 out of 5.0 based on over 215,000 satisfaction surveys on our website from our inception through December 31, 2024. These positive reactions create opportunities for repeat customers and a strong referral network.
Develop New Products
We plan to continue leveraging our existing e-commerce and logistics infrastructure to increase monetization opportunities by introducing new complementary products and services. The car purchasing and ownership cycle provides many opportunities to add value for our customers, such as VSCs and auto insurance, and our technology expertise and process automation position us well to provide these services in differentiated ways.
Marketing
We believe our customer base is relatively similar to that of the overall market for used cars at the average price points of our vehicles, with a slight shift toward younger customers. Our sales and marketing efforts utilize a multi-channel approach, built on a seasonality-adjusted, market-based model budget. We typically utilize a combination of brand building as well as direct response channels to efficiently seed and scale our local markets. Our paid advertising efforts include, but are not limited to, advertisements through national and local television, search engine marketing, inventory site listing, social media, retargeting, organic referral, display, out-of-home, digital video, digital radio, direct mail, and branded pay-per-click channels. We believe our strong customer focus ensures customer loyalty which can drive both repeat purchases and referrals. In addition to our paid channels, we intend to attract new customers through enhancing our earned media and public relations efforts and further investing in our patented vending machines.
Competition
With tens of thousands of automotive retailers in the U.S., the used car marketplace is a highly fragmented and highly competitive industry. We believe the primary competitive factors in this market include transparency, convenience, price, selection, and vehicle quality. Our current and future competitors include:
•traditional used vehicle dealerships such as CarMax;
•internet and online automotive sites, such as Amazon, Autobytel, AutoTrader, Cars, Carfax, CarGurus, eBay Motors, Edmunds, Google, KBB, and TrueCar;
•providers of offline, membership-based car-buying services such as the Costco Auto Program;
•new and used vehicle dealers or marketplaces with e-commerce business or online platforms;
•marketplaces that could compete with our wholesale marketplace program;
•automobile manufacturers such as Ford, General Motors, Toyota, Volkswagen, Tesla, Rivian, and Lucid; and
•privately negotiated transactions.
However, we believe that our vertically integrated business model and other attributes described above provide significant competitive advantages.
Technology
Our business is driven by data and technology at all stages of the sale process, from inventory purchasing, reconditioning, photography, and annotation through online merchandising, sales, automobile financing, trade-ins, logistics, and delivery. Carvana’s proprietary, custom built, and exclusive-use technology portfolio includes:
•a decision model for consolidating internal and external data to provide profitability estimates for inventory available for purchase on the basis of quality, inventory fit, consumer desirability, relative value, expected reconditioning costs, and vehicle location;
•an inventory management system that handles vehicles from acquisition through photography;
•a suite of technology applications that automates integration of systemized standards for process flow, reconditioning standards, and parts procurement at our network of Reconditioning Sites;
•an automated photography technology system that combines high-quality photos to produce an interactive, 360-degree virtual tour of both the exterior and interior of the vehicle, and creates a 3D model of the car allowing for future innovations;
•a website that includes advanced filtering and search technology that helps customers find a car that suits their tastes;
•a logistical model to optimize the transport of purchased inventory to and from the customer;
•an automated delivery tower, or vending machine, including customer experience enhancements such as automatically generated video (suitable for posting to social media) that captures the customer’s pick-up experience;
•artificial intelligence technology used to power chatbots that streamline customer communication paths and assist customers and customer advocates in navigating the purchase process, to improve internal work efficiencies, and to enhance our recruitment and hiring processes; and
•sophisticated predictive models and application programming interfaces developed for our automobile finance services and consumer lending applications, process, and terms.
We also rely on third-party technology, including network infrastructure for our website and inventory, software to assist with customer interactions, and technology relating to our vending machines and transportation fleet.
Intellectual Property
We protect our intellectual property through a combination of trademarks, domain names, copyrights, trade secrets, patents, and contractual provisions and restrictions on access and use of our proprietary information and technology.
As of December 31, 2024, we hold 41 issued U.S. patents, which cover our vending machine technology, photo technology, website user interface technology, personalization methods for displaying digital media and imaging technology,
search and display technology, and artificial intelligence technology, and five issued international patents covering our photo technology. These patents have been held for between eight years and less than one year.
As of December 31, 2024, we have 27 domestic trademark registrations and six international trademarks in active use, including registrations for "Carvana," the Carvana design mark, the Carvana logo, and various slogans, and we are the registered holder of a variety of domestic and international domain names, including "carvana.com."
In addition to the protection provided by our intellectual property rights, we enter into confidentiality and proprietary rights agreements with our new employees, consultants, contractors, and business partners. We also require all new employees and most contractors to execute intellectual property assignment agreements and certain third parties to enter into nondisclosure agreements. Finally, we further control the use of our proprietary technology and intellectual property through provisions in both the general and product-specific terms of use on our website.
We have a cross-license agreement with DriveTime Automotive Group, Inc. (together with its subsidiaries and affiliates, other than us, "DriveTime"), a related party of the Company, pursuant to which DriveTime has obtained limited licenses to some of our intellectual property.
Human Capital
Carvana’s mission is to change the way people buy cars, and achieving that mission would not be possible without attracting, engaging, and retaining high quality team members who view their work as more than just a job. We want our workplaces safe, our benefits and wages competitive, and our culture positive and collaborative. We believe in the importance of our teams’ satisfaction and development. We continually invest in our team members by strengthening internal recruiting, talent development and engagement, as well as through committees, and programs that support our team members, supplemented by external resources, such as quarterly surveys to help gauge employee satisfaction.
We invest in our team members' development specifically by aiming to develop robust career paths and providing opportunities for training, mentorship, and upward mobility. We are an equal opportunity employer, and it is important to us that our development plans and programs are inclusive. Our Carvana Communities program supports our team in creating and leading company affinity groups open to all employees, with a mission of support, inclusion, and connection throughout Carvana. Our Carvana Cares program also reflects our shared values by providing platforms and resources to give back to the community and support causes that are important to our team members, customers, and communities. Additionally, our Learning Management System provides broader access to training and development information and resources across Carvana to foster a culture of continual growth and enrich the work environment for all teammates.
We consider our relationship with our team to be positive, and it is in large part because of their passion and hard work that Carvana is now one of the largest used automotive retailers in the U.S. As of December 31, 2024, we had over 17,400 full-time and part-time employees.
Seasonality
We expect to experience seasonal and other fluctuations in our quarterly operating results, including as a result of macroeconomic conditions, which may not fully reflect the underlying performance of our business. Used vehicle sales generally exhibit seasonality with sales peaking late in the first calendar quarter and diminishing through the rest of the year, with the lowest relative level of vehicle sales expected to occur in the fourth calendar quarter. Due to our historical and current rapid growth, our overall sales patterns in the past have not always reflected the general seasonality of the used vehicle industry. However, as our business continues to mature, our results may become more reflective of typical market seasonality. Used vehicle prices also exhibit seasonality, with used vehicles generally depreciating at a faster rate in the fourth and first quarters of each year and a slower rate in the second and third quarters of each year, all other factors being equal.
Organizational Structure
The following chart summarizes our organizational structure as of December 31, 2024. This chart is provided for illustrative purposes only and does not purport to represent all legal entities owned or controlled by us (footnote shares and units in thousands):
(1)133,271 shares of Class A Common Stock issued and outstanding as of December 31, 2024, representing a 62.3% economic interest in Carvana Group, LLC through Carvana Co.
(2)79,119 shares of Class B Common Stock issued and outstanding as of December 31 2024.
(3)100,953 Carvana Group LLC Units (the "LLC Units"), held by holders of such units (the "LLC Unitholders"), issued and outstanding as of December 31, 2024, representing 80,713 shares of Class A Common Stock on an as-exchanged basis (adjusted for participation thresholds and the closing price of Class A Common Stock on December 31, 2024) and a 37.7% economic interest in Carvana Group, LLC.
(4)166,419 LLC Units held by Carvana Co., issued and outstanding as of December 31, 2024.
Government Regulation
Industry and Vehicle Dealer Laws and Regulations
Various aspects of our business are or may be subject to U.S. federal, state, and municipal regulation. In particular, the advertising, sale, purchase, financing, and transport of motor vehicles are highly regulated by states in which we do business and by the U.S. federal government. The regulatory bodies that regulate the Company and our business include at the federal level: the Consumer Financial Protection Bureau, the Federal Trade Commission, the United States Department of Transportation, the Occupational Health and Safety Administration, the Department of Justice, the U.S. Securities and Exchange Commission (the "SEC"), and the Federal Communications Commission; at the state level: various state dealer licensing authorities, state consumer protection agencies including state attorney general offices, and state financial regulatory agencies; and at the municipal level: various municipal authorities covering licensing, zoning, occupancy, and tax obligations. We are subject to compliance audits of our operations by many of these authorities.
Certain states have concluded that our activities are subject to vehicle dealer licensing laws, requiring us to maintain a used vehicle dealer license in order to conduct business in that state. In certain other states, we have elected to obtain a vehicle dealer license to maximize operational flexibility and efficiency and invest in relationships with state regulators. As of December 31, 2024, we have at least one licensed facility in 39 states throughout the U.S.
Most states regulate retail installment sales, including setting a maximum interest rate, caps on certain fees, or maximum amounts financed. In addition, certain states require that we file a notice of intent or have a sales finance license or an installment sellers license in order to solicit or originate installment sales in that state. In certain other states, we have chosen to obtain such a license to invest in relationships with state regulators. We have obtained a sales finance license or installment seller license, or have filed consumer credit notices, in 31 states throughout the U.S., as of December 31, 2024.
Environmental Laws and Regulations
We are subject to a variety of federal, state, and local environmental laws and regulations that pertain to our operations. The regulations concern air and water quality, as well as material storage, handling, and disposal. The regulations also regulate our use and operation of gasoline dispensing tanks and equipment, oil tanks, and paint booths among other things. Our business involves the use, handling, and disposal of hazardous materials and wastes, including motor oil, gasoline, solvents, lubricants, paints, and other substances. We manage our compliance through permitting, operational, and engineering controls. Compliance with these laws and regulations did not have a material effect on our capital expenditures, earnings or competitive position in 2024 and is not expected to in 2025.
For a discussion of the various risks we face from regulation and compliance matters, see Part I, Item 1A "Risk Factors—Risks Related to Our Business—We operate in several highly regulated industries and are subject to a wide range of federal, state, and local laws and regulations. Changes in these laws and regulations, or our actual or alleged failure to comply with such laws and regulations, could have a material adverse effect on our business, results of operations, and financial condition."
Available Information
General information about us can be found at investors.carvana.com. The information contained on or connected to our website is not incorporated by reference into this Annual Report on Form 10-K and should not be considered part of this or any other report filed with the SEC. Our Annual Report on Form 10-K, Quarterly Reports on Form 10-Q and Current Reports on Form 8-K, as well as any amendments to those reports, are available free of charge through our website as soon as reasonably practicable after we file them with, or furnish them to, the SEC. The SEC maintains a website at www.sec.gov that contains reports, proxy statements, and other information regarding SEC registrants, including Carvana Co.
ITEM 1A. RISK FACTORS.
Described below are certain risks to our business and the industry in which we operate. You should carefully consider the risks described below, together with the financial and other information contained in this Annual Report on Form 10-K and in our other public disclosures. If any of the following risks actually occurs, our business, financial condition, results of operations, cash flows and prospects could be materially and adversely affected. As a result, our future results could differ materially from historical results and from guidance we may provide regarding our expectations of our future financial performance, and the trading price of our Class A common stock could decline.
Risk Factors Summary
The following is a summary of the principal factors that make an investment in our securities speculative or risky, all of which are more fully described below in this section. This summary should be read in conjunction with the full description of "Risk Factors" in this section and should not be relied upon as an exhaustive summary of the material risks facing our business. In addition to the following summary and the information in this section, you should consider the other information contained in this Annual Report on Form 10-K before investing in our securities.
Risks Related to Our Business
•risks related to the larger automotive ecosystem, including consumer demand, global supply chain challenges, and other macroeconomic issues;
•our ability to raise additional capital to pursue our objectives;
•our ability to effectively manage our rapid growth;
•our ability to maintain customer service quality and reputational integrity and enhance our brand;
•the seasonal and other fluctuations in our quarterly and annual operating results;
•our relationship with DriveTime and other entities affiliated with our controlling stockholder;
•our ability to compete in the highly competitive industry in which we participate;
•the changes in prices of new and used vehicles;
•our ability to acquire and expeditiously sell desirable inventory;
•our ability to comply with the laws and regulations to which we are subject;
•our ability to grow complementary product and service offerings;
•our reliance on internal and external logistics to transport our vehicle inventory;
•our ability to protect the personal information and other data that we collect, process and store;
•breaches in our cybersecurity measures and disruptions in availability and functionality of our systems, website, and mobile application;
•our ability to protect our intellectual property, technology, and confidential information;
•our ability to obtain adequate insurance and the affordability of such insurance;
•our dependence on key personnel to operate our business;
•the risk of receiving less than the full amount of benefit we expect to receive from our minority equity investment in Root, Inc.;
•risks associated with acquisitions and strategic initiatives;
•legal proceedings; and
•our management’s accounting judgments and estimates, as well as changes to accounting policies.
Risks Related to Our Automotive Finance Receivables
•our dependence on the sale of automotive finance receivables for a substantial portion of our gross profit;
•our access to capital markets at competitive rates and in sufficient amounts;
•errors in contracts with customers, which could render them unenforceable or ineligible for sale;
•the risks related to greater credit losses or prepayments with respect to our automotive finance receivables held; and
•the risk retention rules.
Risks Related to Our Organizational Structure
•the nature of being a holding company;
•the potential for conflicts of interest between our stockholders and LLC Unitholders; and
•risks related to payments due to LLC Unitholders under the Tax Receivable Agreement, if we derive benefits from using certain tax attributes; and
•our status as a "controlled company."
Risks Related to Our Indebtedness and Liquidity
•our substantial indebtedness; and
•our ability to generate sufficient cash flow.
Risks Related to Ownership of our Class A Common Stock
•the volatile trading price of our Class A common stock;
•the Garcia Parties’ control us and their interests may conflict with our or our stockholders’ interests;
•dilution due to issuance of additional Class A common stock or LLC Units in the future;
•we may issue shares of preferred stock in the future;
•Delaware law and our charter may prevent stockholders from changing decisions made by management; and
•the Court of Chancery of the State of Delaware is the sole and exclusive forum for certain stockholder litigation.
Risks Related to Our Business
Our business is subject to risks related to the larger automotive ecosystem, including consumer demand, global supply chain challenges, and other macroeconomic issues.
Our business is affected by industry and economic conditions. Purchases of new and used vehicles are typically discretionary for consumers and have been, and may continue to be, affected by negative trends in the economy. Consumer purchases of new and used vehicles generally decline during recessionary periods and other periods in which disposable income is adversely affected. Inflationary impacts on labor, materials, fuel, and other vehicle costs and services, as well as scarcity of certain products, have caused increased vehicle prices, which have adversely affected, and may continue to adversely affect, the market for used vehicles. In 2022 and 2023, as a result of changes in the economy, the market, and the industry, we shifted our focus to driving profitability through fundamental operating efficiency. Even though we were able to shift our focus towards long-term growth in 2024, if economic conditions worsen or a recession occurs, we have been and may again be required to take stricter measures to protect our business. Those measures, including restructurings and cost savings, could materially adversely affect our business, operations, and financial results.
Adverse conditions affecting one or more automotive manufacturers could also impact the supply of vehicles and our inventory, change consumer car purchasing behaviors, and have a material adverse effect on our sales and results of operations. Manufacturer recalls and the increased regulatory scrutiny surrounding selling used vehicles with open safety recalls could adversely affect used vehicle sales or valuations, cause us to temporarily remove vehicles from inventory, cause us to sell affected vehicles at a loss, cause us to incur increased costs, and expose us to litigation and adverse publicity related to the sale of recalled vehicles. Further adverse conditions, including labor disruptions at manufacturer facilities, may affect the market for new vehicles, thereby affecting the supply and market for used vehicles.
Increased environmental regulation has also made, and may in the future make, used vehicles more expensive and less desirable for consumers. Our business may also be negatively affected by challenges to the larger automotive ecosystem, including global health crises, such as the past COVID-19 pandemic, which may impact workforces, operations, and consumer behavior; increase in urbanization, which may decrease demand for vehicles due to the popularity of rideshare services such as Uber and Lyft; global supply chain challenges; military conflicts, such as the conflict in Ukraine and the Middle East, or changes in relations between countries, such as between the United States, China, and Taiwan; and other macroeconomic issues. New technologies such as autonomous driving software and the increasing popularity of electric vehicles also have the potential to change the dynamics of vehicle ownership in the future. In addition, technology related to generative AI is advancing rapidly, and its future impact on the automotive ecosystem is unknown. Finally, any new or increased tariffs or other trade restrictions implemented by the U.S. federal government or other countries may change vehicle supply or the supply of important vehicle parts and components, as well as customer vehicle purchasing behavior. Any of the foregoing could have a material adverse effect on our business, results of operations and financial condition.
We may require additional capital to pursue our business objectives and respond to business opportunities, challenges, or unforeseen circumstances. If such capital is not available to us, our business, operating results, and financial condition may be harmed.
We may require additional capital to pursue our business objectives and respond to business opportunities, challenges, or unforeseen circumstances, including to increase our marketing expenditures to improve our brand awareness, build and maintain our inventory of quality used vehicles, develop new products or services, further improve existing products and services, enhance our operating infrastructure, fund our growth or expansion into new markets, implement strategic initiatives,
or acquire complementary businesses and technologies. Accordingly, we may need to engage in equity or debt financings to secure additional capital. However, additional capital may not be available when we need it, on terms that are acceptable to us, or at all. In addition, any debt financing that we secure in the future could involve restrictive covenants which may make it more difficult for us to obtain additional capital and to pursue business opportunities. For example, the indentures governing our Senior Secured Notes limit our ability and certain of our subsidiaries’ ability to, among other things, incur additional debt or issue preferred stock, create new liens, create restrictions on intercompany payments, pay dividends and make other distributions, designate unrestricted subsidiaries, redeem or repurchase stock or prepay subordinated indebtedness, make certain investments or certain other restricted payments, guarantee indebtedness, sell certain kinds of assets, including assets securing our Senior Secured Notes, enter into certain types of transactions with affiliates, and effect mergers or consolidations. See Part II, Item 7 "Management's Discussion and Analysis of Financial Condition and Results of Operations—Liquidity and Capital Resources."
Volatility in the credit markets may also have an adverse effect on our ability to obtain debt financing. If we are unable to obtain adequate financing or financing on terms satisfactory to us when we require it, our ability to continue to pursue our business objectives and to respond to business opportunities, challenges or unforeseen circumstances could be significantly limited, and our business, operating results, financial condition and prospects could be adversely affected.
Our rapid growth may not be indicative of our future growth and, if we continue growing rapidly, we may not be able to manage our growth and profitability effectively.
Our history has often been characterized by rapid growth. For our revenues and profits to grow, we need a healthy industry and macroeconomic environment, and to successfully increase our penetration in existing markets, enter new markets, acquire more new and repeat customers, further improve the quality of our product offering, features, and complementary products and services, introduce high quality new products, services, and features, expand our brand awareness, and carry sufficient inventory with high enough quality and low enough cost to meet the demand for our vehicles. We have no control over the industry and macroeconomic environment we face, as occurred in 2022 and 2023, and our business strategy has and may be adversely affected as a result. Further, even if we succeed and our revenue and profits increase, we may not achieve historical rates of growth.
Our historical and current rapid growth has placed and may continue to place significant demands on our management and our operational and financial resources. We have in the past expended, and may again expend, substantial financial and other resources on marketing and advertising, inventory expansion, production capacity expansion, and general administration expenses related to being a growing public company. If we cannot manage our growth effectively to maintain profitability, as well as the quality and efficiency of our customers’ car-buying and selling experience, our business could be harmed and our results of operations and financial condition could be materially and adversely affected.
Our failure to maintain our reputation and to otherwise maintain and enhance our customer service quality and brand could adversely affect our business, sales, and results of operations.
Our business model is based on our ability to provide customers with a transparent and simplified solution to car buying and selling that will save them time and money. Accordingly, our ability to consistently deliver a high-quality experience and our reputation as a company of integrity are critical to our success. Thus, we rely heavily on marketing and advertising to increase brand visibility. If we fail to maintain the high standards on which our reputation is built, or if an actual, or alleged failure of these standards occurs that damages this reputation, it could adversely affect consumer trust, customer demand, and our marketing and branding efforts, and have a material adverse effect on our business, sales, and results of operations. Even the perception of a decrease in the quality of our customer service or brand could impact our results. The operationally intensive aspect of our offering and the nature of automotive retail that necessitates the use of third-party vendors and systems to complete certain ancillary parts of the customer transaction (e.g., vehicle inspections, submitting title and registration paperwork to vendors or state entities) makes maintaining the quality of our customer experience a particularly difficult challenge. For example, we have been the subject of various complaints relating to the timely delivery of certificates of title and registration, and vehicle quality. While we do not believe these claims are material, irrespective of their validity, any claims, complaints, or negative publicity could diminish customer confidence in our platform and adversely affect our brand. The use of social media increases the speed with which information, misinformation, and opinions can be shared and thus the speed with which our reputation can be affected. Negative or inaccurate postings, articles, or comments on social media, the internet, or the press about us have, from time to time, generated negative publicity that damages the reputation of our brand. If we fail to correct or mitigate misinformation or negative information about us, the vehicles we offer to sell or purchase, our customer experience, or any aspect of our brand, including information spread through social media or traditional media channels, it could have a material adverse effect on our business, sales, and results of operations.
We experience seasonal and other fluctuations in our quarterly and annual operating results, which may not fully reflect the underlying performance of our business.
Our quarterly and annual results of operations, including our revenue, gross profit, and cash flow, vary from quarter to quarter and year to year based in part on, among other things, consumers’ car-buying patterns. Used vehicle sales generally exhibit seasonality with sales typically peaking late in the first calendar quarter (coinciding with the time when the federal government issues tax refunds) and diminishing through the rest of the year, with the lowest relative level of sales expected to occur in the fourth calendar quarter. Due to our historical and current rapid growth, our overall sales patterns in the past have not always reflected the general seasonality of the used vehicle industry. However, as our business and markets continue to mature, we expect our results to become more reflective of typical market seasonality. Used vehicle prices also exhibit seasonality, with used vehicles generally depreciating at a faster rate in the fourth and first quarters of each year and a slower rate in the second and third quarters of each year, all other factors being equal. Other factors that cause our quarterly and annual results to fluctuate include, without limitation:
•profitability or other initiatives;
•fluctuations in consumer demand, vehicle supply, and labor supply due to macroeconomic conditions;
•the timing of sales of our automotive finance receivables;
•our ability to attract new customers;
•changes in the competitive dynamics of our industry;
•the regulatory environment;
•expenses associated with unforeseen quality issues and manufacturer recalls;
•the speed, persistence, and aggregate level of inflation;
•the pace and level of changes in benchmark interest rates; and
•litigation or other claims against us.
In addition, a significant portion of our expenses are fixed and do not vary proportionately with fluctuations in revenues. Accordingly, our results in any quarter or year may not indicate the results we may achieve in any subsequent quarter or for the full year, and period-to-period comparisons of our operating results may not be meaningful.
We maintain a business relationship with DriveTime Automotive Inc. and other entities affiliated with our controlling stockholders for certain services and processes.
We maintain a business relationship with DriveTime, a related party due to the Garcia Parties’ control and ownership of substantially all of the interests in DriveTime. We benefit from our relationship and a series of arrangements with DriveTime and its affiliates that cannot be assumed to have been negotiated at arm’s length. We continue to periodically engage DriveTime, its affiliates, and other entities controlled by our controlling stockholder to provide us with certain services, including lease agreements and the administration of VSCs. DriveTime has also in the past and may in the future purchase or sell certain vehicles or automotive finance receivables from or to us. Finally, before and after we sell automotive finance receivables originated by us, DriveTime performs ongoing servicing and collections. There can be no assurance that DriveTime and the other affiliates will continue these arrangements on similar terms, or at all, and as a result our financial condition and results of operations may be adversely affected and historical costs may not always accurately reflect future costs and expenses.
We participate in a highly competitive industry; pressure from existing and new companies may adversely affect our business and operating results.
The used car marketplace is a highly fragmented and highly competitive industry. We face significant competition from companies that provide listings, information, lead generation, and car-buying and selling services designed to reach businesses and consumers and enable dealers to reach these consumers and inventory sources. Our current and future competitors may include:
•traditional used vehicle dealerships such as CarMax;
•internet and online automotive sites, such as Amazon, Autobytel, AutoTrader, Cars, Carfax, CarGurus, eBay Motors, Edmunds, Google, KBB, and TrueCar;
•providers of offline, membership-based car-buying services such as the Costco Auto Program;
•new and used vehicle dealers or marketplaces with e-commerce business or online platforms;
•marketplaces that could compete with our wholesale marketplace program;
•automobile manufacturers such as Ford, General Motors, Toyota, Volkswagen, Tesla, Rivian, and Lucid; and
•privately negotiated transactions.
We also expect that competitors, both new and existing, will continue to enter the online and traditional automotive retail industry with competing brands, business models, products, and services, which could make it difficult to acquire inventory, attract customers, and sell vehicles at a profitable price. Some of these companies may have significantly greater resources than we do and may be able to provide customers access to a greater inventory of vehicles at lower prices or purchase vehicles from consumers at higher prices while delivering a competitive online experience. Additionally, there can be no assurance we will not experience competition from DriveTime, the company from which we were spun off and with which we currently have certain business relationships. Furthermore, we have a cross-license agreement with DriveTime pursuant to which DriveTime has obtained limited licenses to some of our intellectual property, which could impact our competitive position.
Our competitors may also develop and market new technologies that render our existing or future business model, products, and services less competitive, unmarketable, or obsolete. For example, rapid changes in technology, including rideshare services and the development of autonomous vehicles (including Waymo, which is offering autonomous ride-hailing services in certain markets), could lead to a decrease in demand for our products. Competitors may also impede our ability to reach consumers or commence operations in certain jurisdictions. For example, we depend in part on internet search engines, lead generators, automotive finance partners, social networking sites, and vehicle listing sites to drive traffic to our website and mobile application and our competitors may increase their search engine optimization efforts and outbid us for search terms on various search engines, use their political influence and increase lobbying efforts, or align with Internet search engine providers to receive a higher search result page ranking than ours. Any reduction in the number of users directed to our website and mobile application through internet search engines, lead generators, automotive finance providers, social networking sites, or vehicle listing sites, could harm our business and operating results. In addition, technology related to generative AI is advancing rapidly, and its future impact on the automotive ecosystem is unknown.
Private plaintiffs and federal, state, and local regulatory and law enforcement authorities continue to scrutinize advertising, sales, financing, and insurance activities in the purchase, sale, and leasing of used vehicles. If, as a result, other automotive retailers adopt more transparent, consumer-oriented business practices, our differentiation versus those retailers could be reduced.
In addition, if one or more of our competitors, or DriveTime, were to merge or partner with another of our competitors, the change in the competitive landscape could adversely affect our ability to compete effectively. Our competitors may also establish or strengthen cooperative relationships with our current or future data providers, technology partners, or other parties with whom we have relationships, thereby limiting our ability to develop, improve, and promote our solutions. We may not be able to compete successfully against current or future competitors, and competitive pressures may harm our revenue, business, and financial results.
Our business is sensitive to changes in the prices of new and used vehicles.
Any significant changes in prices for new or used vehicles could have a material adverse effect on our revenues and results of operations. An overall increase in prices or monthly payments for used vehicles, including as a result of increased interest rates customers face when financing a vehicle, makes it difficult for certain customers to afford to purchase a vehicle. Similarly, if prices for used vehicles rise relative to prices for new vehicles, it could make buying a new vehicle more attractive to our customers than buying a used vehicle. Manufacturer incentives could also contribute to narrowing this price gap. In addition, while lower used vehicle prices reduce our cost of acquiring new inventory, lower prices could also lead to reductions in the prices at which we can sell such inventory, which could have a negative impact on gross profit. Furthermore, any significant changes in wholesale prices for used vehicles could have a material adverse effect on our results of operations by reducing wholesale margins.
Our business is dependent upon our ability to acquire desirable vehicles and parts used to recondition vehicles, and to expeditiously sell such vehicle inventory. Obstacles to acquiring and selling attractive inventory, whether because of supply, competition, or other factors, could have a material adverse effect on our business, sales, and results of operations.
We acquire vehicles for sale through numerous sources, including directly from consumers, from wholesale auctions, including our wholesale marketplace, from other large fleet operators, from original equipment manufacturers, and from other retailers, which are evaluated for mechanical soundness, consumer desirability, and relative value as prospective inventory. There can be no assurance that the supply or price of desirable used vehicles will be sufficient to meet our needs. If we fail to
adjust appraisal offers to stay in line with broader market trade-in offer trends, to recognize those trends, or to properly assess vehicles before we purchase them, it could adversely affect our ability to acquire desirable inventory. Further, we rely on agreements with third-parties to finance our vehicle inventory purchases, and may require additional financing arrangements in the future. If we are unable to extend the current financing agreements on favorable terms or at all, if the agreements expire and are not renewed, if new financing arrangements are at higher interest rates or with less favorable terms, or if we are unable to secure new financing, our inventory supply may decline. A reduction in the availability of or access to sources of desirable inventory, including parts necessary to recondition such inventory, whether due to supply chain constraints, pricing, or otherwise, could have a material adverse effect on our business, sales and results of operations.
It is also common that commercial suppliers of used vehicles regularly review their relationships with used vehicle disposition channels, such as our wholesale marketplace platform or retail marketplace offering, through written requests for proposals. Such suppliers may from time to time require us to change the way we do business as part of the request for proposal process or provide services on less favorable terms. There can be no assurance that our existing agreements will not be canceled or that we will be able to enter into future agreements with these or other suppliers on similar terms, or at all.
Finally, used vehicle inventory has typically represented a significant portion of our total assets. Having such a large portion of our total assets in the form of used vehicle inventory for an extended period of time subjects us to depreciation, inflation, and other risks, which have in the past and may again affect our results of operations. Our purchases of used vehicles are based in large part on projected demand. If actual sales are materially less than our forecasts, we have and may again experience an over-supply of used vehicle inventory. An over-supply of used vehicle inventory will generally cause downward pressure on our product sales prices and margins and increase our average days to sale. This increase has and may again subject us to accelerated depreciation of our vehicle inventory due to changes in economic conditions, which could result in reduced retail and wholesale margins. Accordingly, if we have excess inventory or our average days to sale increases, we may be unable to liquidate such inventory at prices that allow us to meet margin targets or to recover our costs, which could have a material adverse effect on our results of operations.
We operate in several highly regulated industries and are subject to a wide range of federal, state, and local laws and regulations. Changes in these laws and regulations, or our actual or alleged failure to comply with such laws and regulations, could have a material adverse effect on our business, results of operations, and financial condition.
We are subject to a wide range of evolving federal, state, and local laws and regulations, many of which may have limited to no interpretation precedent as it relates to our business model. Our sale and purchase of used vehicles and related activities, including financing our customers’ acquisition of those vehicles, shipping and delivery of vehicles and the sale of complementary products and services, are subject to state and local licensing requirements, state laws, regulations, and systems and process requirements related to title and registration, state laws regulating the sale of motor vehicles and related products and services, federal and state laws regulating advertising of motor vehicles and related products and services, federal and state consumer protection laws prohibiting unfair, deceptive or misleading practices toward consumers, customer insurance related regulations, regulations governing the internet, e-commerce or mobile commerce, anti-money laundering regulations, and labor laws.
Dealer and Finance Licensing Regulations: Regulators in jurisdictions in which we have a dealer or finance license have in the past, and may in the future, impose economic fines, suspend or revoke our license, or otherwise preclude us from buying or selling vehicles or providing financing products to customers. Regulators in jurisdictions where our customers reside but in which we do not have a dealer or financing license could require that we obtain a license or otherwise comply with various state regulations, and may seek to impose punitive fines for operating without a license or demand we seek a license in those jurisdictions, any of which may inhibit our ability to do business in those jurisdictions, increase our operating expenses and adversely affect our financial condition and results of operations.
Telephone Consumer Protection Act ("TCPA"). We utilize telephone calls and text messaging as a means of communicating with and marketing to consumers, some of which activities are regulated by the TCPA. Consumers have in the past and may in the future allege violations of the TCPA, and if we fail to adhere to or successfully implement appropriate processes and procedures in response to existing or future marketing regulations, it could result in legal and monetary liability, fines, penalties, or damage to our reputation. Further restrictions may also adversely affect our ability to attract customers.
Environmental, Transportation, and Logistics Related Laws and Regulations. Our facilities and business operations are subject to a variety of laws and regulations relating to environmental protection and health and safety. Our logistics operations, which we depend on to transport vehicles to and from wholesale auctions, our IRCs, our vending machines, our hubs, and our customers, are subject to regulation by the DOT and by the states through which our vehicles travel. New or additional
restrictive limitations on the transport of vehicles, such as the California Zero Emission Vehicle program, could increase our operating expenses.
Finance Related Laws and Regulations. The financing we offer to customers is subject to state licensing laws and to federal and state laws regulating the advertising and provision of consumer finance options, the collection of consumer credit and financial information, along with requirements related to online payments and electronic funds transfers.
The violation of any laws or regulations could inhibit our ability to execute our business, result in administrative, civil, or criminal penalties, or in a cease-and-desist order against some or all of our business activities, any of which could damage our reputation and have a material adverse effect on our business, sales, and results of operations. Additionally, even an allegation that we violated these laws by regulators, competitors, individuals, or consumers, could result in costly litigation with uncertain results. We have incurred and will continue to incur capital and operating expenses and other costs to comply with these laws and regulations.
This description of laws and regulations to which we are or may be subject is not exhaustive, and the regulatory framework governing our operations is subject to evolving interpretations and continuous change. For additional information regarding government regulations and compliance matters we are subject to, see Part I, Item 1 "Business—Government Regulation." The enactment of new laws and regulations or the interpretation of existing laws and regulations in an unfavorable way may affect the operation of our business, directly or indirectly, which could result in substantial regulatory compliance costs, civil or criminal penalties, including fines, adverse publicity, decreased revenues, and increased expenses.
Our ability to grow our complementary product and service offerings may be limited, which could negatively impact our growth rate, revenues and financial performance.
We plan to continue to utilize our online sales platform to offer additional complementary products and services, which may include services or products involving other inventory sources, new vehicles, additional trade-in options, additional financing options, various forms of insurance related to vehicle condition, property and casualty, or other insurance products, subscription services, shipping services, GAP waivers, customized accessories, leasing, or maintenance. We may incur losses or otherwise fail to enter these markets successfully. Our expansion into these markets also places us in competitive and regulatory environments with which we are unfamiliar and involve various risks, including the need to invest significant resources and the possibility that returns on such investments will not be achieved for several years, if at all. In attempting to establish new service or product offerings, we incur significant expenses and face various other challenges, such as expanding our customer advocate, management, and compliance personnel to cover new markets. In addition, we may not successfully demonstrate the value of these complementary products and services to consumers, and failure to do so would compromise our ability to successfully expand into these additional revenue streams. Any of these risks, if realized, could adversely affect our business and results of operations.
We rely on internal and external logistics to transport our inventory throughout the United States, which subjects us to business risks and costs associated with the transportation industry. Many of these risks and costs are out of our control, and any of them could have a material adverse effect on our business, financial condition, and results of operations.
We rely on a combination of internal and external logistics to transport vehicles to and from wholesale auctions, IRCs, hubs, vending machines, and our customers. As a result, we are exposed to risks associated with the transportation industry such as weather, traffic patterns, gasoline prices, recalls affecting our vehicle fleet, local and federal regulations, vehicular crashes, insufficient internal capacity, rising prices of transportation vendors, taxes, license and registration fees, insurance premiums, self-insurance levels, difficulty in recruiting and retaining qualified drivers, disruption of our technology systems, equipment supply, equipment quality, and increasing equipment and operational costs. Our failure to successfully manage our logistics and fulfillment process could cause a disruption in our inventory supply chain and distribution, which may adversely affect our operating results and financial condition.
We collect, process, store, share, transmit, disclose, and use information, including personally identifiable information, and implement artificial intelligence technology in certain offerings. Our actual or perceived failure to protect such information and data, comply with privacy and security-related requirements, mitigate data loss, and/or prevent a cybersecurity or other incident could damage our reputation and harm our business and operating results.
We collect, process, store, share, transmit, disclose, and use sensitive information and other data provided by consumers, employees, and business partners, including personally identifiable information (“PII”), to support our business operations. This information may include social security numbers, credit scores, credit card information, and financial information. Although we
have taken measures designed to safeguard such information and have received assurances from our third-party providers, our facilities and systems, and those of third-party providers, could be vulnerable to external or internal security breaches, acts of vandalism, computer viruses, misplaced or lost data, programming or human errors, or other similar events. Additionally, our increased use of artificial intelligence ("AI") technology through third party generative AI platforms and internal software to, for example, power our chatbots that streamline customer interactions and assist customers in navigating the purchasing process, improve internal work efficiencies, and enhance our recruitment and hiring processes, may result in cybersecurity, data privacy, and labor and employment risks. Uncertainty around new and emerging AI technologies, including increased regulatory oversight, may require additional investment in the development and maintenance of proprietary datasets and machine learning models and development of appropriate protections and safeguards for handling the use of customer and employee data with AI technologies, which may be costly. Furthermore, any sensitive information (including regulated, proprietary, and confidential information, including PII) that we input into a third-party generative AI platform could be leaked or disclosed to others, including if sensitive information is used to train the third parties’ AI model. Further, bad actors around the world use increasingly sophisticated methods, including the use of AI, to engage in illegal activities involving the theft and misuse of PII, confidential information, and intellectual property. The use of AI tools and programs by new or existing vendors may also introduce unique vulnerabilities whose existence or exploitation could have a material adverse effect on our business or operations.
We are subject to numerous and rapidly evolving federal, state, and local laws regarding privacy, cybersecurity and the collection, use, and disclosure of PII and other data. Many states, including California, have implemented laws that give consumers expanded rights to manage their personal information, adding to the evolving patchwork of U.S. privacy and cybersecurity law. In addition, cybersecurity has become a high priority for regulators, and some jurisdictions have enacted laws setting forth cybersecurity compliance standards and/or requiring companies to notify certain parties of data security breaches involving certain types of personal data. The SEC has adopted rules for public companies, requiring the mandatory disclosure of material cybersecurity incidents and the Federal Trade Commission and the New York Department of Financial Services have both also increased incident reporting and expanded cybersecurity program requirements. Any failure or perceived failure to maintain the security of and/or adhere to privacy-related obligations related to personal and other data that is provided to us by consumers, employees, and vendors, or any failure or perceived failure to appropriately report and respond to cyber incidents under expanded requirements, could harm our reputation and expose us to a risk of loss or litigation, regulatory scrutiny or enforcement actions, and possible liability, any of which could adversely affect our business and operating results.
If our cybersecurity measures are breached or there is a disruption in our technology systems, our business, brand, operating results, and financial condition could be harmed.
We are highly dependent on technology networks and infrastructure for our business. Our brand, reputation, and ability to attract consumers depend on the safe and reliable performance of our website and mobile application and the supporting systems, technology, and infrastructure, such as our logistics network. Although we consider cybersecurity protection and system stability to be an important piece of our business, strategy, and management, we have in the past and may in the future experience potentially significant interruptions to our systems. Interruptions in these systems, whether due to system failures, programming or configuration errors, computer viruses, or physical or electronic break-ins, including from ransomware or distributed denial of service attacks, could prevent us from selling cars, providing customary financing options to our customers, limit the availability of the inventory on our website and mobile application, prevent or inhibit consumers from accessing our website or mobile application, delay our communication, or cause a breach of data (including PII).
If an actual or perceived breach of our security occurs or there is a disruption in our technology systems, we could lose competitively sensitive business information, intellectual property or lose control of our information processes or internal controls. In addition, the public perception of the effectiveness of our security measures or services could be harmed, and we could lose employees, customers, and business partners. In the event of a security breach, we could suffer financial exposure in connection with demands from perpetrators, penalties and fines, remediation efforts, investigations and legal proceedings, and changes in our security and system protection measures. In the event of an error, defects, disruptions, or other performance or reliability problems with our network operations, our customers’ physical or electronic access to our inventory, or purchase, financing, and fulfillment process, and our access to data that drives our inventory purchase operations could be interrupted as well as cause delays and additional expense in arranging access to new facilities and services, any of which could harm our reputation, business, operating results, and financial condition.
A significant portion of our technology footprint, including the technology and infrastructure that supports our website and mobile applications, is hosted in third-party data center facilities that we do not own or control. Our systems and operations are vulnerable to damage or interruption from fire, flood, power loss, telecommunications failure, terrorist attacks, acts of war,
electronic and physical break-ins, computer viruses, earthquakes, and similar events. The occurrence of any of these events could damage our systems and hardware or could cause them to fail which could result in interruptions in the delivery of our services or impair our operations, negatively impacting sales and operating results. Further, any problems faced by our web-hosting providers could adversely affect the experience of our customers, and if our web-hosting providers are unable to keep up with our growing capacity needs, our business could be harmed.
Failure to adequately protect our intellectual property, technology, and confidential information could reduce our competitiveness and harm our business and operating results.
Our business depends on our intellectual property, including proprietary algorithms, inventions, website content, mobile applications, trademarks, trade dress rights, registered domain names, AI technology, vending machine design and systems, and other confidential information, the protection of which is crucial to the success of our business. We rely on a combination of patents, trademarks, trade secrets, copyrights, and contractual restrictions to protect our intellectual property, technology, and confidential information. We also require all of our new employees and most contractors to enter into intellectual property assignment agreements and certain third parties to enter into nondisclosure agreements. However, these agreements may not effectively prevent unauthorized use or disclosure of our confidential information, intellectual property, or technology, or grant all necessary rights to any inventions that may have been developed by the employees and consultants. Despite our efforts to protect our proprietary rights, unauthorized parties may attempt to copy aspects of our website or mobile application features, software, and functionality, or to obtain and use information that we consider proprietary. Changes in the law or adverse court rulings may also limit the scope of our rights and inhibit us from preventing others from using our technology. Finally, the introduction of AI tools, such as our chatbot, into our business has also increased the risk of inadvertent disclosure of proprietary information and trade secrets. Steps taken to mitigate this risk, including agreements with vendors and policies relating to the safe use of AI tools may not effectively protect proprietary information and any incidents of inadvertent disclosure could undermine our intellectual property rights.
We may, and occasionally in the ordinary course of business do, receive communications alleging infringement or misappropriation of intellectual property or claims relating to licenses with respect thereto. Any claims that we assert against perceived infringers could also provoke these parties to assert counterclaims against us alleging that we infringe their intellectual property rights. At any given time, we may be involved as either a plaintiff or a defendant in a number of intellectual property actions, the outcomes of which may not be known for prolonged periods of time. As a result of such claims, we may have to pay monetary damages and lose valuable intellectual property rights or personnel. Further, even if we are successful in defending against such claims, litigation could result in substantial costs, harm our reputation, and be a distraction to management.
Lastly, we use open source software in our platform and expect to use open source software in the future. There is a risk that such licenses could be construed by courts in a manner that imposes unanticipated conditions or restrictions on our ability to market our platform. By the terms of certain open source licenses, we could be required to make our proprietary software available to be used by the public, re-engineer portions of code, or otherwise be limited to use such code or technology if we combine our proprietary software with open source software in a certain manner. Each of which could reduce or eliminate the value of our technologies and services developed.
An inability to obtain adequate insurance on our inventory or auto liability insurance, or the affordability of such insurance, may materially adversely affect our financial condition and results of operations.
We rely on inventory insurance to protect against catastrophic losses of our inventory, and similarly rely on auto liability insurance to protect us against auto-related liability, in relation to, among other things, our transportation and logistics network. However, the coverage limits of these policies may not be adequate to cover all future claims. Further, there is no guarantee that we will continue to be able to obtain insurance at affordable rates, or at all, through outside insurers. If we are unable to purchase affordable insurance, we may have to self-insure, reducing our ability to make other investments in our business and exposing us to financial risk. In addition, our inability to insure our inventory through an outside insurer, or to adequately self-insure, may adversely impact our ability to finance our inventory purchases. Our inventory is also pledged as collateral in finance agreements, and a failure to maintain sufficient insurance to financially protect the collateral assets could be inconsistent with the requirements of such finance agreements.
We depend on key personnel to operate our business. If we are unable to retain, attract, and integrate qualified personnel, our ability to develop and successfully grow our business could be harmed.
We believe our success has depended, and continues to depend, on the efforts and talents of our executives and employees. Our future success depends on our ability to attract, develop, motivate, and retain highly qualified and skilled employees, including operations staff onsite at IRCs, vending machines, hubs, and auction sites. Qualified individuals are in high demand, and we may incur significant costs to attract and retain them. In addition, the loss or inhibition of any of our key employees or senior executives could materially adversely affect our ability to execute our business plan and strategy, and we may not be able to find adequate replacements on a timely basis, or at all. Our executive officers and other employees are at-will employees, which means they may terminate their employment relationship with us at any time, and their knowledge of our business and industry would be extremely difficult to replace.
We may not receive the full, expected benefit from our minority equity investment in Root, Inc.
We hold shares of Series A convertible preferred stock and warrants to acquire Class A common stock in Root. As a minority equity investor, our influence over Root is limited, and we may be unable to influence Root’s business plan, assure quality control, or set the timing and pace of development, cause Root to effect significant transactions such as large expenditures or contractual commitments, develop insurance products, or borrow money. Our inability to control the operations or management of Root may result in us receiving or retaining less than the amount of benefit we might otherwise expect to receive from appreciation of the equity investment or from the commercial relationship associated therewith. We may be limited in our ability to monetize or exit our investment in Root given contractual restrictions on selling our investment and uncertainty in the trading market for Root's equity securities. In addition, we have in the past recognized, and may again recognize, decreases in fair value in relation to our Root Warrants, and we may also experience a decrease in fair value in relation to our Series A convertible preferred stock. Any other downward adjustment to or impairment of our equity investment could adversely impact our results of operations and financial condition.
We have acquired, and may continue to acquire, other companies or technologies, which could divert our management’s attention, result in additional dilution to our stockholders and otherwise disrupt our operations and harm our operating results.
In the past, we have occasionally acquired complementary businesses and technologies, including the acquisition of our wholesale marketplace, and we may do so again in the future. The identification of suitable acquisition candidates can be difficult, time-consuming, and costly, and we may not be able to successfully complete identified acquisitions. The risks we face in connection with acquisitions include:
•diversion of management time and focus from operating our business to addressing acquisition integration challenges;
•coordination of technology, research and development, and sales and marketing functions;
•transition of the acquired company’s users to our website and mobile application;
•retention of employees from the acquired company;
•cultural challenges associated with integrating employees from the acquired company into our organization;
•integration of the acquired company’s accounting, management information, human resources, cybersecurity, and other administrative systems;
•the need to implement or improve controls, policies, and procedures at a business that, prior to the acquisition, may have lacked effective controls, policies, and procedures;
•potential write-offs of intangibles or other assets acquired in such transactions that may have an adverse effect on our operating results;
•liability for activities of the acquired company before the acquisition, including patent and trademark infringement claims, violations of laws, commercial disputes, tax liabilities, and other known and unknown liabilities;
•litigation or other claims in connection with the acquired company, including claims from terminated employees, consumers, former investors, or other third parties; and
•incurrence of significant expenses in connection with integration.
Our failure to address these risks or other challenges encountered in connection with our past or future acquisitions and investments could cause us to fail to realize the anticipated benefits of these acquisitions or investments, cause us to incur unanticipated liabilities, and otherwise harm our business. Acquisitions could also result in dilutive issuances of our equity securities, the incurrence of debt, contingent liabilities, and amortization expenses, any one of which could harm our financial condition. Additionally, acquisitions have resulted, and may again result, in impairments of intangible assets such as goodwill,
and tangible assets. Any of these risks, if realized, could materially and adversely affect our business, financial condition, and results of operations.
We are, and may in the future be, subject to legal proceedings, claims, and investigations, which could have a material adverse effect on our business, results of operations, and financial condition.
We are subject to various legal proceedings, claims, and investigations, from time to time, which could have a material adverse effect on our business, results of operations, and financial condition. Legal claims have been and could be asserted against us by individuals, either individually or through class actions, by governmental entities in civil or criminal investigations and proceedings, or by other entities. These claims have been and could be asserted under a variety of laws, including but not limited to consumer finance laws; consumer protection laws; intellectual property laws; laws governing motor vehicle dealers; laws, regulations, and systems and process requirements related to title and registration; state laws regulating the sale of motor vehicles and related products and services; privacy laws; labor and employment laws; securities laws; employee benefit laws; tax laws; contract laws; and tort laws. These actions have in the past and could in the future expose us to adverse publicity and to substantial monetary damages and legal defense costs, injunctive relief, and criminal and civil fines and penalties, including but not limited to suspension or revocation of licenses to conduct business.
Further, the Attorney General offices of various states, from time to time, conduct inquiries regarding our inspection, reconditioning, advertising, sale, delivery, titling, registration, and post-sale service of retail vehicles. When such inquiries arise, we work with government agencies to respond to these requests and cooperate with any such inquiries, which if not amicably resolved, could result in state Attorney General offices filing claims against us.
Our results of operations and financial condition are subject to management’s accounting judgments, estimates, and changes in accounting policies.
The preparation of our financial statements requires us to make estimates and assumptions affecting the reported amounts of our assets, liabilities, revenues, and expenses. If these estimates or assumptions are incorrect, it could have a material adverse effect on our results of operations or financial condition. We have identified several accounting policies as being "critical" to the fair presentation of our financial condition and results of operations because they involve major aspects of our business and require us to make judgments about matters that are inherently uncertain. These policies are described in "Management’s Discussion and Analysis of Financial Condition and Results of Operations" and the notes to consolidated financial statements included in this Annual Report on Form 10-K. Further, the implementation of new accounting requirements or other changes to U.S. generally accepted accounting principles could have a material adverse effect on our reported results of operations and financial condition.
Risks Related to our Automotive Finance Receivables
We depend on the sale of automotive finance receivables for a substantial portion of our gross profit.
Many of our customers utilize our financing services to finance the acquisition of a vehicle from us. We then typically sell the resulting automotive finance receivables, and the proceeds therefrom account for a substantial portion of our gross profit. However, customers may elect to finance their vehicle purchases through other parties who may be able to offer more attractive terms. Any material decline in automotive finance receivables sold or the prices at which they are sold would result in the loss of a historically significant portion of our gross profits. The prices we are able to charge for automotive finance receivables that we sell are based on a variety of factors, including the terms and credit risk associated with automotive finance receivables, the relationship between the interest rates we quoted the customer at the time they priced their financing and market and projected interest rates at the time we sell the automotive finance receivables, forecasted loss rates, the historical credit performance of the automotive finance receivables we sell, demand for assets and related securities of that type in the financial markets, and other factors. If these variables or other factors were to change, we might be required to reduce our sale prices on automotive finance receivables, sell fewer of them, or both, which would reduce our gains on sales of automotive finance receivables.
The terms of the financing we offer are dependent in part on our assessment of such customers’ credit-worthiness, which is based on data gathered from customers and other parties and assessed by our proprietary technology tools. If customers or other parties provide us with incorrect or fraudulent data, or if our technology miscalculates or incurs other errors not identified through our underwriting process, we may offer inappropriate terms to our customers, resulting in originating automotive finance receivables that do not perform as expected or that we are unable to sell because they are based on inaccurate credit profiles. Originating a material amount of receivables with inaccurate or fraudulent credit profiles could have a material adverse effect on our business, results of operations, and financial condition.
Any material decline in our access to the capital markets at competitive rates and in sufficient amounts could harm our business, results of operations, and financial condition.
We provide financing to customers and typically sell the related automotive finance receivables. For example, we have entered into various arrangements to pledge or sell automotive finance receivables that we originate, including through committed structured finance arrangements, term securitizations and fixed pool loan sales to financing partners, and plan to enter into new arrangements in the future. Our ability to obtain funding through those channels is subject to having sufficient assets eligible for use as collateral for the related programs and our ability to obtain derivatives to manage interest rate risk among other considerations. If we are unable to continue obtaining funding through those channels, including because we reached our capacity under these or future arrangements, our financing partners exercised constructive or other termination rights before we reached capacity or we reached the scheduled expiration date of the commitment, or if we are unable to enter into new arrangements on similar terms, we may not have adequate liquidity and our business, financial condition, and results of operations may be adversely affected. Furthermore, if our financing partners cease to purchase these receivables, we could be subject to the risk that some of these receivables are not paid when due and we are forced to incur unexpected asset write-offs and bad debt expense.
In addition, changes in the condition of the securitization market could lead us to incur higher costs to access funds in the market or lose access to the market, requiring us to seek alternative means to finance those originations that could be more expensive, or retain credit risk in excess of those required under the Risk Retention Rules (as defined below), which may prevent us from derecognizing the loans and recognizing a gain on sale. As a result, the value of any securities that we may retain in our securitizations might be reduced or, in some cases, eliminated as a result of an adverse change in economic conditions or the financial markets.
Errors in our contracts with our customers could render them unenforceable, ineligible for sale, or require us to repurchase them.
We enter into purchase agreements, buyer’s orders, retail installment contracts, consumer loan contracts, and other contracts with our customers that are generated automatically based upon information the customer enters into our website or mobile application, and are subject to our underwriting process. The contracts are intended to comply with the applicable consumer lending and other commercial and legal requirements of the relevant jurisdictions. The auto-generated forms have contained, however, and may again in the future contain errors or omissions or otherwise fail to comply with applicable regulations in a manner that would render such contracts unenforceable. For example, most jurisdictions impose a maximum interest rate cap that we can charge our customers. If we exceed the relevant cap, our retail installment contracts in such jurisdiction may be unenforceable, and in some instances, we may be required to pay damages or repay any financing charges previously collected. If a significant number of our retail installment contracts are rendered unenforceable, our financial condition and results of operations may be adversely affected.
The financing partners who agree to buy or fund our automotive finance receivables, and the terms of our securitizations, require that we make certain customary representations about the eligibility of those automotive finance receivables for sale. If these receivables do not meet the specified representations, we have in the past been, and will likely in the future be forced to repurchase these receivables. If we sell a significant amount of receivables that do not meet the predetermined representations, we may be required to use cash on hand or to obtain alternative financing in order to repurchase them. Any significant repurchases could have a material adverse effect on our business, results of operations, and financial condition, and may jeopardize our ability to sell contracts to those or other financing partners or purchasers in the future.
We may experience greater credit losses or prepayments in automotive finance receivables than we anticipate.
Until we sell automotive finance receivables, and to the extent we retain interests in automotive finance receivables, we are exposed to the risk that applicable customers will be unable or unwilling to repay their loans according to their terms and that the vehicle collateral securing the payment of their loans may not be sufficient to ensure full repayment. Credit losses are inherent in the automotive finance receivables business and could have a material adverse effect on our results of operations.
We make various assumptions and judgments about the automotive finance receivables we originate using internally developed models to forecast loss rates and may provide an allowance for loan losses, value beneficial ownership interests, and estimate prepayment rates based on a number of factors that we believe are appropriate. However, these allowance, interests, or estimates may not be adequate. For example, if economic conditions were to deteriorate unexpectedly, additional loan losses not incorporated in the existing allowance or valuation may occur. Further, if the receivables we sell experience higher loss
rates than forecasted, we may obtain less favorable pricing on the receivables we sell to financing partners or in securitizations in the future and suffer reputational harm in the marketplace for the receivables we sell. As a result, losses or prepayments in excess of expectations could have a material adverse effect on our business, results of operations, and financial condition.
Risk Retention Rules may increase our compliance costs, limit our liquidity and otherwise adversely affect our operating results.
"Risk retention" rules promulgated by U.S. federal regulators under the Dodd-Frank Act (the "Risk Retention Rules") require a "securitizer" or "sponsor" of a securitization transaction to retain, directly or through a "majority-owned affiliate" (each defined in the Risk Retention Rules), in one or more prescribed forms, at least 5% of the credit risk of the securitized assets. For the securitization transactions for which we have acted as "sponsor," we have sought and will likely continue to seek to satisfy the Risk Retention Rules by retaining a "vertical interest" (as defined in the Risk Retention Rules) through either a majority-owned affiliate or directly on our balance sheet. In addition, we have entered into, and will likely continue to enter into, arrangements to finance a portion of the retained credit risk in one or more prescribed forms under the Risk Retention Rules. However, holding risk retention interests or automotive finance receivables in contemplation of structured financing increases our exposure to the performance of the automotive finance receivables that underlie or are expected to underlie those transactions. For additional information, see Note 2 — Summary of Significant Accounting Policies and Note 9 — Securitizations and Variable Interest Entities.
Risks Related to Our Organizational Structure
Our principal asset is our indirect interest in Carvana Group, and, accordingly, we depend on distributions from Carvana Group to pay our taxes and expenses, including payments under our debt obligations and Tax Receivable Agreement. Carvana Group’s ability to make such distributions may be subject to various limitations and restrictions.
We are a holding company and have no material assets other than our indirect ownership of LLC Units of Carvana Group. As such, we have no independent means of generating revenue or cash flow, and our ability to pay our taxes, debt obligations, and operating expenses depends on the financial results and cash flows of Carvana Group and its subsidiaries and distributions we receive from Carvana Group. Under the terms of the LLC Agreement (as defined in Note 1 — Business Organization), Carvana Group is obligated to make distributions to LLC Unitholders, including Carvana Co. Sub LLC ("Carvana Co. Sub"), our wholly owned subsidiary, to allow us to pay for income taxes on our allocable share of the net taxable income of Carvana Group. The LLC Agreement also obligates Carvana Group to make distributions to us to allow us to pay for our debt obligations, which are represented by our Senior Secured Notes and Senior Unsecured Notes (described in Part II, Item 7 "Management's Discussion and Analysis of Financial Condition and Results of Operations—Liquidity and Capital Resources" and Note 10 — Debt Instruments), and to pay for our obligations under the Tax Receivable Agreement (as defined in Note 15 — Income Taxes).
While we intend to cause Carvana Group to make distributions to us in an amount sufficient to fund these taxes, obligations, and expenses, Carvana Group’s ability to make such distributions may be subject to various limitations and restrictions, such as restrictions on distributions that would either violate any contract or agreement to which Carvana Group is then a party, including debt agreements, or any applicable law, or that would have the effect of rendering Carvana Group insolvent. If we do not have sufficient funds to pay taxes, obligations or expenses, we may have to borrow funds, which could materially adversely affect our liquidity and financial condition and subject us to various restrictions imposed by any such lenders.
Conflicts of interest could arise between our stockholders and the LLC Unitholders, which may impede business decisions that could benefit our stockholders.
Holders of LLC Units have the right to consent to certain amendments to the LLC Agreement, as well as to certain other matters, including the revaluation of membership interests in Carvana Group. Holders of these voting rights may exercise them in a manner that conflicts with the interests of our stockholders. Circumstances may arise in the future when the interests of the LLC Unitholders conflict with the interests of our stockholders. As we control Carvana Group, we have certain obligations to the LLC Unitholders that may conflict with fiduciary duties our officers and directors owe to our stockholders. These conflicts may result in decisions that are not in the best interests of stockholders.
Further, as discussed above, as a unitholder of Carvana Group, we are entitled to receive tax distributions to pay for our allocable share of income taxes. These tax distributions will likely exceed (as a percentage of Carvana Group’s income) the overall effective tax rate applicable to a similarly situated corporate taxpayer. As a result of the potential differences in the
amount of net taxable income allocable to us and the LLC Unitholders, particularly in light of the reduction in corporate tax rates passed in 2017, it is possible that we will receive distributions significantly in excess of our tax liabilities and obligations to make payments under the Tax Receivable Agreement. To the extent we do not distribute such cash balances as dividends on our Class A common stock and instead, for example, hold such cash balances or lend them to Carvana Group, the LLC Unitholders would benefit from any value attributable to such accumulated cash balances as a result of their ownership of Class A common stock following an exchange of its LLC Units (including any exchange upon an acquisition of us).
The Tax Receivable Agreement with the LLC Unitholders requires us to make cash payments to them in respect of certain tax benefits to which we may become entitled, and we expect that the payments we will be required to make will be substantial.
We are party to a Tax Receivable Agreement with the LLC Unitholders, pursuant to which we will be required to make cash payments to such LLC Unitholders equal to 85% of the tax benefits, if any, that we actually realize, or, in some circumstances, are deemed to realize, as a result of (1) the increase in our wholly owned subsidiary’s proportionate share of the existing tax basis of the assets of Carvana Group and an adjustment in the tax basis of the assets of Carvana Group reflected in that proportionate share as a result of any exchanges of LLC Units held by the LLC Unitholders for shares of our Class A common stock or cash, and (2) certain other tax benefits related to payments we make under the Tax Receivable Agreement. Due to the uncertainty of various factors, we cannot estimate the likely tax benefits we will realize as a result of LLC Unit exchanges, and the resulting amounts we are likely to pay to LLC Unitholders pursuant to the Tax Receivable Agreement; however, we estimate that such payments may be substantial. Any payments made by us to the LLC Unitholders under the Tax Receivable Agreement will generally reduce the amount of overall cash flow that might have otherwise been available to us, and will reduce funds available for reinvestment in our business.
To the extent that we are unable to make payments under the Tax Receivable Agreement, such payments generally will be deferred and will accrue interest until paid. Nonpayment for a specified period, however, may constitute a breach of a material obligation under the Tax Receivable Agreement and therefore accelerate payments due under the Tax Receivable Agreement, unless, generally, such nonpayment is due to a lack of sufficient funds. Furthermore, our future obligation to make payments under the Tax Receivable Agreement could make us a less attractive target for an acquisition, particularly in the case of an acquirer that cannot use some or all of the tax benefits that may be deemed realized under the Tax Receivable Agreement. The payments under the Tax Receivable Agreement are also not conditioned upon the LLC Unitholders maintaining a continued ownership interest in Carvana Group.
The actual amount and timing of any payments under the Tax Receivable Agreement will vary depending upon a number of factors, including the timing of exchanges by the LLC Unitholders, the amount of gain recognized by such LLC Unitholders, the amount and timing of the taxable income we generate in the future and the federal tax rates then applicable.
The amounts that we may be required to pay to the LLC Unitholders under the Tax Receivable Agreement may be accelerated in certain circumstances and may also significantly exceed the actual tax benefits that we ultimately realize.
The Tax Receivable Agreement provides that if (1) certain mergers, asset sales, other forms of business combination, or other changes of control were to occur, (2) we breach any of our material obligations under the Tax Receivable Agreement or (3) we elect an early termination of the Tax Receivable Agreement, then the Tax Receivable Agreement will terminate and our obligations, or our successor’s obligations, to make payments under the Tax Receivable Agreement would accelerate and become immediately due and payable. The amount due and payable in that circumstance is based on certain assumptions, including an assumption that we would have sufficient taxable income to fully utilize all potential future tax benefits that are subject to the Tax Receivable Agreement. We may need to incur debt to finance payments under the Tax Receivable Agreement to the extent our cash resources are insufficient to meet our obligations under the Tax Receivable Agreement as a result of timing discrepancies or otherwise.
As a result of a change in control or our election to terminate the Tax Receivable Agreement early, (1) we could be required to make cash payments to the LLC Unitholders that are greater than the specified percentage of the actual benefits we ultimately realize in respect of the tax benefits that are subject to the Tax Receivable Agreement and (2) we would be required to make an immediate cash payment equal to the present value of the anticipated future tax benefits that are the subject of the Tax Receivable Agreement, which payment may be made significantly in advance of the actual realization, if any, of such future tax benefits. In these situations, our obligations under the Tax Receivable Agreement could have a substantial negative impact on our liquidity and could have the effect of delaying, deferring, or preventing certain mergers, asset sales, other forms of business combination, or other changes of control. There can be no assurance that we will be able to finance our obligations under the Tax Receivable Agreement.
We will not be reimbursed for any payments made to the LLC Unitholders under the Tax Receivable Agreement in the event that any tax benefits are disallowed.
We will not be reimbursed for any cash payments previously made to the LLC Unitholders pursuant to the Tax Receivable Agreement if any tax benefits initially claimed by us are subsequently challenged by a taxing authority and are ultimately disallowed. Instead, any excess cash payments made by us to an LLC Unitholder will be netted against any future cash payments that we might otherwise be required to make under the terms of the Tax Receivable Agreement. However, a challenge to any tax benefits initially claimed by us may not arise for a number of years following the initial time of such payment or, even if challenged early, such excess cash payment may be greater than the amount of future cash payments that we are required to make under the terms of the Tax Receivable Agreement and, as a result, there may not be future cash payments to net against. The applicable U.S. federal income tax rules are complex and factual in nature, and there can be no assurance that the IRS or a court will agree with our tax reporting positions. As a result, it is possible that we could make cash payments under the Tax Receivable Agreement that are substantially greater than our actual cash tax savings.
We may not be able to realize all or a portion of the tax benefits that are currently expected to result from future exchanges of LLC Units for our Class A common stock and from payments made under the Tax Receivable Agreement.
Our ability to realize the tax benefits that we currently expect to be available as a result of the increases in tax basis created by any future exchanges of LLC Units for our Class A common stock, the payments made pursuant to the Tax Receivable Agreement, and the interest deductions imputed under the Tax Receivable Agreement all depend on a number of assumptions, including that we earn sufficient taxable income each year during the period over which such deductions are available and that there are no changes in applicable law or regulations. For example, the reduction in corporate tax rates pursuant to the 2017 changes in U.S. federal income tax law had the effect of reducing the expected value of the tax benefits we realize as a result of the increase in our proportionate share of the existing tax basis of the assets of Carvana Group arising from future exchanges of LLC Units held by an LLC Unitholder for shares of our Class A common stock or cash. The reduction in the value of such tax benefits is expected to have two primary consequences—it reduces the cash payments we expect to be required to make pursuant to the Tax Receivable Agreement and it reduces the expected value to us of the 15% of the amount of such tax benefits that we will retain pursuant to the Tax Receivable Agreement. Additionally, if our actual taxable income were insufficient or there were additional adverse changes in applicable laws or regulations, we may be further unable to realize all or a portion of the expected tax benefits and our cash flows and stockholders’ equity (deficit) could be negatively affected.
We are a "controlled company" within the meaning of the rules of the NYSE and, as a result, we qualify for exemptions from certain corporate governance requirements. Our stockholders may not have the same protections afforded to stockholders of companies that are subject to such requirements.
The Garcia Parties control a majority of the combined voting power of Carvana Co. As a result, we continue to be a controlled company within the meaning of the NYSE corporate governance standards. Under such standards, a company of which more than 50% of the voting power is held by an individual, group, or another company is a "controlled company" and need not comply with certain requirements, including that a majority of our board of directors (the "Board") consist of independent directors, that our compensation and nominating and governance committees be composed entirely of independent directors, and that our Board and committees be subject to annual performance evaluations. We do not currently utilize these exemptions; however, for so long as we qualify as a controlled company, we will maintain the option to utilize some or all of these exemptions. In the event we rely on these exemptions in the future, our stockholders would not have the same protections afforded to stockholders of companies that are subject to all of the corporate governance requirements of the NYSE.
Risks Related to Our Indebtedness and Liquidity
Our substantial indebtedness, including any additional indebtedness incurred in the future, could adversely affect our financial flexibility, ability to incur additional debt, and our competitive position and prevent us from fulfilling our obligations under our financing agreements.
As of December 31, 2024, we had outstanding, on a consolidated basis (1) $205 million aggregate principal amount of our Senior Unsecured Notes, (2) $4.4 billion aggregate principal amount of our Senior Secured Notes, which includes $105 million of accrued payment-in-kind interest, (3) $67 million aggregate principal amount of borrowings under our Floor Plan Facility and the Finance Receivable Facilities (as defined below), (4) $183 million aggregate principal amount of indebtedness represented by our finance lease agreements between us and providers of equipment financing, (5) an outstanding balance of $354 million under our secured borrowing facility through which we finance certain retained beneficial interests in our
securitizations, and (6) $485 million of other long-term debt related to our sale leaseback transactions. Our substantial indebtedness has had and could have further significant effects on our business. For example, it has or could:
•make it more difficult for us to satisfy our obligations with respect to our current and future indebtedness, including our Senior Secured Notes and Senior Unsecured Notes (collectively the "Senior Notes," each as defined in Note 10 — Debt Instruments) and the Floor Plan Facility;
•increase our vulnerability to adverse changes in prevailing economic, industry, and competitive conditions;
•require us to dedicate a substantial portion of our cash flow from operations to make payments on our indebtedness, thereby reducing the availability of our cash flow to fund working capital, capital expenditures, acquisitions, the execution of our business strategy, and other general corporate purposes;
•limit our flexibility in planning for, or reacting to, changes in our business and the industry in which we operate;
•limit our ability to incur additional debt or increase our cost of borrowing;
•restrict us from exploiting business opportunities; and
•place us at a disadvantage compared to our competitors that have fewer debt obligations.
We also may incur significant additional indebtedness in the future, subject to the restrictions in the indentures governing the Senior Notes, or we may pursue investments in joint ventures or acquisitions, which we may finance with additional debt. If we incur additional debt, the related risks that we face would intensify.
We may not be able to generate sufficient cash flow to service all of our indebtedness, and may be forced to take other actions to satisfy our obligations under such indebtedness, which may not be successful, or may harm our business.
Our ability to make scheduled payments or to refinance outstanding debt obligations depends on our financial and operating performance, which will be affected by prevailing economic, industry, and competitive conditions and by financial, business, and other factors beyond our control. Additionally, some of our debt accrues interest at a variable rate that is based on SOFR or other market rates; if those market rates rise, so too will the amount we need to pay to satisfy our debt obligations, and we have been in the past and may again be required to enter into hedging agreements, which may not fully mitigate our interest rate risk, and may expose us to risk of financial loss if the counterparty defaults on its contractual obligations. We may not be able to maintain a sufficient level of cash flow from operating activities to permit us to pay the principal, premium, if any, and interest on our indebtedness. Any failure to make payments of interest and principal on our outstanding indebtedness on a timely basis would likely result in a reduction of our credit rating, which would also adversely affect our ability to incur additional indebtedness.
If our cash flows and capital resources are insufficient to fund our debt service obligations, we may be forced to reduce or delay capital expenditures, sell assets, seek additional capital from banks or other lenders, through public offerings or private placements of debt or equity, through strategic relationships or other arrangements, or from a combination of these sources, or seek to restructure or refinance our indebtedness. Any refinancing of our indebtedness could be at higher interest rates and may require us to comply with more onerous covenants. These alternative measures may not be successful, and we may be unable to meet our scheduled debt service obligations.
In the absence of such cash flows and resources, we could face substantial liquidity problems and might be required to sell material assets or operations to attempt to meet our debt service obligations. We may not be able to consummate these asset sales to raise capital or sell assets at prices and on terms that we believe are fair, and any proceeds that we do receive may not be adequate to meet any debt service obligations then due. If we cannot meet our debt service obligations, the holders of our indebtedness may accelerate such indebtedness and, to the extent such indebtedness is secured, foreclose on our assets. In such an event, we may not have sufficient assets to repay our indebtedness. If any of these risks are realized, our business and financial condition would be materially adversely affected. Further, in the event of our bankruptcy, dissolution, or liquidation, the holders of our Senior Notes and our other indebtedness would be paid in full before any distribution can be made to the holders of our Class A common stock.
Risks Related to Ownership of our Class A Common Stock
The market price of our Class A common stock has been and may continue to be volatile or may decline regardless of our operating performance.
Volatility in the market price of our Class A common stock may prevent our stockholders from being able to sell their shares at or above the price they paid for them. The market price of our Class A common stock has fluctuated, and may continue to fluctuate widely due to many factors, some of which may be beyond our control. The closing price of our Class A
common stock between January 1, 2024 and January 1, 2025 has ranged from a low of $41.00 to a high of $260.80. Many factors may cause the market price of our Class A common stock to fluctuate significantly, including those described elsewhere in this "Risk Factors" section and this Annual Report on Form 10-K, as well as the following:
•adverse impacts to the larger automotive ecosystem, including consumer demand, global supply chain challenges (including the imposition of new or increased tariffs), and other macroeconomic issues;
•previous and future strategic actions and manipulations of the market for our securities by short sellers and "short squeezes;"
•our operating and financial performance and prospects;
•our quarterly or annual earnings or those of other companies in our industry compared to market;
•future announcements or press coverage concerning our business or our competitors’ businesses;
•the public’s reaction to our press releases, other public announcements, and filings with the SEC;
•the size of our public float;
•trading volume;
•coverage by or changes in financial estimates by securities analysts or failure to meet their expectations;
•market and industry perception of our success, or lack thereof, in pursuing our growth strategy;
•strategic actions by us or our competitors, such as acquisitions or restructurings;
•changes in laws or regulations which adversely affect our industry or us;
•negative research about our business or downgrades of our Class A common stock published by analysts or journalists or downgrades of our credit rating;
•changes in accounting standards, policies, guidance, interpretations, or principles;
•changes in senior management or key personnel;
•issuances, exchanges, or sales or expected issuances, exchanges, or sales of our capital stock;
•cybersecurity events, pandemics, and other crises or disasters;
•adverse resolution of new or pending litigation, claims, or investigations against us; and
•changes in general market, economic, and political conditions in the United States and global economies or financial markets, including those resulting from natural disasters, terrorist attacks, acts of war, and responses to such events.
Volatility in the market price of our Class A common stock may prevent investors from being able to sell their Class A common stock at or above their purchase price or at all. These broad market and industry factors may materially reduce the market price of our Class A common stock, regardless of our operating performance. In addition, price volatility may be greater if the public float and trading volume of our Class A common stock is low. Because we do not intend to pay dividends on our Class A common stock for the foreseeable future, any return on investment in our Class A common stock is solely dependent upon the appreciation of the price of our Class A common stock on the open market, which may not occur.
The Garcia Parties control us and their interests may conflict with our or our stockholders’ interests in the future.
The Garcia Parties together hold approximately 84% of the voting power of our outstanding capital stock through their beneficial ownership of our Class A and Class B common stock as of December 31, 2024. The Garcia Parties are entitled to ten votes per share of Class B common stock they beneficially own, for so long as the Garcia Parties maintain, in the aggregate, direct or indirect beneficial ownership of at least 25% of the outstanding shares of Class A common stock (determined on an as-exchanged basis assuming that all of the Class A Units were exchanged for Class A common stock). Our Class A common stock and all other shares of Class B common stock have one vote per share. So long as the Garcia Parties continue to beneficially own a sufficient number of shares of Class B common stock, even if they beneficially own significantly less than 50% of the shares of our outstanding capital stock, the Garcia Parties will continue to be able to effectively control our business. For example, if the Garcia Parties hold Class B common stock representing 25% of our outstanding capital stock, they would collectively control 71% of the voting power of our capital stock.
As a result, the Garcia Parties have the ability to elect all of the members of our Board and thereby effectively control our policies and operations, including the appointment of management, future issuances of our Class A common stock or other securities, the payment of dividends, if any, on our Class A common stock, the incurrence of debt by us, amendments to our amended and restated certificate of incorporation and amended and restated bylaws, and the execution of extraordinary transactions. The interests of the Garcia Parties may not in all cases be aligned with our other stockholders’ interests.
In addition, the Garcia Parties can determine the outcome of all matters requiring stockholder approval, cause or prevent a change of control of our company, and preclude any acquisition of our company. This concentration of voting control could deprive our stockholders of an opportunity to receive a premium for their shares of Class A common stock as part of a sale of our company and could affect the market price of our Class A common stock.
The Garcia Parties may also have an interest in pursuing acquisitions, divestitures, and other transactions that, in their judgment, could enhance their investment, even though such transactions might involve risks. For example, the Garcia Parties could cause us to make acquisitions that increase our indebtedness or cause us to sell revenue-generating assets. The Garcia Parties may from time to time acquire and hold interests in businesses that compete directly or indirectly with us. The Garcia Parties control and own substantially all interest in DriveTime, which could compete more directly with us in the future. Our amended and restated certificate of incorporation provides that none of the Garcia Parties and/or their respective directors, partners, principals, officers, members, managers and/or employees (including any who also serves as one of our officers or directors) or his or her affiliates has any duty to refrain from engaging, directly or indirectly, in the same business activities or similar business activities or lines of business in which we operate. The Garcia Parties also may pursue acquisition opportunities that may otherwise be complementary to our business, and, as a result, those acquisition opportunities may not be available to us.
Our stock may be diluted by future issuances of additional Class A common stock or LLC Units in connection with our incentive plans, acquisitions, or otherwise. Future sales of such shares in the public market or the expectations that such sales may occur could lower our stock price.
We issue additional shares of Class A common stock in several ways: (i) as authorized by our Board, in its sole discretion, whether in connection with acquisitions or otherwise; (ii) at the request of LLC Unitholders, requiring Carvana Group to redeem all or a portion of their LLC Units in exchange for newly issued shares of Class A common stock; (iii) under our equity incentive plans available to our directors, employees and consultants; and (iv) under our “at-the-market offering” program (the “ATM Program”) that provides for the sale of the greater of (i) a number of shares of Class A common stock representing an aggregate offering price of $1.0 billion or (ii) an aggregate of 21,016,898 shares of its Class A common stock, from time to time.
Any stock that we issue or exchange dilutes the percentage ownership held by the investors who hold Class A common stock. The market price of shares of our Class A common stock could decline as a result of newly issued or exchanged stock, or the perception that we might issue or exchange stock. A decline in the price of our Class A common stock might impede our ability to raise capital through the issuance of additional shares of Class A common stock or other equity securities. In addition, in order to raise additional capital, we may in the future offer additional shares of our Class A common stock or other securities convertible into or exchangeable for our Class A common stock at various prices. Investors purchasing shares or other securities in the future could have rights superior to existing stockholders, and any future equity offerings will result in further dilution for our existing stockholders.
We may issue shares of preferred stock in the future, which could make it difficult for another company to acquire us or could depress the price of our Class A common stock, or otherwise adversely affect holders of our Class A common stock.
Our amended and restated certificate of incorporation authorizes us to issue one or more series of preferred stock. Our Board has the authority to determine the preferences, limitations, and relative rights of the shares of preferred stock and to fix the number of shares constituting any series and the designation of such series, without any further vote or action by our stockholders. Our preferred stock could be issued with voting, liquidation, dividend, and other rights superior to the rights of our Class A common stock. The potential issuance of preferred stock may delay or prevent a change in control of us, discouraging bids for our Class A common stock at a premium to the market price, and materially adversely affect the market price and the voting and other rights of the holders of our Class A common stock.
Delaware law and certain provisions in our amended and restated certificate of incorporation may prevent efforts by our stockholders to change the direction or management of our company.
We are a Delaware corporation, and the anti-takeover provisions of Delaware law impose various impediments to the ability of a third party to acquire control of us, even if a change of control would be beneficial to our existing stockholders. In addition, our amended and restated certificate of incorporation and our amended and restated by-laws contain provisions that may make the acquisition of our company more difficult without the approval of our Board, including, but not limited to, the following:
•the Garcia Parties are entitled to ten votes for each share of our Class B common stock they hold of record on all matters submitted to a vote of stockholders for so long as the Garcia Parties maintain direct or indirect beneficial ownership of at least 25% of the outstanding shares of Class A common stock (determined on an as-exchanged basis assuming that all of the Class A Units were exchanged for Class A common stock);
•at such time as there are no outstanding shares of Class B common stock, only our Board may call special meetings of our stockholders;
•we have authorized undesignated preferred stock, the terms of which may be established and shares of which may be issued without stockholder approval; and
•we require advance notice and duration of ownership requirements for stockholder proposals.
Our amended and restated certificate of incorporation also contains a provision that provides us with protections similar to Section 203 of the DGCL, and prevents us from engaging in a business combination with a person (excluding the Garcia Parties and their transferees) who acquires at least 15% of our common stock for a period of three years from the date such person acquired such common stock, unless board or stockholder approval is obtained prior to the acquisition. These provisions could discourage, delay, or prevent a transaction involving a change in control of our company. These provisions could also discourage proxy contests and make it more difficult for our stockholders to elect directors of their choosing and cause us to take other corporate actions our stockholders desire, including actions that our stockholders may deem advantageous, or negatively affect the trading price of our Class A common stock. In addition, because our Board is responsible for appointing the members of our management team, these provisions could in turn affect any attempt by our stockholders to replace current members of our management team.
These and other provisions in our amended and restated certificate of incorporation, amended and restated bylaws, and Delaware law could make it more difficult for stockholders or potential acquirers to obtain control of our Board or to initiate actions that are opposed by our then-current Board, a merger, tender offer, or proxy contest involving our company. The existence of these provisions could negatively affect the price of our Class A common stock and limit opportunities for our stockholders to realize value in a corporate transaction.
With limited exceptions, the Court of Chancery of the State of Delaware is the sole and exclusive forum for certain stockholder litigation matters, which could limit our stockholders’ ability to obtain a favorable judicial forum for disputes with us or our directors, officers, employees, or stockholders.
Pursuant to our amended and restated certificate of incorporation, unless we consent in writing to the selection of an alternative forum, the Court of Chancery of the State of Delaware is the sole and exclusive forum for (1) any derivative action or proceeding brought on our behalf, (2) any action asserting a claim of breach of a fiduciary duty owed by any of our directors, officers, or other employees to us or our stockholders, (3) any action asserting a claim against us arising pursuant to any provision of the DGCL, our amended and restated certificate of incorporation or our amended and restated bylaws, or (4) any other action asserting a claim against us that is governed by the internal affairs doctrine. The forum selection clause in our amended and restated certificate of incorporation may have the effect of discouraging lawsuits against us or our directors and officers and may limit our stockholders’ ability to obtain a favorable judicial forum for disputes with us or our directors, officers, employees, or stockholders.
ITEM 1B. UNRESOLVED STAFF COMMENTS.
None.
ITEM 1C. CYBERSECURITY.
We consider cybersecurity protection, including protection of customer, employee, and partner information, to be a priority in the Company’s business, strategy, and management. Carvana's enterprise risk management program, which is designed to identify, evaluate, and respond to our high priority risks and opportunities, integrates assessment, review, identification and management of cybersecurity risks.
While management is responsible for the day-to-day handling of our risk management program, the Board of Directors, as a whole and through its committees, oversees risk management, including cybersecurity risks. The Board has delegated certain risk management responsibilities with respect to cybersecurity to the Audit Committee, which is responsible for ensuring sufficient oversight of our cybersecurity risk exposures. The Audit Committee leads the full Board in periodic reviews of the adequacy and effectiveness of our information security program and internal controls, including quarterly and ad hoc updates of cybersecurity risks, initiatives, and key metrics. Senior leaders from our Information Security, Legal, Privacy, and Compliance teams provide the Board and Audit Committee with periodic briefings of our current risks and security strategy, as well as future plans with regard to cybersecurity posture, preparation, prevention, and incident response.
Our Chief Information Security Officer ("CISO"), who has extensive cybersecurity knowledge and experience, with over 15 years in the field of information security, including over seven years of experience leading information security departments within financial services and technology organizations as a cybersecurity executive, is primarily responsible for assessing and managing cybersecurity risk. The CISO oversees a team of dedicated information security professionals (the “Information Security Team”) who focus on specialty areas such as application security, security compliance, security architecture and engineering, vulnerability management, and security operations, each with relevant experience and industry certifications in their respective areas.
The Information Security Team leverages a variety of processes and controls to stay informed of and manage cybersecurity risk. It partners with a variety of business units, including our engineering, legal, privacy, compliance, internal audit, technology, and product teams to identify and control emerging risks. The Information Security and privacy teams also from time to time engage consultants and other third parties to assist in investigating and remediating security incidents, monitoring of security vulnerabilities, and performing risk assessments based on industry standards such as the National Institute of Standards and Technology (NIST) Cybersecurity Framework. Our Information Governance Committee, whose members include representatives from the Information Security Team and key senior leaders from relevant stakeholder groups, meets quarterly to review and discuss, among other topics, the implementation and management of these cybersecurity processes. The Information Security Team additionally has adopted security control principles based on ISO 27002:2022 and partners with counterparts in our legal department to use various formalized incident management and monitoring standards and incident response plans and playbooks, which define immediate steps in the event of a cybersecurity incident, roles and responsibilities, as well as materiality criteria to allow for efficient and effective incident management. This includes a third-party vendor management procedure, under which we conduct vendor risk assessments and, when appropriate, ongoing threat monitoring. In implementing these policies, the Information Security Team utilizes a layered approach, aided by industry leading technology, to detect, respond, and prevent cybersecurity risks and exposures.
As of the date hereof, we have not experienced any material cybersecurity incidents. However, future incidents, whether direct or through our third-party providers, could have a material impact on our business strategy, results of operations, or financial condition. We maintain cybersecurity insurance to mitigate the risks of a material cybersecurity incident; however, the costs may exceed our coverage and, therefore, may not be fully insured. See Part I, Item 1A - “Risk Factors” in this Annual Report on Form 10-K for a further discussion of various cybersecurity risks to the Company.
ITEM 2. PROPERTIES.
As of December 31, 2024, we operated the following facilities in the U.S.:
| | | | | | | | | | | | | | | | | | | | | | | | | | |
| Description of use | | Owned interior square footage (millions) | | Leased interior square footage (millions) | | Owned land acreage | | Leased land acreage |
| Corporate headquarters | | — | | | 1.2 | | | — | | | 39 | |
Other facilities (1) | | 5.2 | | | 5.7 | | | 4,162 | | | 3,125 | |
(1) Other facilities include IRCs, hubs, vending machines, and auction locations.
We believe that our properties are adequate and suitable for our business as presently conducted.
ITEM 3. LEGAL PROCEEDINGS.
From time to time, we are involved in various claims, legal actions, and government inquiries. For more information regarding our material pending legal proceedings, see “Legal Matters” in Note 17 — Commitments and Contingencies, included in Part II, Item 8, "Financial Statements and Supplementary Data," of this Annual Report on Form 10-K.
ITEM 4. MINE SAFETY DISCLOSURES.
Not applicable.
PART II
ITEM 5. MARKET FOR REGISTRANT’S COMMON EQUITY, RELATED STOCKHOLDER MATTERS, AND ISSUER PURCHASES OF EQUITY SECURITIES.
Market Information
Our Class A common stock trades on the NYSE under the ticker symbol "CVNA."
Our Class B common stock is not listed nor traded on any stock exchange.
Holders of Record
We are authorized to issue up to 500 million shares of Class A common stock, up to 125 million shares of Class B common stock and up to 50 million shares of preferred stock. As of February 14, 2025, there were 10 shareholders of record of our Class A common stock. The number of record holders does not include persons who held shares of our Class A common stock in "street name" accounts through brokers, banks, and other financial institutions. As of February 14, 2025, there were 9 shareholders of record of our Class B common stock.
Dividend Policy
We have not declared or paid any cash dividends on our Class A common stock during the fiscal year and do not currently anticipate paying cash dividends in the foreseeable future. Holders of our Class B common stock are not entitled to receive dividends.
Stock Performance Graph
The following graph compares the total shareholder return from December 31, 2019 through December 31, 2024 of (i) our Class A common stock, (ii) the Standard and Poor's 500 Stock Index ("S&P 500") and (iii) the Standard and Poor's 500 Retailing Index ("S&P 500 Retailing Index"), assuming an initial investment of $100 on December 31, 2019 and including reinvestment of dividends where applicable. The results presented below are not necessarily indicative of future performance.
Recent Sales of Unregistered Securities
There were no unregistered sales of equity securities during the year ended December 31, 2024, except as otherwise previously reported in a Current Report on Form 8-K.
During the year ended December 31, 2024, pursuant to the terms of the Exchange Agreement entered into in connection with our initial public offering, certain LLC Unitholders exchanged 8.7 million LLC Units and 6.5 million shares of Class B common stock for 6.9 million shares of Class A common stock. Such shares were issued in reliance on an exemption from registration pursuant to Section 4(a)(2) of the Securities Act of 1933, as amended.
Issuer Purchases of Equity Securities
None.
ITEM 6. [RESERVED]
ITEM 7. MANAGEMENT’S DISCUSSION AND ANALYSIS OF FINANCIAL CONDITION AND RESULTS OF OPERATIONS.
The following discussion should be read in conjunction with Part I, including matters set forth in the "Risk Factors" section of this Annual Report on Form 10-K, and our financial statements and notes thereto included in Part II, Item 8 "Financial Statements and Supplementary Data," of this Form 10-K. Except when stated otherwise, we present the discussion in Management’s Discussion and Analysis of Financial Condition and Results of Operations on a consolidated basis.
Overview
Carvana is the leading e-commerce platform for buying and selling used cars. We are transforming the used car buying and selling experience by giving consumers what they want - a wide selection, great value and quality, transparent pricing, and a simple, no pressure transaction. Each element of our business, from inventory procurement to fulfillment and overall ease of the online transaction, has been built for this singular purpose.
See Part I, Item 1 - "Business" for a detailed description and discussion of the Company's business.
Refer to "Management's Discussion and Analysis of Financial Condition and Results of Operations" in Part II, Item 7 of our Annual Report on Form 10-K for the fiscal year ended December 31, 2023 filed with the SEC on February 22, 2024 for discussion and analysis of our financial condition and results of operations for the fiscal year ended December 31, 2023 compared to the fiscal year ended December 31, 2022.
Retail Vehicle Unit Sales
Since launching to customers in Atlanta, Georgia in January 2013, we have historically experienced rapid growth in sales through our website www.carvana.com. During the year ended December 31, 2024, the number of vehicles we sold to retail customers increased by 33.1% to 416,348, compared to 312,847 in the year ended December 31, 2023.
We continue to view the number of vehicles we sell to retail customers as the most important long-term measure of our performance, and we expect to continue to focus on building a scalable platform to efficiently increase our retail units sold. This focus on retail units sold is motivated by several factors:
•Retail units sold enable multiple revenue streams, including the sale of the vehicle itself, the sale of finance receivables originated to finance the vehicle, complementary products, and the sale of vehicles acquired from customers.
•Retail units sold are the primary driver of customer referrals and repeat sales. Each time we sell a vehicle to a new customer, that customer may refer future customers and can become a repeat buyer in the future.
•Retail units sold are an important driver of the average number of days between when we acquire the vehicle and when we sell it. Reducing average days to sale impacts gross profit on our vehicles because used vehicles generally depreciate over time.
•Retail units sold allow us to benefit from economies of scale due to our centralized online sales model. We believe our model provides meaningful operating leverage in acquisition, reconditioning, transport, customer service, and delivery.
We are simultaneously maintaining our focus on efficiency gains and other profitability initiatives, while continuing to invest in technology and infrastructure to support efficient growth in retail units sold. This includes continued investment in our vehicle acquisition, reconditioning and logistics network, as well as continued investment in product development and engineering to deliver customers a best-in-class experience.
Revenue and Gross Profit
We generate revenue on retail units sold from four primary sources: the sale of the retail vehicles, wholesale sales of vehicles we acquire from customers, including sales through our wholesale marketplace, gains on the sales of loans originated to finance the vehicles, and sales of complementary products.
Our largest source of revenue, retail vehicle sales, totaled $9.7 billion and $7.5 billion during the years ended December 31, 2024 and 2023, respectively. We generally expect retail vehicle sales to trend proportionately with retail units sold, absent any material changes in macroeconomic conditions. We generate a majority of gross profit on retail vehicle sales from the difference between the retail selling price of the vehicle and our cost of sales associated with acquiring the vehicle and preparing it for sale. Retail vehicle sales also include shipping and delivery fees and service revenue from retail marketplace
transactions, which are retail marketplace partner vehicles sold to customers through Carvana that receive net revenue treatment due to the timing of payments with our partners.
Wholesale sales and revenues includes sales of trade-ins and other vehicles acquired from customers that do not meet the requirements for our retail inventory. We also include revenue earned from the sale of wholesale marketplace units by non-Carvana sellers through our wholesale marketplace platform, including auction fees and related service revenues, in wholesale sales and revenues. Wholesale sales and revenues totaled $2.8 billion and $2.5 billion during the years ended December 31, 2024 and 2023, respectively. We generally expect wholesale sales to trend proportionately with retail units sold through trade-ins and from customers who wish to sell us a car independent of a retail sale and with the movement of wholesale marketplace units. We generate gross profit on wholesale vehicle sales from the difference between the wholesale selling price of the vehicle and our cost of sales associated with acquiring the vehicle and preparing it for sale. We generate a gross profit on wholesale marketplace units from the difference between the revenue earned from the sale of wholesale marketplace units through our wholesale marketplace platform less our cost of sales associated with operating the wholesale marketplace platform.
Other sales and revenues, which primarily includes gains on the sales of finance receivables we originate and sales commissions on complementary products such as VSCs, GAP waiver coverage, and auto insurance, totaled $1.2 billion and $753 million during the years ended December 31, 2024 and 2023, respectively. We generally expect other sales and revenues to trend proportionately with retail units sold. We also expect other sales and revenues to increase as we improve our ability to monetize loans we originate, including through securitization transactions, and sell and offer attractive financing solutions and complementary products to our customers, including products customarily sold by automotive retailers or insurance products customarily sold by traditional insurance companies, absent any material changes in macroeconomic conditions. Other sales and revenues are 100% gross margin products for which gross profit equals revenue.
Our highest priority continues to be providing exceptional customer experiences while improving efficiency and utilizing our infrastructure to support efficient growth in retail units sold to help us move along the path to achieve sustained profitability. Strategies to support efficient growth initiatives, which we may undertake from time to time include the following:
•Increase the purchase of vehicles from customers. Over time, we plan to grow the number of vehicles that we purchase from our customers as trade-ins or independent of a retail sale. This will provide additional vehicles for our retail business, which on average are more profitable compared to the same vehicle acquired at auction, and expand our inventory selection. In addition, this in turn will grow our wholesale business.
•Optimize average days to sale. Our goal is generally to optimize our inventory size relative to sales to achieve our desired average days to sale. Reductions in average days to sale lead to fewer vehicle price reductions, and therefore higher average selling prices, all other factors being equal. Higher average selling prices in turn lead to higher gross profit per unit sold, all other factors being equal.
•Leverage existing inspection and reconditioning infrastructure. As we scale, we intend to more fully utilize the capacity at our existing IRCs and auction locations, which collectively have capacity to inspect and recondition more than 1 million vehicles per year at full utilization.
•Expand our logistics network. As we scale, we intend to further expand our in-house logistics network to transport cars to our IRCs or other sites after acquisition from customers or wholesale auctions.
•Increase conversion on existing products. We plan to continue to improve our website to highlight the benefits of our complementary product offerings, including financing, complementary products, and trade-ins.
•Add new products and services. We plan to utilize our online sales platform to offer additional complementary products and services to our customers.
•Increase monetization of our finance receivables. We plan to continue selling finance receivables in securitization transactions and otherwise expand our base of financial partners who purchase the finance receivables originated on our platform to reduce our effective cost of funds.
•Optimize purchasing and pricing. We are constantly improving the ways in which we predict customer demand, value vehicles sight unseen and optimize what we pay to acquire those vehicles. We also regularly test different pricing of our products, including vehicle sticker prices, trade-in and independent vehicle offers, and complementary product prices, and we believe we can improve by further optimizing prices over time.
Seasonality
We expect to experience seasonal and other fluctuations in our quarterly operating results, including as a result of macroeconomic conditions, which may not fully reflect the underlying performance of our business. Retail and wholesale used vehicle sales generally exhibit seasonality with sales peaking late in the first calendar quarter and diminishing through the rest of the year, with the lowest relative level of vehicle sales expected to occur in the fourth calendar quarter. Due to our historical and current rapid growth, our overall sales patterns in the past have not always reflected the general seasonality of the used vehicle industry. However, as our business continues to mature, our results may become more reflective of typical market seasonality. Used vehicle prices also exhibit seasonality, with used vehicles generally depreciating at a faster rate in the fourth and first quarters of each year and a slower rate in the second and third quarters of each year, all other factors being equal.
Investment in Growth
For the past several years, we have been and continue to be focused on driving fundamental gains in gross profit per unit and operational efficiency, flexibility, and scalability through process and technology improvements to increase profitability and provide a strong foundation for profitable growth. As we continue targeting initiatives aimed at improving efficiencies, we are simultaneously investing in the profitable expansion of our business. While we intend to become increasingly efficient over time, we also anticipate that our operating expenses will increase as we grow retail units sold, wholesale units sold, and wholesale marketplace units transacted. There is no guarantee that we will be able to realize the desired return on our investments.
Relationships with Related Parties
For discussion about our relationships with related parties, refer to Note 7 — Related Party Transactions of our consolidated financial statements included in Part II, Item 8, "Financial Statements and Supplementary Data," of this Annual Report on Form 10-K and our Proxy Statement for our 2025 Annual Meeting of Stockholders to be filed with the SEC within 120 days after the end of the fiscal year ended December 31, 2024.
Key Operating Metrics
We regularly review a number of metrics, including the following key metrics, to evaluate our business, measure our progress and make strategic decisions. Our key operating metrics reflect the key drivers of our growth, including increasing brand awareness, enhancing the selection of vehicles we make available to our customers, and serving more of the U.S. population. Our key operating metrics also demonstrate our ability to translate these drivers into retail sales and to monetize these retail sales through a variety of product offerings.
| | | | | | | | | | | |
| Years Ended December 31, |
| 2024 | | 2023 |
| Retail units sold | 416,348 | | | 312,847 | |
| Average monthly unique visitors (in thousands) | 17,248 | | | 15,819 | |
| Total website units | 53,360 | | | 33,075 | |
| Total gross profit per unit | $ | 6,908 | | | $ | 5,511 | |
| Total gross profit per unit, non-GAAP | $ | 7,196 | | | $ | 5,984 | |
Retail Units Sold
We define retail units sold as the number of vehicles sold to customers in a given period, including retail marketplace partner vehicles, net of returns under our seven-day return policy. We view retail units sold as a key measure of our growth for several reasons. First, retail units sold is the primary driver of our revenues and, indirectly, gross profit, since retail unit sales enable multiple complementary revenue streams, including financing, complementary products, and trade-ins. Second, growth in retail units sold increases the base of available customers for referrals and repeat sales. Third, growth in retail units sold is an indicator of our ability to successfully scale our logistics, fulfillment, and customer service operations.
Average Monthly Unique Visitors
We define a monthly unique visitor as an individual who has visited our website or iOS/Android application within a calendar month, based on data provided by Google Analytics. We calculate average monthly unique visitors as the sum of monthly unique visitors in a given period, divided by the number of months in that period. We view average monthly unique visitors as a key indicator of the strength of our brand, the effectiveness of our advertising and merchandising campaigns, and consumer awareness of our brand. During 2024, the methodology used by Google Analytics to count unique visitors changed to include individuals visiting our iOS/Android application, in addition to those visiting our website. We believe this change allows us to more accurately calculate and reflect average monthly unique visitors. To conform to current period presentation, we have recast average monthly unique visitors for the year ended December 31, 2023. The change in measurement methodology resulted in 8.5% more average monthly unique visitors for the year ended December 31, 2023, compared to previously reported numbers.
Total Website Units
We define total website units as the number of vehicles listed on our website on the last day of a given reporting period, including vehicles available for sale, vehicles currently engaged in a purchase or reserved by a customer, and vehicles that can be reserved that generally have not yet completed the inspection and reconditioning process. We view total website units as a key measure of our growth. Growth in total website units increases the selection of vehicles available to our consumers, which we believe will allow us to increase the number of vehicles we sell over time. Moreover, growth in total website units indicates our ability to scale our vehicle purchasing, inspection and reconditioning operations. As part of our inventory strategy, over time we may choose not to expand total website units while continuing to grow sales, thereby improving other key operating metrics of the business.
Total Gross Profit per Unit
We define total gross profit per unit as the aggregate gross profit in a given period, divided by retail units sold in that period, including gross profit generated from the sale of retail vehicles, gains on the sales of loans originated to finance the vehicles, commissions on sales of VSCs, GAP waiver coverage, and other complementary products, and gross profit generated from wholesale sales of vehicles. We operate an integrated business with the objective of increasing the number of retail units sold and total gross profit per unit. Gross profits generated from the sale of retail and wholesale units are interrelated. For example, our nationwide reconditioning and inspection centers are designed to produce vehicles for both retail and wholesale sales, our vehicle storage locations have shared parking for both retail and wholesale vehicles, and our integrated multi-vehicle logistics and last mile delivery network is operated in service of both retail and wholesale sales. Such interrelationships require us to share finite operational capacity and optimize joint decisions between retail and wholesale sales, in order to position us to achieve our objective of increasing total gross profit per unit. As a result, the inclusion of gross profit generated from wholesale sales of vehicles in total gross profit per unit reflects our integrated business model and the interrelationship between wholesale and retail vehicle sales. We believe the total gross profit per unit metrics provide investors with the greatest opportunity to view our performance through the same lens that our management does, and therefore assists investors to best evaluate our business and measure our progress.
Total Gross Profit per Unit, Non-GAAP
We define total gross profit per unit, non-GAAP as the aggregate gross profit, non-GAAP in a given period, divided by retail units sold in that period. Gross profit, non-GAAP is defined as gross profit plus depreciation and amortization expense in cost of sales, share-based compensation expense in cost of sales, and restructuring expense, minus revenue related to warrants to purchase shares of Root's Class A common stock (the "Root Warrants") as discussed in Note 18 — Fair Value of Financial Instruments. Refer to "Non-GAAP Financial Measures" for more information, including the reconciliation of non-GAAP financial measures to the most directly comparable financial measures under generally accepted accounting principles in the United States ("GAAP").
Components of Results of Operations
Retail Vehicle Sales
Retail vehicle sales represent the aggregate sales of used vehicles to customers through our website. Revenue from retail vehicle sales is recognized upon delivery to the customer or pick up of the vehicle by the customer, and is reported net of a
reserve for expected returns. Factors affecting retail vehicle sales revenue include the number of retail units sold and the average selling price of these vehicles. Changes in retail units sold are a much larger driver of changes in revenue than are changes in average selling price.
Retail vehicle sales also include shipping and delivery fees and service revenue from retail marketplace transactions, which are retail marketplace partner vehicles sold to customers through Carvana, where we recognize revenue on the sale of the vehicle on a net basis, rather than recognizing the full amount of the vehicle sales price as revenue. As a result, an increase in retail marketplace units sold as a percentage of total retail units sold would lead to a decrease in retail revenue per unit sold, and vice versa, other things being equal.
The number of retail vehicles we sell depends on the volume of traffic to our website, our inventory selection, the effectiveness of our branding and marketing efforts, the quality of our customers' purchase experience, our volume of referrals and repeat customers, the competitiveness of our pricing, competition from other used car dealerships, and general macroeconomic and used car industry conditions. On a quarterly basis, the number of retail vehicles we sell is also affected by seasonality, with demand for retail vehicles generally reaching a seasonal high point late in the first quarter of each year, commensurate with the timing of tax refunds, and diminishing through the rest of the year, with the lowest relative level of retail vehicle sales generally expected to occur in the fourth calendar quarter. In 2023, heightened inflation and rising interest rates resulted in lower demand for used vehicles. Heightened inflation and interest rates persisted during the first several months of 2024, and, to a lesser extent, during the remainder of 2024, but were outweighed by seasonal demand associated with the timing of tax refunds and certain of our initiatives focused on growth in retail units sold.
Our revenue per retail unit depends on macroeconomic and used car industry conditions, the mix of vehicles we acquire, retail prices in our markets, our pricing strategy, our average days to sale, and the number of retail marketplace units sold. We may choose to shift our inventory mix to higher or lower cost vehicles, or to raise or lower our prices relative to market to take advantage of supply or demand imbalances, which could temporarily lead to average selling prices increasing or decreasing. We also generally expect lower average days to sale to be associated with higher retail average selling prices due to decreased vehicle depreciation prior to sale, all other factors being equal.
Wholesale Sales and Revenues
Wholesale sales and revenues include the aggregate proceeds we receive on vehicles we acquire and sell to wholesalers and wholesale marketplace revenues. The vehicles we sell to wholesalers are primarily acquired from customers who sell a vehicle to us without purchasing a retail vehicle and from our customers who trade-in their existing vehicles when making a purchase from us. Factors affecting wholesale sales and revenues include the number of wholesale units sold and the average wholesale selling price of these vehicles. The average selling price of our wholesale units is primarily driven by the mix of vehicles we sell to wholesalers, as well as general supply and demand conditions in the applicable wholesale vehicle market, including the level of depreciation in the wholesale vehicle market. Wholesale sales and revenues includes aggregate proceeds we receive on vehicles sold to DriveTime through competitive online auctions that are managed by an unrelated third party and through the Company's wholesale marketplace platform. Wholesale marketplace revenues include revenue earned from the sale of wholesale marketplace units by third-party sellers to buyers through our wholesale marketplace platform, including auction fees and related services revenue.
Other Sales and Revenues
We generate other sales and revenues primarily through the sales of loans we originate and sell in securitization transactions or to financing partners, reported net of a reserve for expected repurchases, commissions we receive on VSCs, sales of GAP waiver coverage, and auto insurance, including Root Warrants we receive on sales of auto insurance.
We generally seek to sell the loans we originate to securitization trusts we sponsor and establish or to financing partners. The securitization trusts issue asset-backed securities, some of which are collateralized by the finance receivables that we sell to the securitization trusts. We also sell the loans we originate under committed forward-flow arrangements, including a Master Purchase and Sale Agreement (as defined in Note 8 — Finance Receivables Sales Agreements of our consolidated financial statements included in Part II, Item 8, "Financial Statements and Supplementary Data," of this Annual Report on Form 10-K), and through fixed pool loan sales, with financing partners who generally acquire them at premium prices without recourse to us for their post-sale performance. Factors affecting revenue from these sales include the number of loans we originate, the average principal balance of the loans, the credit quality of the portfolio, the price at which we are able to sell them in securitization transactions or to financing partners, and economic conditions in the capital markets.
The number of loans we originate is driven by the number of retail vehicles sold and the percentage of our sales for which we provide financing, which is influenced by the financing terms we offer our customers relative to alternatives available to the customer. The average principal balance is driven primarily by the mix of vehicles we sell, since higher average selling prices typically mean higher average balances. The price at which we sell the loan is driven by the terms of our securitization transactions and forward-flow arrangement, applicable interest rates, and whether or not the loan includes GAP waiver coverage.
We receive a commission for selling VSCs that DriveTime administers under a master dealer agreement with DriveTime. The commission revenue we recognize on VSCs depends on the number of retail units we sell, the conversion rate of VSCs on these sales, commission rates we receive, VSC early cancellation frequency and product features. The GAP waiver coverage revenue we recognize depends on the number of retail units we sell, the number of customers that choose to finance their purchases with us, the frequency of GAP waiver coverage early cancellation, and the conversion rate of GAP waiver coverage on those sales.
Through our integrated auto insurance solution with Root, customers may conveniently access auto insurance directly from the Carvana e-commerce platform. We receive commissions and Root Warrants based on the Root insurance policies sold through the Integrated Platform. The commission revenue we recognize depends on the number of retail units we sell, the conversion rate of auto policies on those sales, commission rates we receive, and forecasted attrition. The revenue we recognize from Root Warrants as non-cash consideration depends on the probability of achieving certain auto policy sales thresholds within a specific timeline as well as our performance under the agreement with Root.
Cost of Sales
Cost of sales includes the cost to acquire, recondition, and transport vehicles associated with preparing them for resale, and wholesale marketplace cost of sales. Vehicle acquisition costs are driven by the mix of vehicles we acquire, the source of those vehicles, and supply-and-demand dynamics in the vehicle market. Reconditioning costs consist of direct costs, including parts, labor, and third-party repair expenses directly attributable to specific vehicles, as well as indirect costs, such as IRC overhead. Transportation costs consist of costs incurred to transport the vehicles from the point of acquisition to the IRC or other site. Cost of sales also includes any necessary adjustments to reflect vehicle inventory at the lower of cost or net realizable value. Wholesale marketplace cost of sales include costs related to the sale of wholesale marketplace units by third-party sellers through our wholesale marketplace platform, including labor, rent, depreciation and amortization.
Retail Vehicle Gross Profit
Retail vehicle gross profit is the vehicle sales price minus our costs of sales associated with vehicles that we list and sell on our website. Retail vehicle gross profit per unit is our aggregate retail vehicle gross profit in any measurement period divided by the number of retail units sold in that period.
Wholesale Gross Profit
Wholesale gross profit is the vehicle sales price minus our cost of sales associated with vehicles we sell to wholesalers, and wholesale marketplace revenues less wholesale marketplace cost of sales. Factors affecting wholesale gross profit include the number of wholesale units sold, the average wholesale selling price of these vehicles, the average acquisition price associated with these vehicles, the buyer and seller fees, and the number of wholesale marketplace units transacted.
Other Gross Profit
Other sales and revenues consist of 100% gross margin products for which gross profit equals revenue. Therefore, changes in gross profit and the associated drivers are identical to changes in revenues from these products and the associated drivers.
Selling, General and Administrative Expenses ("SG&A")
SG&A expenses include expenses associated with advertising and providing customer service to customers, including financing, title and registration and limited warranty services, operating our vending machines, hubs, physical auctions, logistics and fulfillment network and other corporate overhead expenses, including expenses associated with information technology, product development, engineering, legal, accounting, finance, and business development. SG&A expenses exclude the costs of inspecting and reconditioning vehicles and transporting vehicles from the point of acquisition to the IRC, which are
included in cost of sales, and payroll costs for our employees related to the development of software products for internal use, which are capitalized to software and depreciated over the estimated useful lives of the related assets.
Other Operating Expense, Net
Other operating expense, net primarily includes other general operating expenses such as gains or losses from disposals of long-lived assets.
Interest Expense
Interest expense includes interest incurred on our various tranches of Senior Secured Notes and Senior Unsecured Notes, our Floor Plan Facility, and our Finance Receivable Facilities (each as defined in Note 10 — Debt Instruments of our consolidated financial statements included in Part II, Item 8, "Financial Statements and Supplementary Data," of this Annual Report on Form 10-K), as well as our finance leases, and long-term debt, which are used to fund general working capital, our inventory, our transportation fleet, and certain of our property and equipment. Interest expense also includes amortization of capitalized debt issuance costs, which is offset by amortization of debt premium and interest income earned on cash and cash equivalents. Interest expense excludes the interest incurred during various construction projects to build, upgrade, or remodel certain facilities, which is capitalized to property and equipment and depreciated over the estimated useful lives of the related assets.
Other (Income) Expense, Net
Other (income) expense, net includes changes in fair value on our beneficial interests in securitizations, purchase price adjustment receivables, and fair value adjustments related to our Root Warrants as discussed in Note 18 — Fair Value of Financial Instruments of our consolidated financial statements included in Part II, Item 8, "Financial Statements and Supplementary Data," of this Annual Report on Form 10-K. Other (income) expense, net also includes expense related to our Tax Receivable Agreement ("TRA") liability. Refer to Note 15 — Income Taxes for further discussion of the TRA.
Income Tax (Benefit) Provision
Income taxes are recognized based upon our anticipated underlying annual blended federal and state income tax rates adjusted, as necessary, for any discrete tax matters occurring during the period. As the sole managing member of Carvana Group, LLC (together with its subsidiaries “Carvana Group”), Carvana Co. consolidates the financial results of Carvana Group. Carvana Group, LLC is treated as a partnership and therefore not subject to U.S. federal and most applicable state and local income tax purposes. Any taxable income or loss generated by Carvana Group is passed through to and included in the taxable income or loss of its members, including Carvana Co., based on its economic interest held in Carvana Group. Carvana Co. is taxed as a corporation and is subject to U.S. federal, state and local income taxes with respect to its allocable share of any taxable income or loss of Carvana Group, as well as any stand-alone income or loss generated by Carvana Co.
Results of Operations
| | | | | | | | | | | | | | | | | |
| Years Ended December 31, | | |
| 2024 | | 2023 | | Change |
| | | | | |
| (dollars in millions, except per unit amounts) | | |
| Net sales and operating revenues: | | | | | |
| Retail vehicle sales, net | $ | 9,681 | | | $ | 7,514 | | | 28.8 | % |
Wholesale sales and revenues (1) | 2,841 | | | 2,504 | | | 13.5 | % |
Other sales and revenues (2) | 1,151 | | | 753 | | | 52.9 | % |
| Total net sales and operating revenues | $ | 13,673 | | | $ | 10,771 | | | 26.9 | % |
| Gross profit: | | | | | |
Retail vehicle gross profit | $ | 1,379 | | | $ | 746 | | | 84.9 | % |
Wholesale gross profit (1) | 346 | | | 225 | | | 53.8 | % |
Other gross profit (2) | 1,151 | | | 753 | | | 52.9 | % |
| Total gross profit | $ | 2,876 | | | $ | 1,724 | | | 66.8 | % |
| Unit sales information: | | | | | |
| Retail vehicle unit sales | 416,348 | | | 312,847 | | | 33.1 | % |
| Wholesale vehicle unit sales | 199,780 | | | 156,545 | | | 27.6 | % |
| Per unit revenue: | | | | | |
| Retail vehicles | $ | 23,252 | | | $ | 24,018 | | | (3.2) | % |
Wholesale vehicles (3) | $ | 9,611 | | | $ | 10,527 | | | (8.7) | % |
| Per retail unit gross profit: | | | | | |
Retail vehicle gross profit | $ | 3,312 | | | $ | 2,385 | | | 38.9 | % |
| Wholesale gross profit | 831 | | | 719 | | | 15.6 | % |
| Other gross profit | 2,765 | | | 2,407 | | | 14.9 | % |
| Total gross profit | $ | 6,908 | | | $ | 5,511 | | | 25.3 | % |
| Per wholesale unit gross profit: | | | | | |
Wholesale vehicle gross profit (4) | $ | 996 | | | $ | 888 | | | 12.2 | % |
| Wholesale marketplace: | | | | | |
| Wholesale marketplace units transacted | 955,802 | | | 871,200 | | | 9.7 | % |
| Wholesale marketplace revenues | $ | 921 | | | $ | 856 | | | 7.6 | % |
Wholesale marketplace gross profit (5) | $ | 147 | | | $ | 86 | | | 70.9 | % |
(1) Includes $28 and $19, respectively, of wholesale sales and revenues from related parties.
(2) Includes $200 and $145, respectively, of other sales and revenues from related parties.
(3) Excludes wholesale marketplace revenues and wholesale marketplace units transacted.
(4) Excludes wholesale marketplace gross profit and wholesale marketplace units transacted.
(5) Includes $86 and $102, respectively, of depreciation and amortization expense.
Retail Vehicle Sales
Retail vehicle sales increased by $2.2 billion to $9.7 billion during the year ended December 31, 2024 compared to $7.5 billion during the year ended December 31, 2023. The increase in revenue was primarily due to an increase in the number of retail vehicles sold to 416,348 from 312,847 during the years ended December 31, 2024 and 2023, respectively, partially offset by a decrease in retail revenue per retail unit sold to $23,252 in the year ended December 31, 2024 from $24,018 in the prior year, due primarily to higher retail marketplace units sold as a share of total retail units sold, partially offset by faster turn times, compared to the year ended December 31, 2023.
Wholesale Sales and Revenues
Wholesale sales and revenues increased by $337 million to $2.8 billion during the year ended December 31, 2024, compared to $2.5 billion during the year ended December 31, 2023. The increase in revenue was primarily due to an increase in the number of wholesale units sold to 199,780 from 156,545 during the years ended December 31, 2024 and 2023, respectively. The increase in wholesale units sold was primarily a result of an increase in overall vehicle acquisitions during the year ended December 31, 2024 compared to the year ended December 31, 2023. The increase was partially offset by higher overall depreciation in the wholesale vehicle market as the wholesale revenue per wholesale unit sold decreased to $9,611 from $10,527 during the years ended December 31, 2024 and 2023, respectively. Additionally, wholesale marketplace revenues were higher during the year ended December 31, 2024 at $921 million, compared to $856 million during the year ended December 31, 2023, primarily due to an increase in the number of wholesale marketplace units transacted to 955,802 from 871,200 during the years ended December 31, 2024 and 2023, respectively.
Other Sales and Revenues
Other sales and revenues increased by $398 million to $1.2 billion during the year ended December 31, 2024, compared to $753 million during the year ended December 31, 2023. The increase was primarily due to an increase in gain on loan sales as a result of increased retail units sold, more loan sales, and higher loan sale spreads during the year ended December 31, 2024.
Retail Vehicle Gross Profit
Retail vehicle gross profit increased by $633 million to $1.4 billion during the year ended December 31, 2024, compared to $746 million during the year ended December 31, 2023. This increase was driven primarily by an increase in the number of retail vehicles sold to 416,348 from 312,847 during the years ended December 31, 2024 and 2023, respectively. Additionally, retail vehicle gross profit per unit increased to $3,312 for the year ended December 31, 2024, compared to $2,385 for the year ended December 31, 2023. The per unit increase was primarily driven by lower average days to sale, lower vehicle acquisition costs relative to sales prices, and lower reconditioning and inbound transport costs on retail vehicles sold during the year ended December 31, 2024.
Wholesale Gross Profit
Wholesale gross profit increased by $121 million to $346 million during the year ended December 31, 2024, compared to $225 million during the year ended December 31, 2023. This increase was primarily driven by an increase in wholesale units sold to 199,780 from 156,545 during the years ended December 31, 2024 and 2023, respectively, along with an increase in wholesale vehicle gross profit per wholesale unit to $996 from $888, respectively. The increase in wholesale units sold was primarily a result of an increase in overall vehicle acquisitions during the year ended December 31, 2024 compared to the year ended December 31, 2023. The increase in wholesale vehicle gross profit per wholesale unit was primarily a result of lower vehicle acquisition costs relative to sales prices during the year ended December 31, 2024. Additionally, the increase was driven by an increase in marketplace gross profit by $61 million to $147 million during the year ended December 31, 2024, compared to $86 million during the year ended December 31, 2023, due to an increase in the number of wholesale marketplace units transacted to 955,802 from 871,200 during the years ended December 31, 2024 and 2023, respectively.
Other Gross Profit
Other sales and revenues consist of 100% gross margin products for which gross profit equals revenue. Therefore, changes in other gross profit and the associated drivers are identical to changes in other sales and revenues and the associated drivers.
Components of SG&A
| | | | | | | | | | | |
| Years Ended December 31, |
| 2024 | | 2023 |
| | | |
| (in millions) |
Compensation and benefits (1) | $ | 700 | | | $ | 661 | |
| | | |
| Advertising | 229 | | | 228 | |
Market occupancy (2) | 68 | | | 71 | |
Logistics (3) | 118 | | | 119 | |
Other (4) | 759 | | | 717 | |
| Total | $ | 1,874 | | | $ | 1,796 | |
(1) Compensation and benefits includes all payroll and related costs, including benefits, payroll taxes, and equity-based compensation, except those related to preparing vehicles for sale, which are included in cost of sales, and those related to the development of software products for internal use, which are capitalized to software and depreciated over the estimated useful lives of the related assets.
(2) Market occupancy costs includes occupancy costs of our vending machine and hubs. It excludes occupancy costs related to reconditioning vehicles which are included in cost of sales and the portion related to corporate occupancy which are included in other costs.
(3) Logistics includes fuel, maintenance and depreciation related to operating our own transportation fleet, and third-party transportation fees, except the portion related to inbound transportation, which is included in cost of sales.
(4) Other costs include all other selling, general and administrative expenses such as IT expenses, corporate occupancy, professional services and insurance, limited warranty, and title and registration.
Selling, general and administrative expenses increased by $78 million to $1.9 billion during the year ended December 31, 2024 compared to $1.8 billion during the year ended December 31, 2023, primarily due to higher employee headcount and other SG&A expenses, primarily associated with higher retail units sold.
Other Operating Expense, Net
Other operating expense, net increased by $4 million to $12 million during the year ended December 31, 2024 compared to $8 million during the year ended December 31, 2023, due to higher disposals of long-lived assets.
Interest Expense
Interest expense increased by $19 million to $651 million during the year ended December 31, 2024 compared to $632 million during the year ended December 31, 2023, primarily due to increased interest on the Senior Secured Notes, partially offset by lower interest on the Senior Unsecured Notes, floor plan facility, and finance receivable facilities, and higher interest income.
Loss (Gain) on Debt Extinguishment
Loss on debt extinguishment was $12 million during the year ended December 31, 2024, due to the repurchase of $370 million of 2028 Senior Secured Notes in the open market for $384 million, which included $8 million of accrued interest and $1 million in pro-rata write-offs of unamortized debt issuance costs and unamortized premium. Additionally, in the year ended December 31, 2024 the Company redeemed $100 million of 2028 Senior Secured Notes for $108 million, which included $3 million of accrued interest. Gain on debt extinguishment was $878 million during the year ended December 31, 2023, due to the exchange of $5.5 billion in principal of Senior Unsecured Notes for $4.2 billion in principal of Senior Secured Notes and $341 million in cash, along with the write off of $66 million of debt issuance costs and a $40 million deferred premium on a portion of the Senior Secured Notes.
Other (Income) Expense, Net
Other (income) expense, net was income of $73 million during the year ended December 31, 2024 and was primarily due to a $115 million increase in the fair value of Root Warrants and a $23 million increase in the fair value of beneficial interests in securitizations, partially offset by $67 million of TRA expense. Other (income) expense, net was income of $9 million during the year ended December 31, 2023 and was primarily due to a $14 million increase in the fair value of beneficial interests in
securitizations, $6 million of other income, and a $3 million increase in the fair value of Root Warrants, partially offset by $14 million of TRA expense.
Income Tax (Benefit) Provision
Income tax (benefit) provision changed by $29 million to a benefit of $4 million during the year ended December 31, 2024 compared to an expense of $25 million during the year ended December 31, 2023. The change was primarily due to the income tax expense related to the cancellation of debt income recognized on the exchange of $5.5 billion in principal of Senior Unsecured Notes for $4.2 billion in principal of Senior Secured Notes and $341 million in cash during the year ended December 31, 2023.
Non-GAAP Financial Measures
To supplement the consolidated financial statements, which are prepared and presented in accordance with U.S. GAAP, we also present the following non-GAAP measures: Adjusted EBITDA; Adjusted EBITDA margin; Gross profit, non-GAAP; Total gross profit per retail unit, non-GAAP; SG&A expenses, non-GAAP; and Total SG&A expenses per retail unit, non-GAAP.
Adjusted EBITDA; Adjusted EBITDA margin; Gross profit, non-GAAP; Total gross profit per retail unit, non-GAAP; SG&A expenses, non-GAAP; and Total SG&A expenses per retail unit, non-GAAP
Adjusted EBITDA; Adjusted EBITDA margin; Gross profit, non-GAAP; Total gross profit per retail unit, non-GAAP; SG&A expenses, non-GAAP; and Total SG&A expenses per retail unit, non-GAAP are supplemental measures of operating performance that do not represent and should not be considered an alternative to net income (loss), gross profit, or SG&A expenses, as determined by GAAP.
Adjusted EBITDA is defined as net income (loss) plus income tax (benefit) provision, interest expense, other operating expense, net, other (income) expense, net, depreciation and amortization expense in cost of sales and SG&A expenses, share-based compensation expense in cost of sales and SG&A expenses, goodwill impairment, loss on debt extinguishment, and restructuring expense, minus revenue related to our Root Warrants and gain on debt extinguishment. Adjusted EBITDA margin is Adjusted EBITDA as a percentage of total revenues.
Gross profit, non-GAAP is defined as GAAP gross profit plus depreciation and amortization expense in cost of sales, share-based compensation expense in cost of sales, and restructuring expense in cost of sales, minus revenue related to our Root Warrants. Total gross profit per retail unit, non-GAAP is Gross profit, non-GAAP divided by retail vehicle unit sales.
SG&A expenses, non-GAAP is defined as GAAP SG&A expenses minus depreciation and amortization expense in SG&A expenses, share-based compensation expense in SG&A expenses, and restructuring expense in SG&A expenses. Total SG&A expenses per retail unit, non-GAAP is SG&A expenses, non-GAAP divided by retail vehicle unit sales.
We use these non-GAAP measures to measure the operating performance of our business as a whole and relative to our total revenues and retail vehicle unit sales. We believe that these metrics are useful measures to us and to our investors because they exclude certain financial, capital structure, and non-cash items that we do not believe directly reflect our core operations and may not be indicative of our recurring operations, in part because they may vary widely across time and within our industry independent of the performance of our core operations. We believe that excluding these items enables us to more effectively evaluate our performance period-over-period and relative to our competitors. Adjusted EBITDA; Adjusted EBITDA margin; Gross profit, non-GAAP; Total gross profit per retail unit, non-GAAP; SG&A expenses, non-GAAP; and Total SG&A expenses per retail unit, non-GAAP may not be comparable to similarly titled measures provided by other companies due to potential differences in methods of calculations.
A reconciliation of Adjusted EBITDA to net income (loss), Gross profit, non-GAAP to gross profit, and SG&A expenses, non-GAAP to SG&A expenses, which are the most directly comparable GAAP measures, and calculations of Adjusted EBITDA margin, Total gross profit per retail unit, non-GAAP, and Total SG&A expenses per retail unit, non-GAAP is as follows:
| | | | | | | | | | | | | | | | | |
| Years Ended December 31, |
| 2024 | | 2023 | | 2022 |
| | | | | |
| (dollars in millions, except per unit amounts) |
| Net income (loss) | $ | 404 | | | $ | 150 | | | $ | (2,894) | |
| Income tax (benefit) provision | (4) | | | 25 | | | 1 | |
| Interest expense | 651 | | | 632 | | | 486 | |
| Other operating expense, net | 12 | | | 8 | | | 14 | |
Other (income) expense, net | (73) | | | (9) | | | 56 | |
| Depreciation and amortization expense in cost of sales | 140 | | | 169 | | | 114 | |
| Depreciation and amortization expense in SG&A expenses | 165 | | | 183 | | | 200 | |
| Share-based compensation expense in cost of sales | 1 | | | — | | | 16 | |
| Share-based compensation expense in SG&A expenses | 91 | | | 73 | | | 69 | |
| Goodwill impairment | — | | | — | | | 847 | |
| Root warrant revenue | (21) | | | (21) | | | (7) | |
Loss (Gain) on debt extinguishment | 12 | | | (878) | | | — | |
Restructuring expense (1) | — | | | 7 | | | 57 | |
| Adjusted EBITDA | $ | 1,378 | | | $ | 339 | | | $ | (1,041) | |
| | | | | |
| Total revenues | $ | 13,673 | | | $ | 10,771 | | | $ | 13,604 | |
| Net income (loss) margin | 3.0 | % | | 1.4 | % | | (21.3) | % |
| Adjusted EBITDA margin | 10.1 | % | | 3.1 | % | | (7.7) | % |
| | | | | |
| Gross profit | $ | 2,876 | | | $ | 1,724 | | | $ | 1,246 | |
| Depreciation and amortization expense in cost of sales | 140 | | | 169 | | | 114 | |
| Share-based compensation expense in cost of sales | 1 | | | — | | | 16 | |
| Root warrant revenue | (21) | | | (21) | | | (7) | |
Restructuring expense in cost of sales (1) | — | | | — | | | 7 | |
| Gross profit, non-GAAP | $ | 2,996 | | | $ | 1,872 | | | $ | 1,376 | |
| | | | | |
| Retail vehicle unit sales | 416,348 | | | 312,847 | | | 412,296 | |
| Total gross profit per retail unit | $ | 6,908 | | | $ | 5,511 | | | $ | 3,022 | |
| Total gross profit per retail unit, non-GAAP | $ | 7,196 | | | $ | 5,984 | | | $ | 3,337 | |
| | | | | |
| SG&A expenses | $ | 1,874 | | | $ | 1,796 | | | $ | 2,736 | |
| Depreciation and amortization expense in SG&A expenses | 165 | | | 183 | | | 200 | |
| Share-based compensation expense in SG&A expenses | 91 | | | 73 | | | 69 | |
Restructuring expense in SG&A expenses (1) | — | | | 7 | | | 50 | |
| SG&A expenses, non-GAAP | $ | 1,618 | | | $ | 1,533 | | | $ | 2,417 | |
| | | | | |
| Retail vehicle unit sales | 416,348 | | | 312,847 | | | 412,296 | |
| Total SG&A expenses per retail unit | $ | 4,501 | | | $ | 5,741 | | | $ | 6,636 | |
| Total SG&A expenses per retail unit, non-GAAP | $ | 3,886 | | | $ | 4,900 | | | $ | 5,862 | |
(1) For the year ended December 31, 2022, includes $28 million of lease termination fees, net of amounts written off for the corresponding operating lease right-of-use assets and operating lease liabilities which were terminated, $26 million of expenses associated with workforce reductions, of which $7 million was recorded to cost of sales, and $3 million of other restructuring-related costs.
Liquidity and Capital Resources
General
We generate cash from the sale of retail vehicles, wholesale vehicles, loans we originate, and VSCs, GAP waiver coverage, and other complementary products. We generate additional cash flows through our financing activities including our short-term revolving inventory and finance receivable facilities and real estate and equipment financing, the issuance of debt securities, and new issuances of equity. Historically, cash generated from financing activities has funded growth and expansion into new markets and strategic initiatives and we expect this to continue in the future.
In response to the macroeconomic environment, our focus in past years has been on driving profitability through initiatives to better conform our expense structure to unit volume levels and create a strong operational foundation, allowing us to shift focus throughout 2024 to the long-term phase of driving profitable growth. We expect to continue our focus on profitability initiatives as we continue to grow. We expect our primary sources of cash to continue to be sufficient to fund our operating activities and cash commitments for investing and financing activities for at least the next 12 months.
Our ability to service our debt and fund working capital, capital expenditures, and business development efforts in the long-term depends on our ability to generate cash from operating and financing activities, which is subject to our future operating performance, as well as to general economic, financial, competitive, legislative, regulatory, and other conditions, some of which are beyond our control. Our future capital requirements depend on many factors, including our ability to generate cash from operating activities, our ability to refinance indebtedness, our ability to obtain supplemental liquidity through debt, equity, including the issuance of equity pursuant to our ATM Program, strategic relationships or other arrangements on terms available or acceptable to us, our rate of revenue growth, our construction of IRCs and vending machines, the timing and extent of our spending to support our technology and software development efforts, our advertising spend, and increased population coverage. If we need to obtain supplemental liquidity, there can be no assurance that financing alternatives will be available in sufficient amounts or on terms acceptable to us in the future.
On July 19, 2023, the Company entered into an agreement (the "Distribution Agreement") to establish an ATM Program, and on July 31, 2024, the Company refreshed the ATM Program by entering into an Amended and Restated Distribution Agreement with Barclays Capital Inc., Citigroup Global Markets Inc., Moelis & Company LLC, and Virtu Americas LLC. Under the ATM Program as of December 31, 2024, the Company could sell up to the greater of (i) shares of Class A common stock representing an aggregate offering price of $1.0 billion, or (ii) an aggregate of 35 million shares of Class A common stock, from time to time. In the year ended December 31, 2024, we issued 6.8 million shares of Class A common stock at a weighted-average issuance price per share of $186.56, for gross proceeds of $1.3 billion, which we are using for general corporate purposes. However, there can be no assurance that we will sell further shares of Class A common stock through the ATM Program, or otherwise. See Item 9B “Other Information” for a description of amendments to the ATM Program after December 31, 2024.
Finally, subject to the restrictions in the indentures governing the Senior Secured Notes, we or our affiliates have and may again, at any time, and from time to time, repurchase shares of our Class A common stock, our Senior Unsecured Notes, our Senior Secured Notes, or any other securities we may issue, from time to time, in open market transactions, privately negotiated transactions, in exchange for property or other securities or otherwise. In addition, subject to the restrictions in the indentures governing the Senior Secured Notes and the terms of such notes and our Senior Unsecured Notes, we have and may again, redeem all or portions of such notes. During the year ended December 31, 2024, we repurchased and cancelled $370 million of principal amount of 2028 Senior Secured Notes and redeemed $100 million of 2028 Senior Secured Notes. Any additional repurchase or redemption decisions will be made after consideration of market conditions and liquidity needs and will be upon such terms and at such prices as we determine appropriate. However, there is no guarantee that a repurchase or redemption will take place.
Liquidity Resources
We had the following committed liquidity resources, secured debt capacity, and other unpledged assets available as of December 31, 2024 and 2023:
| | | | | | | | | | | |
| December 31, |
| 2024 | | 2023 |
| | | |
| (in millions) |
| Cash and cash equivalents | $ | 1,716 | | | $ | 530 | |
Availability under short-term revolving facilities (1) | 1,879 | | | 1,006 | |
| Committed liquidity resources available | $ | 3,595 | | | $ | 1,536 | |
| | | |
| Super senior debt capacity | 1,500 | | | 1,262 | |
| Pari passu senior debt capacity | 485 | | | 250 | |
| Unpledged beneficial interests in securitizations | 110 | | | 80 | |
| Total liquidity resources | $ | 5,690 | | | $ | 3,128 | |
(1) Based on pledging all eligible vehicles and finance receivables under the Floor Plan Facility and Finance Receivables Facilities, excluding the impact to restricted cash requirements.
Our total liquidity potential is composed of cash and cash equivalents, availability under existing credit facilities, additional capacity under the indentures governing our Senior Secured Notes, which allow us to incur additional debt that can be senior or pari passu in lien priority as to the collateral securing the obligations under the Senior Secured Notes, and additional unpledged securities that can be financed using traditional asset-based financing sources.
Cash and cash equivalents includes cash deposits and highly liquid investment instruments with original maturities of three months or less, such as money market funds.
Availability under short-term revolving facilities is the available amount we can borrow under the Floor Plan Facility and Finance Receivable Facilities based on the value of pledgeable vehicle inventory and finance receivables on our balance sheet on the period end date. Availability under short-term revolving facilities is distinct from the total commitment amount of these facilities because it represents the amount we are able to borrow as of period end, rather than committed future amounts that could be borrowed to finance future additional assets. Effective November 1, 2023, we amended our vehicle inventory Floor Plan Facility to resize the line of credit to $1.5 billion through April 30, 2025.
As of December 31, 2024 and 2023, the short-term revolving facilities had a total commitment of $4.2 billion each period, an outstanding balance of $67 million and $668 million, respectively, and unused capacity of $4.1 billion and $3.5 billion, respectively.
Super senior debt capacity and pari passu senior debt capacity represents basket capacity to incur additional debt that could be senior or pari passu in lien priority as to the collateral securing the obligations under the Senior Secured Notes, subject to the terms and conditions set forth in the indentures governing the Senior Secured Notes. The availability of such additional sources depends on many factors and there can be no assurance that financing alternatives will be available to us in the future.
Unpledged beneficial interests in securitizations includes retained beneficial interests in securitizations that have not been previously pledged or sold. We historically have financed the majority of our retained beneficial interests in securitizations and expect to continue to do so in the future.
Additionally, in January 2025, we amended our Master Purchase and Sale Agreement to, among other things, reestablish the commitment by the purchaser to purchase up to $4.0 billion of principal balances of finance receivables between January 3, 2025 and January 2, 2026. See Note 8 — Finance Receivable Sale Agreements, included in Part II, Item 8, "Financial Statements and Supplementary Data," of this Annual Report on Form 10-K for discussion regarding principal balances and unused capacity under the Master Purchase and Sale Agreement.
To optimize our cost of capital, in any given period we may choose not to maximize borrowings on our short-term revolving facilities, maximize revolving commitment size, or immediately sale-leaseback real estate; and we may also choose to
retain beneficial interests in securitizations for varying amounts of time. This has the benefit of reducing interest expense and debt issuance costs and providing flexibility to minimize financing costs over time.
We consider our total liquidity resources as an input into our planning. In general, changes in total liquidity resources fall into two broad categories: changes due to current business operations and changes due to investments in automotive retail assets.
Changes in liquidity due to current business operations include impacts from fluctuations in Adjusted EBITDA, non-real estate capital expenditures, including technology, furniture, fixtures, and equipment, and changes in traditional working capital, including accounts receivable, accounts payable, accrued expenses, and other miscellaneous assets and liabilities.
In the ordinary course of business, we sponsor and engage in securitization transactions to sell our finance receivables to a diverse pool of investors. These securitizations involve unconsolidated variable interest entities in which we retain at least 5% of the credit risk of the underlying finance receivable by holding at least 5% of the notes and certificates issued by these entities. We are exposed to market risk in the securitization market. See Note 9 — Securitizations and Variable Interest Entities, included in Part II, Item 8, "Financial Statements and Supplementary Data," of this Annual Report on Form 10-K for further discussion regarding our transactions with unconsolidated variable interest entities.
In addition we also invest in and generate several types of assets, including vehicle inventory, finance receivables, retained beneficial interests in securitizations, and real estate. To maximize capital efficiency, we generally seek to finance these assets with matched sources of asset-based financing, including short-term revolving facilities for vehicle inventory and finance receivables, beneficial interests financing for retained beneficial interests in securitizations, and sale-leaseback or other real estate financing for IRCs and vending machines. We have historically used these sources of financing to finance our investment in these assets and expect to continue to do so in the future.
As of December 31, 2024 and 2023, our outstanding principal amount of indebtedness was $5.5 billion and $6.0 billion, respectively, summarized in the table below. See Note 10 — Debt Instruments and Note 16 — Leases of our consolidated financial statements included in Part II, Item 8, "Financial Statements and Supplementary Data," of this Annual Report on Form 10-K for further information on our debt.
| | | | | | | | | | | |
| December 31, |
| 2024 | | 2023 |
| | | |
| (in millions) |
| Asset-Based Financing: | |
| Floor plan facility | $ | 67 | | $ | 113 |
| Finance receivable facilities | — | | | 555 |
| Financing of beneficial interests in securitizations | 354 | | 293 |
| | | |
| Real estate financing | 485 | | 485 |
| Total asset-based financing | 906 | | 1,446 |
Senior Secured Notes (1) | 4,358 | | 4,378 |
Senior Unsecured Notes | 205 | | 205 |
| Total debt | 5,469 | | 6,029 |
| Less: current portion | (302) | | (777) |
Less: unamortized debt issuance costs (2) | (46) | | (60) |
Plus: unamortized premium (3) | 27 | | 37 |
| Total included in long-term debt, net | $ | 5,148 | | $ | 5,229 |
(1) Includes $105 million and $185 million of accrued paid-in-kind ("PIK") interest as of December 31, 2024 and 2023, respectively. Accrued PIK interest increases the principal amount of Senior Secured Notes on each semi-annual interest payment date.
(2) The unamortized debt issuance costs related to long-term debt are presented as a reduction of the carrying amount of the corresponding liabilities on the accompanying consolidated balance sheets. Unamortized debt issuance costs related to revolving debt arrangements are presented within other assets on our consolidated balance sheets and not included here.
(3) The unamortized premium relates to a portion of the notes exchange offers completed in September 2023 which were accounted for as a debt modification.
Cash Flows
The following table presents a summary of our consolidated cash flows from operating, investing, and financing activities for the years ended December 31, 2024, and 2023:
| | | | | | | | | | | | | |
| Years Ended December 31, |
| 2024 | | 2023 | | |
| | | | | |
| (in millions) |
Net cash provided by operating activities | $ | 918 | | | $ | 803 | | | |
| Net cash (used in) provided by investing activities | (13) | | | 31 | | | |
| Net cash provided by (used in) financing activities | 261 | | | (868) | | | |
Net increase (decrease) in cash, cash equivalents and restricted cash | 1,166 | | | (34) | | | |
| Cash, cash equivalents, and restricted cash at beginning of period | 594 | | | 628 | | | |
| Cash, cash equivalents, and restricted cash at end of period | $ | 1,760 | | | $ | 594 | | | |
Operating Activities
Our primary sources of operating cash flows result from the sales of retail vehicles, wholesale vehicles, loans we originate, and VSCs, GAP waiver coverage, and other complementary products. Our primary uses of cash from operating activities are purchases of inventory, personnel-related expenses, and cash used to acquire customers. Cash provided by operating activities was $918 million and $803 million for the years ended December 31, 2024 and 2023, respectively, an increase in cash provided by operating activities of $115 million, primarily due to an improvement in operating results and a $274 million reduction in interest paid due to higher PIK interest on the Senior Secured Notes in the year ended December 31, 2024, partially offset by increased vehicle inventory acquisitions and a lower ratio of finance receivables sold relative to originations of finance receivables.
Investing Activities
Our primary use of cash for investing activities is purchases of property and equipment. Cash used in and provided by investing activities was $13 million and $31 million during the years ended December 31, 2024 and 2023, respectively, an increase in cash used in investing activities of $44 million, primarily driven by lower proceeds received from the sale of property and equipment in the year ended December 31, 2024, partially offset by increased principal payments received on and proceeds from the sale of beneficial interests in securitizations during the year ended December 31, 2024.
Financing Activities
Cash flows from financing activities primarily relate to our short and long-term debt activity, including proceeds from and payments on our short-term revolving facilities. Cash provided by and used in financing activities was $261 million and $868 million during the years ended December 31, 2024 and 2023, respectively, an increase in cash provided by financing activities of $1.1 billion primarily driven by higher net proceeds from our ATM Program and lower reliance on short-term revolving facilities during the year ended December 31, 2024.
Contractual Obligations and Commitments
We are party to contractual obligations involving commitments to third parties for which we believe we have sufficient liquidity to fund our operations and meet our obligations as they come due. These contractual obligations impact our liquidity and future capital requirements and primarily consist of long-term debt and related interest payments, leases, short-term revolving facilities, financing of beneficial interests in securitizations, and other purchase obligations and commitments. See Note 8 — Finance Receivable Sale Agreements, Note 10 — Debt Instruments, Note 16 — Leases, and Note 17 — Commitments and Contingencies of the consolidated financial statements included in Part II, Item 8, "Financial Statements and Supplementary Data," of this Annual Report on Form 10-K, for more information related to these contractual obligations and commitments.
Fair Value Measurements
We report money market securities, certain receivables, warrants to acquire Root's Class A common stock and beneficial interests in securitizations at fair value. See Note 18 — Fair Value of Financial Instruments, included in Part II, Item 8, "Financial Statement and Supplementary Data," of this Annual Report on Form 10-K, which is incorporated into this item by reference.
Critical Accounting Estimates
The discussion and analysis of our financial condition and results of operations are based upon our consolidated financial statements, which have been prepared in accordance with GAAP. The preparation of these financial statements requires management to make estimates and judgments that affect the reported amounts of assets and liabilities, revenue and expenses and related disclosures of contingent assets and liabilities at the date of our financial statements. Actual results may differ from these estimates under different assumptions or conditions, impacting our reported results of operations and financial condition.
Certain accounting policies involve significant judgments and assumptions by management, which have a material impact on the carrying value of assets and liabilities and the recognition of income and expenses. The estimates and assumptions used by management are based on historical experience and other factors, which are believed to be reasonable under the circumstances. The significant accounting estimates which we believe are the most critical to aid in fully understanding and evaluating our reported financial results and have had or are reasonably likely to have a material impact on our financial condition or results of operation are described below. Refer to Note 2 — Summary of Significant Accounting Policies of the consolidated financial statements included in Part II, Item 8, "Financial Statements and Supplementary Data," of this Annual Report on Form 10-K, for more detailed information regarding our critical accounting policies.
Revenue Recognition
We sell retail vehicles directly to our customers through our website. We recognize revenue upon delivery to the customer or pick up of the vehicle by a customer at the agreed upon purchase price stated in the contract, including any delivery charges, less an estimate for returns. Our return policy allows customers to initiate a return during the first seven days after delivery. Estimates for returns are based on an analysis of historical experience, trends and sales data. Changes in these estimates are reflected as an adjustment to revenue in the period identified.
Customers purchasing retail vehicles from us may enter into contracts for VSCs and, if they finance with us, GAP waiver coverage. The prices of VSCs and GAP waiver coverage are set forth in each contract. We sell and receive a commission on VSCs under a master dealer agreement with DriveTime, pursuant to which we sell VSCs that DriveTime administers and is the obligor. We receive a commission on GAP waiver coverage contracts where the administrator of the contract is obligated to reimburse the holder of the underlying finance receivable for a balance that is in excess of the value of the financed vehicle in the event of a total loss. We recognize commission revenue at the time of sale, net of a reserve for estimated contract cancellations. Our risk related to contract cancellations is limited to the commissions that we receive. Cancellations fluctuate depending on the customer-financing default or prepayment rates, and shifts in customer behavior, including those related to changes in the coverage or term of the product. To the extent that actual experience differs from historical trends, there could be significant adjustments to our contract cancellation reserves. The reserve for cancellations of VSCs and GAP waiver coverage is estimated based upon historical experience and recent trends and is reflected as a reduction of other sales and revenues. Changes in these estimates are reflected as an adjustment to revenue in the period identified.
Under the master dealer agreement with DriveTime, we are also contractually entitled to receive profit-sharing revenues based on the performance of the VSCs once a required claims period has passed. This is a form of variable consideration we recognize as revenue to the extent that it is probable that it will not result in a significant revenue reversal. We apply the expected value method, utilizing expected VSC performance based on historical claims and cancellation data from our customers, as well as other qualitative assumptions to estimate the amount we expect to receive. We reassess the estimate each reporting period with any changes reflected as an adjustment to other sales and revenues in the period identified. Profit-sharing payments will begin when the underlying VSCs reach a specified level of claims history.
Finance Receivables
Finance receivables include installment contracts we originate to facilitate vehicle sales. We classify these receivables as held for sale, as we do not intend to hold the finance receivables we originate to maturity. We typically sell the finance
receivables we originate. We record a valuation allowance to report finance receivables at the lower of unpaid principal balance or fair value. To determine the fair value of finance receivables we utilize industry-standard modeling, such as discounted cash flow analysis, factoring in our historical experience, the credit quality of the underlying receivables, loss trends and recovery rates, as well as the overall economic environment. For purposes of determining the valuation allowance, finance receivables are evaluated collectively to determine the allowance as they represent a large group of smaller-balance homogeneous loans. To the extent that actual experience differs from historical trends, there could be significant adjustments to our valuation allowance. Principal balances of finance receivables are charged-off when we are unable to sell the finance receivable and the related vehicle has been repossessed and liquidated or the receivable has otherwise been deemed uncollectible. The estimates and trends used have historically been effective in our determination of our valuation allowance.
Beneficial Interests in Securitizations
The Company's beneficial interests in securitizations include rated notes and certificates and other assets, all of which are classified as Level 3 due to the lack of observable market data. The Company determines the fair value of its rated notes based on non-binding broker quotes. The non-binding broker quotes are based on models that consider the prevailing interest rates, recent market transactions, and current business conditions. The Company determines the fair value of its certificates and other assets using a combination of non-binding market quotes and internally developed discounted cash flow models. The discounted cash flow models use discount rates based on prevailing interest rates and the characteristics of the specific instruments. See Note 18 — Fair Value of Financial Instruments, included in Part II, Item 8, "Financial Statements and Supplementary Data," of this Annual Report on Form 10-K for further detail on the discount rates.
Significant increases or decreases in the inputs to the models could result in a significantly higher or lower fair value measurement. The Company elected the fair value option on its beneficial interests in securitizations, which allows it to recognize changes in the fair value of these assets in the period the fair value changes resulting in a gain or loss in that period.
Valuation of Inventory
Vehicle inventory consists of used vehicles, primarily acquired directly from customers and at auction. Direct and indirect vehicle reconditioning costs including parts and labor, inbound transportation costs and other incremental costs are capitalized as a component of inventory. Inventory is stated at the lower of cost or net realizable value. Vehicle inventory cost is determined by specific identification. Net realizable value is the estimated selling price less costs to complete, dispose and transport the vehicles. Selling prices are derived from historical data and trends, such as sales price and inventory turn times of similar vehicles, as well as independent market resources. Each reporting period we recognize any necessary adjustments to reflect vehicle inventory at the lower of cost or net realizable value through cost of sales. To the extent that there are significant changes to estimated vehicle selling prices or decreases in demand for used vehicles, there could be significant adjustments to reflect our inventory at net realizable value.
Income Taxes
We account for income taxes pursuant to the asset and liability method, which requires the recognition of deferred income tax assets and liabilities related to the expected future tax consequences arising from temporary differences between the carrying amounts and tax bases of assets and liabilities based on enacted statutory tax rates applicable to the periods in which the temporary differences are expected to reverse. Any effects of changes in income tax rates or laws are included in income tax expense in the period of enactment. We reduce the carrying amounts of deferred tax assets by a valuation allowance if, based on the evidence available, both positive and negative, as well as the objectivity and verifiability of that evidence, it is more likely than not that some portion or all of our deferred tax assets will not be realized. The assessment considers, among other matters, the nature, frequency, and severity of current and cumulative losses, forecasts of future profitability, the duration of statutory carry forward periods by jurisdiction, our experience with loss carryforwards not expiring unutilized, and all tax-planning alternatives that may be available.
Tax Receivable Agreement
Our TRA liability is determined and recorded in accordance with ASC 450, Contingencies, which requires the determination of whether the liability is both probable and reasonably estimable. The primary consideration is our usage of deferred tax assets, which currently have a full valuation allowance applied against them. As such, we recognized a TRA liability of $82 million and $14 million as of December 31, 2024 and 2023, respectively, which represents the portion of the liability that is probable and reasonably estimable. For the remaining $2.0 billion TRA liability as of December 31, 2024, we determined that it was more likely than not that our deferred tax assets subject to the TRA would not be realized.
Business Combination Purchase Price Allocation
The purchase price of an acquisition is allocated to the identifiable assets acquired and liabilities assumed based on their fair values at the date of acquisition, with the excess purchase price being recorded as goodwill. The allocation of purchase price to the tangible and identifiable intangible assets acquired is specifically complex because of the significant estimates and assumptions involved in determining their fair values. Due to this higher degree of complexity, we obtained the assistance of outside valuation experts in the allocation of purchase price to the tangible and identifiable intangible assets acquired. While outside valuation experts were used, management has the ultimate responsibility for the valuation methods, models and inputs used and the resulting purchase price allocation. Critical estimates used in valuing tangible assets associated with the ADESA Acquisition include, but are not limited to, the similarity of the acquired real property to market comparable transactions, costs of similar personal property in new condition, and economic obsolescence rates. Critical estimates used in valuing identifiable intangible assets associated with the ADESA Acquisition include, but are not limited to, revenues and attrition rate.
ITEM 7A. QUANTITATIVE AND QUALITATIVE DISCLOSURES ABOUT MARKET RISK.
Market risk represents the risk of loss that may impact our financial position due to adverse changes in financial market prices and rates. Our market risk exposure is primarily a result of exposure due to potential changes in inflation or interest rates. We do not hold financial instruments for trading purposes.
Interest Rate Risk
Our primary market risk exposure related to our debt is changing interest rates. We had total outstanding debt of $67 million under our short-term revolving facilities at December 31, 2024. Amounts outstanding under our short-term revolving facilities are generally due within one year and bear a variable interest rate of a fixed spread to a prime rate or SOFR. Refer to Note 10 — Debt Instruments of our consolidated financial statements included in Part II, Item 8, "Financial Statements and Supplementary Data," of this Annual Report on Form 10-K for more detail on this variable interest rate. Based on the amounts outstanding, a 100-basis point increase or decrease in market interest rates would result in a change to annual interest expense of $1 million at December 31, 2024. Our interest expense increased by $19 million to $651 million during the year ended December 31, 2024 compared to $632 million during the year ended December 31, 2023, primarily as a result of increased interest associated with the Senior Secured Notes, partially offset by decreased interest associated with the Senior Unsecured Notes and short-term revolving facilities.
Our long-term debt, consisting of our Senior Notes (as defined in Note 10 — Debt Instruments of our consolidated financial statements included in Part II, Item 8, "Financial Statements and Supplementary Data," of this Annual Report on Form 10-K) and finance leases have fixed interest rates and terms, and as such, we consider the associated risk to our results of operations from changes in market rates of interest to be minimal.
We are also exposed to interest rate risk arising from market rate adjustments as they pertain to our securitization transactions and variable rate debt borrowings. Future sales of our finance receivables and interest expense may be affected by changes in market rates. We have previously managed these interest rate exposures through the use of derivative instruments such as interest rate swap contracts and cap agreements, and may continue to do so in the future.
Inflation Risk
We are affected by inflationary factors such as decreased vehicle affordability, including as a result of high interest rates, and increases in supply chain and logistics costs, materials costs, and labor costs. We do not believe that inflation has historically had a material effect on our business, financial condition, or results of operations. However, we continue to look for ways to manage any changes in consumer purchasing behavior and increased costs, both of which may adversely affect our business, financial condition, and results of operations.
ITEM 8. FINANCIAL STATEMENTS AND SUPPLEMENTARY DATA.
INDEX TO CONSOLIDATED FINANCIAL STATEMENTS | | | | | |
| Page |
Reports of Independent Registered Public Accounting Firm (PCAOB ID Number 248) | |
Consolidated Balance Sheets as of December 31, 2024 and 2023 | |
Consolidated Statements of Operations for the Years Ended December 31, 2024, 2023, and 2022 | |
Consolidated Statements of Stockholders' Equity (Deficit) for the Years Ended December 31, 2024, 2023, and 2022 | |
Consolidated Statements of Cash Flows for the Years Ended December 31, 2024, 2023, and 2022 | |
| Notes to Consolidated Financial Statements | |
REPORT OF INDEPENDENT REGISTERED PUBLIC ACCOUNTING FIRM
Board of Directors and Stockholders
Carvana Co.
Opinion on the financial statements
We have audited the accompanying consolidated balance sheets of Carvana Co. (a Delaware corporation) and subsidiaries (the “Company”) as of December 31, 2024 and 2023, the related consolidated statements of operations, stockholders’ equity (deficit), and cash flows for each of the three years in the period ended December 31, 2024, and the related notes and financial statement schedule included under Item 15 (collectively referred to as the “consolidated financial statements”). In our opinion, the consolidated financial statements present fairly, in all material respects, the financial position of the Company as of December 31, 2024 and 2023, and the results of its operations and its cash flows for each of the three years in the period ended December 31, 2024, in conformity with accounting principles generally accepted in the United States of America.
We also have audited, in accordance with the standards of the Public Company Accounting Oversight Board (United States) (“PCAOB”), the Company’s internal control over financial reporting as of December 31, 2024, based on criteria established in the 2013 Internal Control—Integrated Framework issued by the Committee of Sponsoring Organizations of the Treadway Commission (“COSO”), and our report dated February 19, 2025 expressed an unqualified opinion.
Basis for opinion
These consolidated financial statements are the responsibility of the Company’s management. Our responsibility is to express an opinion on the Company’s consolidated financial statements based on our audits. We are a public accounting firm registered with the PCAOB and are required to be independent with respect to the Company in accordance with the U.S. federal securities laws and the applicable rules and regulations of the Securities and Exchange Commission and the PCAOB.
We conducted our audits in accordance with the standards of the PCAOB. Those standards require that we plan and perform the audit to obtain reasonable assurance about whether the financial statements are free of material misstatement, whether due to error or fraud. Our audits included performing procedures to assess the risks of material misstatement of the financial statements, whether due to error or fraud, and performing procedures that respond to those risks. Such procedures included examining, on a test basis, evidence regarding the amounts and disclosures in the financial statements. Our audits also included evaluating the accounting principles used and significant estimates made by management, as well as evaluating the overall presentation of the financial statements. We believe that our audits provide a reasonable basis for our opinion.
Critical audit matter
Critical audit matters are matters arising from the current period audit of the financial statements that are communicated or required to be communicated to the audit committee and that: (1) relate to accounts or disclosures that are material to the financial statements and (2) involved our especially challenging, subjective, or complex judgments. We determined that there are no critical audit matters.
/s/ GRANT THORNTON LLP
We have served as the Company’s auditor since 2015.
Southfield, Michigan
February 19, 2025
REPORT OF INDEPENDENT REGISTERED PUBLIC ACCOUNTING FIRM
Board of Directors and Stockholders
Carvana Co.
Opinion on internal control over financial reporting
We have audited the internal control over financial reporting of Carvana Co. (a Delaware corporation) and subsidiaries (the “Company”) as of December 31, 2024, based on criteria established in the 2013 Internal Control—Integrated Framework issued by the Committee of Sponsoring Organizations of the Treadway Commission (“COSO”). In our opinion, the Company maintained, in all material respects, effective internal control over financial reporting as of December 31, 2024, based on criteria established in the 2013 Internal Control—Integrated Framework issued by COSO.
We also have audited, in accordance with the standards of the Public Company Accounting Oversight Board (United States) (“PCAOB”), the consolidated financial statements of the Company as of and for the year ended December 31, 2024, and our report dated February 19, 2025 expressed an unqualified opinion on those financial statements.
Basis for opinion
The Company’s management is responsible for maintaining effective internal control over financial reporting and for its assessment of the effectiveness of internal control over financial reporting, included in the accompanying Management’s Annual Report on Internal Controls over Financial Reporting. Our responsibility is to express an opinion on the Company’s internal control over financial reporting based on our audit. We are a public accounting firm registered with the PCAOB and are required to be independent with respect to the Company in accordance with the U.S. federal securities laws and the applicable rules and regulations of the Securities and Exchange Commission and the PCAOB.
We conducted our audit in accordance with the standards of the PCAOB. Those standards require that we plan and perform the audit to obtain reasonable assurance about whether effective internal control over financial reporting was maintained in all material respects. Our audit included obtaining an understanding of internal control over financial reporting, assessing the risk that a material weakness exists, testing and evaluating the design and operating effectiveness of internal control based on the assessed risk, and performing such other procedures as we considered necessary in the circumstances. We believe that our audit provides a reasonable basis for our opinion.
Definition and limitations of internal control over financial reporting
A company’s internal control over financial reporting is a process designed to provide reasonable assurance regarding the reliability of financial reporting and the preparation of financial statements for external purposes in accordance with generally accepted accounting principles. A company’s internal control over financial reporting includes those policies and procedures that (1) pertain to the maintenance of records that, in reasonable detail, accurately and fairly reflect the transactions and dispositions of the assets of the company; (2) provide reasonable assurance that transactions are recorded as necessary to permit preparation of financial statements in accordance with generally accepted accounting principles, and that receipts and expenditures of the company are being made only in accordance with authorizations of management and directors of the company; and (3) provide reasonable assurance regarding prevention or timely detection of unauthorized acquisition, use, or disposition of the company’s assets that could have a material effect on the financial statements.
Because of its inherent limitations, internal control over financial reporting may not prevent or detect misstatements. Also, projections of any evaluation of effectiveness to future periods are subject to the risk that controls may become inadequate because of changes in conditions, or that the degree of compliance with the policies or procedures may deteriorate.
/s/ GRANT THORNTON LLP
Southfield, Michigan
February 19, 2025
CARVANA CO. AND SUBSIDIARIES
CONSOLIDATED BALANCE SHEETS
(In millions, except number of shares, which are reflected in thousands, and par values)
| | | | | | | | | | | |
| December 31, |
| 2024 | | 2023 |
| ASSETS | | | |
| Current assets: | | | |
| Cash and cash equivalents | $ | 1,716 | | | $ | 530 | |
| Restricted cash | 44 | | | 64 | |
| Accounts receivable, net | 303 | | | 266 | |
| Finance receivables held for sale, net | 612 | | | 807 | |
| Vehicle inventory | 1,608 | | | 1,150 | |
| Beneficial interests in securitizations | 464 | | | 366 | |
Other current assets, including $4 and $3, respectively, due from related parties | 122 | | | 138 | |
| Total current assets | 4,869 | | | 3,321 | |
| Property and equipment, net | 2,773 | | | 2,982 | |
Operating lease right-of-use assets, including $13 and $10, respectively, from leases with related parties | 440 | | | 455 | |
| Intangible assets, net | 34 | | | 52 | |
| | | |
Other assets | 368 | | | 261 | |
| Total assets | $ | 8,484 | | | $ | 7,071 | |
| LIABILITIES & STOCKHOLDERS' EQUITY (DEFICIT) | | | |
| Current liabilities: | | | |
Accounts payable and accrued liabilities, including $17 and $7, respectively, due to related parties | $ | 856 | | | $ | 596 | |
| Short-term revolving facilities | 67 | | | 668 | |
| Current portion of long-term debt | 309 | | | 189 | |
Other current liabilities, including $16 and $3, respectively, due to related parties | 106 | | | 83 | |
| Total current liabilities | 1,338 | | | 1,536 | |
| Long-term debt, excluding current portion | 5,256 | | | 5,416 | |
Operating lease liabilities, excluding current portion, including $10 and $7, respectively, from leases with related parties | 414 | | | 433 | |
Other liabilities, including $48 and $11, respectively, due to related parties | 101 | | | 70 | |
| Total liabilities | 7,109 | | | 7,455 | |
| Commitments and contingencies (Note 17) | | | |
| Stockholders' equity (deficit): | | | |
Preferred stock, $0.01 par value - 50,000 shares authorized; none issued and outstanding as of December 31, 2024 and 2023 | — | | | — | |
Class A common stock, $0.001 par value - 500,000 shares authorized, 133,271 and 114,239 shares issued and outstanding as of December 31, 2024 and 2023, respectively | — | | | — | |
Class B common stock, $0.001 par value - 125,000 shares authorized, 79,119 and 85,619 shares issued and outstanding as of December 31, 2024 and 2023, respectively | — | | | — | |
| Additional paid in capital | 2,676 | | | 1,869 | |
| Accumulated deficit | (1,416) | | | (1,626) | |
| Total stockholders' equity attributable to Carvana Co. | 1,260 | | | 243 | |
| Non-controlling interests | 115 | | | (627) | |
| Total stockholders' equity (deficit) | 1,375 | | | (384) | |
| Total liabilities & stockholders' equity (deficit) | $ | 8,484 | | | $ | 7,071 | |
See accompanying notes to consolidated financial statements.
CARVANA CO. AND SUBSIDIARIES
CONSOLIDATED STATEMENTS OF OPERATIONS
(In millions, except number of shares, which are reflected in thousands, and per share amounts)
| | | | | | | | | | | | | | | | | |
| Years Ended December 31, |
| 2024 | | 2023 | | 2022 |
| Sales and operating revenues: | | | | | |
| Retail vehicle sales, net | $ | 9,681 | | | $ | 7,514 | | | $ | 10,254 | |
Wholesale sales and revenues, including $28, $19, and $32 respectively, from related parties | 2,841 | | | 2,504 | | | 2,609 | |
Other sales and revenues, including $200, $145, and $176, respectively, from related parties | 1,151 | | | 753 | | | 741 | |
| Net sales and operating revenues | 13,673 | | | 10,771 | | | 13,604 | |
Cost of sales, including $6, $4, and $22, respectively, to related parties | 10,797 | | | 9,047 | | | 12,358 | |
| Gross profit | 2,876 | | | 1,724 | | | 1,246 | |
Selling, general and administrative expenses, including $31, $33, and $33, respectively, to related parties | 1,874 | | | 1,796 | | | 2,736 | |
| Goodwill impairment | — | | | — | | | 847 | |
| Other operating expense, net | 12 | | | 8 | | | 14 | |
| Operating income (loss) | 990 | | | (80) | | | (2,351) | |
Interest expense | 651 | | | 632 | | | 486 | |
| Loss (Gain) on debt extinguishment | 12 | | | (878) | | | — | |
| Other (income) expense, net | (73) | | | (9) | | | 56 | |
| Net income (loss) before income taxes | 400 | | | 175 | | | (2,893) | |
| Income tax (benefit) provision | (4) | | | 25 | | | 1 | |
| Net income (loss) | 404 | | | 150 | | | (2,894) | |
| Net income (loss) attributable to non-controlling interests | 194 | | | (300) | | | (1,307) | |
| Net income (loss) attributable to Carvana Co. | 210 | | | 450 | | | (1,587) | |
| Net income (loss) attributable to Class A common stockholders | $ | 210 | | | $ | 450 | | | $ | (1,587) | |
| | | | | |
| Net earnings (loss) per share of Class A common stock - basic | $ | 1.72 | | | $ | 4.12 | | | $ | (15.74) | |
| Net earnings (loss) per share of Class A common stock - diluted | $ | 1.59 | | | $ | 0.75 | | | $ | (15.74) | |
| | | | | |
Weighted-average shares of Class A common stock outstanding - basic | 122,344 | | | 109,323 | | | 100,828 | |
| Weighted-average shares of Class A common stock outstanding - diluted | 132,206 | | | 200,578 | | | 100,828 | |
See accompanying notes to consolidated financial statements.
CARVANA CO. AND SUBSIDIARIES
CONSOLIDATED STATEMENTS OF STOCKHOLDERS' EQUITY (DEFICIT)
(In millions, except number of shares, which are reflected in thousands)
| | | | | | | | | | | | | | | | | | | | | | | | | | | | | | | | | | | | | | | | | | | | | | | | | | | | | | | |
| | | | | Class A Common Stock | | Class B Common Stock | | | | | | | | |
| | | | | | | Shares | | Amount | | Shares | | Amount | | Additional Paid-in Capital | | Accumulated Deficit | | Non-controlling Interests | | Total Stockholders' Equity (Deficit) |
| | | | | | | | | | | | | | | | | | | | | |
| | | | | | | | | | | | | | | | | | | | | |
| | | | | | | | | | | | | | | | | | | | | |
| | | | | | | | | | | | | | | | | | | | | |
| | | | | | | | | | | | | | | | | | | | | |
| | | | | | | | | | | | | | | | | | | | | |
| | | | | | | | | | | | | | | | | | | | | |
| | | | | | | | | | | | | | | | | | | | | |
| | | | | | | | | | | | | | | | | | | | | |
| | | | | | | | | | | | | | | | | | | | | |
| | | | | | | | | | | | | | | | | | | | | |
| | | | | | | | | | | | | | | | | | | | | |
| | | | | | | | | | | | | | | | | | | | | |
| | | | | | | | | | | | | | | | | | | | | |
| | | | | | | | | | | | | | | | | | | | | |
| | | | | | | | | | | | | | | | | | | | | |
| | | | | | | | | | | | | | | | | | | | | |
| | | | | | | | | | | | | | | | | | | | | |
| | | | | | | | | | | | | | | | | | | | | |
| | | | | | | | | | | | | | | | | | | | | |
| | | | | | | | | | | | | | | | | | | | | |
| Balance, December 31, 2021 | | | | | | | 89,930 | | | $ | — | | | 82,900 | | | $ | — | | | $ | 795 | | | $ | (489) | | | $ | 219 | | | $ | 525 | |
| Net loss | | | | | | | — | | | — | | | — | | | — | | | — | | | (1,587) | | | (1,307) | | | (2,894) | |
| Issuance of Class A common stock, net of underwriters' discounts and commissions and offering expenses | | | | | | | 15,625 | | | — | | | — | | | — | | | 1,227 | | | — | | | — | | | 1,227 | |
| Adjustments to the non-controlling interests related to equity offering | | | | | | | — | | | — | | | — | | | — | | | (554) | | | — | | | 554 | | | — | |
| Exchanges of LLC Units and adjustments to non-controlling interests related to RSU vesting and NQSO exercises | | | | | | | 46 | | | — | | | — | | | — | | | 1 | | | — | | | (1) | | | — | |
| Establishment of deferred tax assets related to increases in tax basis in Carvana Group | | | | | | | — | | | — | | | — | | | — | | | 22 | | | — | | | — | | | 22 | |
| Establishment of valuation allowance related to deferred tax assets associated with increases in tax basis in Carvana Group | | | | | | | — | | | — | | | — | | | — | | | (22) | | | — | | | — | | | (22) | |
| Contribution of Class A common stock from related party | | | | | | | (128) | | | — | | | — | | | — | | | — | | | — | | | — | | | — | |
| Issuance of Class A common stock to settle vested restricted stock units | | | | | | | 390 | | | — | | | — | | | — | | | — | | | — | | | — | | | — | |
| Issuance of Class A common stock under ESPP | | | | | | | 86 | | | — | | | — | | | — | | | 1 | | | — | | | — | | | 1 | |
| Forfeitures of restricted stock and restricted stock surrendered in lieu of withholding taxes | | | | | | | — | | | — | | | — | | | — | | | (8) | | | — | | | — | | | (8) | |
| Options exercised | | | | | | | 88 | | | — | | | — | | | — | | | 3 | | | — | | | — | | | 3 | |
| Equity-based compensation | | | | | | | — | | | — | | | — | | | — | | | 93 | | | — | | | — | | | 93 | |
| Balance, December 31, 2022 | | | | | | | 106,037 | | | $ | — | | | 82,900 | | | $ | — | | | $ | 1,558 | | | $ | (2,076) | | | $ | (535) | | | $ | (1,053) | |
Net income (loss) | | | | | | | — | | | — | | | — | | | — | | | — | | | 450 | | | (300) | | | 150 | |
Issuance of Class A common stock, net of underwriters' discounts and commissions and offering expenses | | | | | | | 7,157 | | | — | | | — | | | — | | | 327 | | | — | | | — | | | 327 | |
Issuance of Class B common stock and LLC Units | | | | | | | — | | | — | | | 2,721 | | | — | | | — | | | — | | | 126 | | | 126 | |
| Adjustments to the non-controlling interests related to equity offerings | | | | | | | — | | | — | | | — | | | — | | | (83) | | | — | | | 83 | | | — | |
| Exchanges of LLC Units and adjustments to non-controlling interests related to RSU vesting and NQSO exercises | | | | | | | 31 | | | — | | | (2) | | | — | | | 1 | | | — | | | (1) | | | — | |
| | | | | | | | | | | | | | | | | | | | | |
| | | | | | | | | | | | | | | | | | | | | |
Contribution of Class A common stock from related party | | | | | | | (63) | | | — | | | — | | | — | | | — | | | — | | | — | | | — | |
Issuance of Class A common stock to settle vested restricted stock units | | | | | | | 1,057 | | | — | | | — | | | — | | | — | | | — | | | — | | | — | |
Issuance of Class A common stock under ESPP | | | | | | | 33 | | | — | | | — | | | — | | | — | | | — | | | — | | | — | |
Forfeitures of restricted stock and restricted stock surrendered in lieu of withholding taxes | | | | | | | (30) | | | — | | | — | | | — | | | (15) | | | — | | | — | | | (15) | |
| | | | | | | | | | | | | | | | | | | | | | | | | | | | | | | | | | | | | | | | | | | | | | | | | | | | | | | |
| | | | | Class A Common Stock | | Class B Common Stock | | | | | | | | |
| | | | | | | Shares | | Amount | | Shares | | Amount | | Additional Paid-in Capital | | Accumulated Deficit | | Non-controlling Interests | | Total Stockholders' Equity (Deficit) |
Options exercised | | | | | | | 17 | | | — | | | — | | | — | | | — | | | — | | | — | | | — | |
Equity-based compensation | | | | | | | — | | | — | | | — | | | — | | | 81 | | | — | | | — | | | 81 | |
| Balance, December 31, 2023 | | | | | | | 114,239 | | | $ | — | | | 85,619 | | | $ | — | | | $ | 1,869 | | | $ | (1,626) | | | $ | (627) | | | $ | (384) | |
| Net income | | | | | | | — | | | $ | — | | | — | | | $ | — | | | $ | — | | | $ | 210 | | | $ | 194 | | | $ | 404 | |
| Issuance of Class A common stock, net of underwriters' discounts and commissions and offering expenses | | | | | | | 6,826 | | | $ | — | | | — | | | $ | — | | | $ | 1,264 | | | $ | — | | | $ | — | | | $ | 1,264 | |
| Adjustments to the non-controlling interests related to equity offerings | | | | | | | — | | | $ | — | | | — | | | $ | — | | | $ | (515) | | | $ | — | | | $ | 515 | | | $ | — | |
| Exchanges of LLC Units and adjustments to non-controlling interests related to RSU vesting and NQSO exercises | | | | | | | 6,923 | | | $ | — | | | (6,500) | | | $ | — | | | $ | (33) | | | $ | — | | | $ | 33 | | | $ | — | |
| Establishment of deferred tax assets related to increases in tax basis in Carvana Group | | | | | | | — | | | $ | — | | | — | | | $ | — | | | $ | 289 | | | $ | — | | | $ | — | | | $ | 289 | |
| Establishment of valuation allowance related to deferred tax assets associated with increases in tax basis in Carvana Group | | | | | | | — | | | $ | — | | | — | | | $ | — | | | $ | (289) | | | $ | — | | | $ | — | | | $ | (289) | |
| Contribution of Class A common stock from related party | | | | | | | (1) | | | $ | — | | | — | | | $ | — | | | $ | — | | | $ | — | | | $ | — | | | $ | — | |
| Issuance of Class A common stock to settle vested restricted stock units | | | | | | | 4,834 | | | $ | — | | | — | | | $ | — | | | $ | — | | | $ | — | | | $ | — | | | $ | — | |
| Issuance of Class A common stock under ESPP | | | | | | | 10 | | | $ | — | | | — | | | $ | — | | | $ | 1 | | | $ | — | | | $ | — | | | $ | 1 | |
| Forfeitures of restricted stock and restricted stock surrendered in lieu of withholding taxes | | | | | | | — | | | $ | — | | | — | | | $ | — | | | $ | (19) | | | $ | — | | | $ | — | | | $ | (19) | |
| Options exercised | | | | | | | 440 | | | $ | — | | | — | | | $ | — | | | $ | 7 | | | $ | — | | | $ | — | | | $ | 7 | |
| Equity-based compensation | | | | | | | — | | | $ | — | | | — | | | $ | — | | | $ | 102 | | | $ | — | | | $ | — | | | $ | 102 | |
| Balance, December 31, 2024 | | | | | | | 133,271 | | | $ | — | | | 79,119 | | | $ | — | | | $ | 2,676 | | | $ | (1,416) | | | $ | 115 | | | $ | 1,375 | |
See accompanying notes to consolidated financial statements.
CARVANA CO. AND SUBSIDIARIES
CONSOLIDATED STATEMENTS OF CASH FLOWS
(In millions) | | | | | | | | | | | | | | | | | |
| Years Ended December 31, |
| 2024 | | 2023 | | 2022 |
| Cash Flows from Operating Activities: | | | | | |
| Net income (loss) | $ | 404 | | | $ | 150 | | | $ | (2,894) | |
| Adjustments to reconcile net income (loss) to net cash provided by (used in) operating activities: | | | | | |
| Depreciation and amortization expense | 305 | | | 352 | | | 261 | |
| Goodwill impairment | — | | | — | | | 847 | |
| Equity-based compensation expense | 91 | | | 73 | | | 69 | |
| Loss on disposal of property and equipment | 12 | | | 8 | | | 14 | |
| Loss (Gain) on debt extinguishment | 12 | | | (878) | | | — | |
| Payment-in-kind interest expense | 458 | | | 184 | | | — | |
| Provision for bad debt and valuation allowance | 27 | | | 38 | | | 23 | |
| Amortization of debt issuance costs | 15 | | | 24 | | | 27 | |
| Unrealized (gain) loss on warrants to acquire Root Class A common stock | (115) | | | (3) | | | 80 | |
| Unrealized gain on beneficial interests in securitizations | (23) | | | (14) | | | (6) | |
| Changes in finance receivable related assets: | | | | | |
| Originations of finance receivables | (8,329) | | | (6,041) | | | (7,214) | |
| Proceeds from sale of finance receivables, net | 8,805 | | | 6,594 | | | 6,297 | |
| Gain on loan sales | (755) | | | (434) | | | (411) | |
| Principal payments received on finance receivables held for sale | 188 | | | 186 | | | 190 | |
| | | | | |
| Other changes in assets and liabilities: | | | | | |
| Vehicle inventory | (455) | | | 711 | | | 1,354 | |
| Accounts receivable | (47) | | | (22) | | | 145 | |
| Other assets | 15 | | | 39 | | | (83) | |
| Accounts payable and accrued liabilities | 260 | | | (166) | | | (46) | |
| Operating lease right-of-use assets | 15 | | | 81 | | | 21 | |
| Operating lease liabilities | (10) | | | (71) | | | 15 | |
| Other liabilities | 45 | | | (8) | | | (13) | |
| Net cash provided by (used in) operating activities | 918 | | | 803 | | | (1,324) | |
| Cash Flows from Investing Activities: | | | | | |
Purchases of property and equipment | (91) | | | (87) | | | (512) | |
| Proceeds from disposal of property and equipment | 11 | | | 72 | | | 44 | |
| Payments for acquisitions, net of cash acquired | — | | | (7) | | | (2,196) | |
| | | | | |
| | | | | |
| Principal payments received on and proceeds from sale of beneficial interests | 67 | | | 53 | | | 81 | |
| Net cash (used in) provided by investing activities | (13) | | | 31 | | | (2,583) | |
| Cash Flows from Financing Activities: | | | | | |
| Proceeds from short-term revolving facilities | 3,096 | | | 6,709 | | | 12,982 | |
| Payments on short-term revolving facilities | (3,697) | | | (7,575) | | | (13,501) | |
| Proceeds from issuance of long-term debt | 191 | | | 132 | | | 3,435 | |
| Payments on long-term debt | (577) | | | (503) | | | (165) | |
| | | | | |
| | | | | |
| Payments of debt issuance costs | (4) | | | (69) | | | (75) | |
| Net proceeds from issuance of Class A common stock and LLC Units | 1,264 | | | 453 | | | 1,227 | |
| | | | | |
| Proceeds from equity-based compensation plans | 7 | | | — | | | 4 | |
| | | | | |
| Tax withholdings related to restricted stock units and awards | (19) | | | (15) | | | (8) | |
| | | | | |
| Net cash provided by (used in) financing activities | 261 | | | (868) | | | 3,899 | |
| Net increase (decrease) in cash, cash equivalents and restricted cash | 1,166 | | | (34) | | | (8) | |
| Cash, cash equivalents, and restricted cash at beginning of period | 594 | | | 628 | | | 636 | |
| Cash, cash equivalents, and restricted cash at end of period | $ | 1,760 | | | $ | 594 | | | $ | 628 | |
See accompanying notes to consolidated financial statements.
CARVANA CO. AND SUBSIDIARIES
NOTES TO CONSOLIDATED FINANCIAL STATEMENTS
NOTE 1 — BUSINESS ORGANIZATION
Description of Business
Carvana Co. and its wholly-owned subsidiary Carvana Co. Sub LLC (collectively, "Carvana Co.", and together with its consolidated subsidiaries, the "Company"), is the leading e-commerce platform for buying and selling used cars. The Company is transforming the used car sales experience by giving consumers what they want - a wide selection, great value and quality, transparent pricing, and a simple, no pressure transaction. Using the website or mobile application, customers can complete all phases of a used vehicle transaction, including financing their purchase, trading in their current vehicle, and purchasing complementary products such as vehicle service contracts ("VSC"), GAP waiver coverage, and auto insurance. Each element of the Company's business, from inventory procurement to fulfillment and overall ease of the online transaction, has been built for this singular purpose.
Organization
Carvana Co. is a holding company that was formed as a Delaware corporation on November 29, 2016, for the purpose of completing its initial public offering ("IPO") and related transactions in order to operate the business of Carvana Group, LLC and its subsidiaries (collectively, "Carvana Group"). Substantially all of the Company’s assets and liabilities represent the assets and liabilities of Carvana Group, except the Company's Senior Secured Notes and Senior Unsecured Notes (each as defined in Note 10 — Debt Instruments) which were issued by Carvana Co. and are guaranteed by its and Carvana Group's existing domestic restricted subsidiaries, excluding, in the case of the Senior Unsecured Notes, ADESA US Auction, LLC ("ADESA"), and its subsidiaries.
In accordance with Carvana Group, LLC's amended and restated limited liability company agreement (the "LLC Agreement"), Carvana Co. is the sole manager of Carvana Group and conducts, directs and exercises full control over the activities of Carvana Group. There are two classes of common ownership interests in Carvana Group, Class A common units (the "Class A Units") and Class B common units (the "Class B Units"). As further discussed in Note 11 — Stockholders' Equity (Deficit), the Class A Units and Class B Units (collectively, the "LLC Units") do not hold voting rights, which results in Carvana Group being considered a variable interest entity ("VIE"). Due to Carvana Co.'s power to control and its significant economic interest in Carvana Group, it is considered the primary beneficiary of the VIE and the Company consolidates the financial results of Carvana Group. As of December 31, 2024, Carvana Co. owned approximately 62.3% of Carvana Group and the LLC Unitholders (as defined in Note 11 — Stockholders' Equity (Deficit)) owned the remaining 37.7%.
NOTE 2 — SUMMARY OF SIGNIFICANT ACCOUNTING POLICIES
Basis of Presentation
The accompanying consolidated financial statements of the Company have been prepared in accordance with accounting principles generally accepted in the United States of America ("GAAP"). As discussed in Note 1 — Business Organization, Carvana Group is considered a VIE and Carvana Co. consolidates its financial results due to the determination that it is the primary beneficiary. All intercompany balances and transactions have been eliminated.
Certain prior period amounts have been reclassified to conform to current period presentation to account for the additions of other operating expense, net and operating income (loss) in our accompanying consolidated statements of operations.
Liquidity
The Company has incurred losses in prior periods and may incur additional losses in the future as it continues to focus on driving profitable growth through operating efficiency. Historically, the Company's capital and liquidity needs were primarily satisfied through its debt and equity financings, operating cash flows, and short-term revolving facilities. During the year ended December 31, 2024, the Company (i) repurchased and cancelled $370 million of principal amount of 2028 Senior Secured Notes (as defined below); (ii) redeemed $100 million of principal amount of 2028 Senior Secured Notes; (iii) received net cash
CARVANA CO. AND SUBSIDIARIES
NOTES TO CONSOLIDATED FINANCIAL STATEMENTS
(Continued)
proceeds of $1.3 billion from its "at-the-market offering" program (the "ATM Program"); and (iv) amended certain revolving credit facilities primarily to extend maturities. In January 2025, the Company (i) amended its Master Purchase and Sale Agreement (as defined below) for the purchaser to purchase up to a maximum of $4.0 billion of principal balances of finance receivables from the amendment date through January 2026; and (ii) extended another of its short-term revolving credit facilities through April 2026. Management believes that current working capital, cash flows from operations, and expected continued or new financing arrangements will be sufficient to fund operations for at least one year from the financial statement issuance date.
Use of Estimates
The preparation of these consolidated financial statements in conformity with GAAP requires management to make estimates and assumptions. Certain accounting estimates involve significant judgments, assumptions and estimates by management that have a material impact on the carrying value of certain assets and liabilities, disclosures of contingent assets and liabilities and the reported amounts of revenues and expenses during the reporting period, which management considers to be critical accounting estimates. The judgments, assumptions and estimates used by management are based on historical experience, management’s experience, and other factors, which are believed to be reasonable under the circumstances. Because of the nature of the judgments and assumptions made by management, actual results could differ materially from these judgments and estimates, which could have a material impact on the carrying values of the Company’s assets and liabilities and the results of operations.
Comprehensive Income (Loss)
During the years ended December 31, 2024, 2023, and 2022, the Company did not have any other comprehensive income (loss) and, therefore, the net income (loss) and comprehensive income (loss) were the same for all periods presented.
Cash and Cash Equivalents
The Company has cash deposits and cash equivalents deposited in or managed by major financial institutions. Cash equivalents include highly liquid investment instruments with original maturities of three months or less, and consist primarily of money market funds. At times the related amounts are in excess of the amounts insured by the Federal Deposit Insurance Corporation. The Company has not experienced any losses with these financial institutions and does not believe it represents significant credit risk.
Restricted Cash
Amounts included in restricted cash primarily represent the deposits required under the Company's short-term revolving facilities and any undistributed amounts collected on the finance receivables pledged under the Company's finance receivable facilities as explained in Note 10 — Debt Instruments, as well as certain cash held for corporate insurance purposes.
Accounts Receivable, Net
Accounts receivable, net of an allowance for doubtful accounts, includes certain amounts due from customers and their finance providers. The allowance for doubtful accounts is estimated based upon historical experience, current economic conditions, and other factors and is evaluated periodically. The allowance for doubtful accounts was $9 million as of both December 31, 2024 and 2023.
Finance Receivables Held for Sale, Net
Finance receivables include installment contracts the Company originates to its customers to facilitate vehicle sales. The Company classifies these receivables as held for sale, as it does not intend to hold the finance receivables it originates to maturity. The Company typically sells the finance receivables it originates, as explained in Note 8 — Finance Receivable Sale Agreements and Note 9 — Securitizations and Variable Interest Entities. The Company records a valuation allowance to report finance receivables at the lower of unpaid principal balance or fair value. To determine the fair value of finance receivables the Company utilizes industry-standard modeling, such as discounted cash flow analysis, factoring in the Company’s historical experience, the credit quality of the underlying receivables, loss trends and recovery rates, as well as the overall economic environment. For purposes of determining the valuation allowance, finance receivables are evaluated collectively to determine the allowance as they represent a large group of smaller-balance homogeneous loans. The allowance was $38 million and $59
CARVANA CO. AND SUBSIDIARIES
NOTES TO CONSOLIDATED FINANCIAL STATEMENTS
(Continued)
million as of December 31, 2024 and 2023, respectively. Principal balances of finance receivables are charged-off when the Company is unable to sell the finance receivable and the related vehicle has been repossessed and liquidated or the receivable has otherwise been deemed uncollectible. Interest income on finance receivables held for sale is recognized when earned based on contractual loan terms and is included in other sales and revenues. Loan origination costs are capitalized and recognized as a reduction to the gain on loan sale when the loans are sold.
Vehicle Inventory
Vehicle inventory consists of used vehicles, primarily acquired directly from customers and at auction. Direct and indirect vehicle reconditioning costs including parts and labor, inbound transportation costs and other incremental overhead costs are capitalized as a component of inventory. Inventory is stated at the lower of cost or net realizable value. Vehicle inventory cost is determined by specific identification. Net realizable value is the estimated selling price less costs to complete, dispose and transport the vehicles. Selling prices are derived from historical data and trends, such as sales price and inventory turn times of similar vehicles, as well as independent market resources. Each reporting period the Company recognizes any necessary adjustments to reflect vehicle inventory at the lower of cost or net realizable value through cost of sales in the accompanying consolidated statements of operations.
Property and Equipment
Property and equipment consists of land, buildings and improvements, transportation fleet equipment, software, and furniture, fixtures and equipment and is stated at cost less accumulated depreciation and amortization. Repairs and maintenance costs that extend the life or utility of an asset are also capitalized. Ordinary repairs and maintenance are charged to expense as incurred. Costs incurred during construction are capitalized as construction in progress and reclassified to the appropriate fixed asset categories when the project is completed. In addition, interest on borrowings during the active construction period of construction projects is capitalized and depreciated over the estimated useful lives of the related assets. Costs incurred during the preliminary project planning phase are charged to expense as incurred.
The Company capitalizes direct costs of materials and services consumed in developing or obtaining internal-use software. The Company also capitalizes payroll and payroll-related costs for employees who are directly associated with and who devote time to the development of software products for internal use, to the extent of the time spent directly on the project. Capitalization of costs begins during the application development stage and ends when the software is available for general use. Costs incurred during the preliminary project and post-implementation stages are charged to expense as incurred.
Depreciation and amortization are computed using the straight-line method over the lesser of the remaining lease term or the following estimated useful lives:
| | | | | |
| Buildings and improvements | 15-30 years |
| Transportation fleet equipment | 5 years |
| Software | 3 years |
| Furniture, fixtures and equipment | 3-5 years |
Management reviews long-lived assets for impairment when events or changes in circumstances indicate the carrying amount of an asset may not be recoverable. The Company compares the sum of estimated undiscounted future cash flows expected to result from the use of the asset to the carrying value of the asset. When the carrying value of the asset exceeds its estimated undiscounted future cash flows, the Company recognizes an impairment charge for the amount by the which the carrying value of the asset exceeds the fair value of the asset. The Company periodically reassesses the useful lives of its long-lived assets when events or circumstances indicate that useful lives have significantly changed from the previous estimate. The Company recorded no impairment charges during the years ended December 31, 2024, 2023, and 2022. See Note 4 — Property and Equipment, Net for additional information on property and equipment.
Goodwill and Intangible Assets
Intangible assets are recognized and recorded at their acquisition date fair values. Definite-lived intangible assets consist of developed technology, customer relationships, and non-compete agreements and are generally amortized on a straight-line basis over their estimated useful lives. The Company determined the useful lives of its definite-lived intangible assets based on multiple factors including technological obsolescence, the make-up of the acquired customer base and expected attrition, and
CARVANA CO. AND SUBSIDIARIES
NOTES TO CONSOLIDATED FINANCIAL STATEMENTS
(Continued)
the period over which expected cash flows are used to measure the fair value of the intangible asset at acquisition. The Company periodically reassesses the useful lives of its definite-lived intangible assets when events or circumstances indicate that useful lives have significantly changed from the previous estimate. No impairment charges related to intangible assets were recognized during the years ended December 31, 2024, 2023, or 2022.
Goodwill represents the excess purchase price over the fair value of the net assets acquired. Goodwill is not amortized but is tested annually or more frequently when events or circumstances change that would more likely than not reduce the fair value of a reporting unit below its carrying amount. The Company has one operating segment, which is its reporting unit; therefore, management analyzes goodwill associated with all of its operations when analyzing for potential impairment. When conducting annual or interim impairment assessments, if applicable, a two-step process is used. First, an optional qualitative evaluation is performed as to whether it is more likely than not that the fair value of the Company's sole reporting unit is less than its carrying value, using an assessment of relevant events and circumstances. In performing this assessment, the Company is required to make assumptions and judgments including, but not limited to, an evaluation of macroeconomic conditions as they relate to the business, industry and market trends, as well as the overall future financial performance of the reporting unit. If it is determined that it is not more likely than not that the fair value of the reporting unit is less than its carrying value, no additional tests are performed. However, if the Company concludes otherwise or elects not to perform the qualitative assessment, the Company performs a second step consisting of a quantitative assessment of goodwill impairment. This assessment requires the Company to compare the fair value of its reporting unit with its carrying value. If the carrying amount exceeds the fair value, an impairment charge will be recognized. In performing this assessment, the Company is required to make assumptions and judgments including, but not limited to, financial projections, discount rate, and future market conditions. During the year ended December 31, 2022, the Company performed a quantitative goodwill impairment test for the Company's reporting unit and as a result recorded a non-cash goodwill impairment charge of $847 million, which is reflected as Goodwill impairment in the accompanying consolidated statements of operations.
Leases
The Company determines if an arrangement is a lease at inception by evaluating if the asset is explicitly or implicitly identified or distinct, if the Company will receive substantially all of the economic benefit or if the lessor has an economic benefit and the ability to substitute the asset. Right-of-use ("ROU") assets represent the Company's right to use an underlying asset for the lease term and lease liabilities represent the Company's obligation to make lease payments arising from the lease. The Company assesses whether the lease is an operating or finance lease at its inception. Operating lease liabilities are recognized at commencement date based on the present value of the lease payments over the lease term. To calculate the present value, the Company uses the implicit rate in the lease when readily determinable. However, the Company's leases generally do not provide an implicit rate and it uses its incremental borrowing rate. The incremental borrowing rate is based on collateralized borrowings of similar assets with terms that approximate the lease term when available and when collateralized rates are not available, it uses uncollateralized rates with similar terms adjusted for the fact that it is an unsecured rate. The operating lease ROU asset is the initial lease liability adjusted for any prepayments, initial indirect costs incurred by the Company, and lease incentives. The Company's operating leases are included in operating lease right-of-use assets, other current liabilities, and operating lease liabilities on the accompanying consolidated balance sheets. The Company's finance leases are included in property and equipment and long-term debt on the accompanying consolidated balance sheets.
Securitizations and Variable Interest Entities
The Company reviews subsidiaries and affiliates, as well as other entities, to determine if they should be considered VIEs, and whether it should change the consolidation determinations based on changes in their characteristics. The Company considers an entity a VIE if its equity investors own an interest therein that lacks the characteristics of a controlling financial interest or if such investors do not have sufficient equity at risk for the entity to finance its activities without additional subordinated financial support or if the entity is structured with non-substantive voting interests. A VIE is consolidated by its primary beneficiary, the party that has both the power to direct the activities that most significantly impact the VIE’s economic performance and the obligation to absorb losses or the right to receive benefits of the VIE that could potentially be significant to the VIE. The Company evaluates whether it has variable interests in the VIE and if so, if it is the primary beneficiary of the VIE on an ongoing basis. The Company consolidates VIEs when it is deemed to be the primary beneficiary.
The Company sponsors asset-backed securitization transactions. These transactions often result in the creation of securitization trusts, which are VIEs. To comply with Regulation RR of the Dodd-Frank Wall Street Reform and Consumer Protection Act of 2010 (the "Risk Retention Rules") the Company retains at least a 5% interest in the credit risk of the underlying finance receivables, which it accomplishes by retaining at least a 5% interest in each security issued by the
CARVANA CO. AND SUBSIDIARIES
NOTES TO CONSOLIDATED FINANCIAL STATEMENTS
(Continued)
securitization trusts. Typically, this includes notes and certificates, which are presented as beneficial interests in securitizations on the accompanying consolidated balance sheets.
Other Assets
Other current assets consist of various items, including, among other items, software licenses and subscriptions, prepaid expenses, the estimated reserve for vehicle inventory returns, sales tax receivables, the current portion of the purchase price adjustment receivables based on the performance of the Company's finance receivables, and deposits.
Other assets consist of various items, including, among other items, investment in equity instruments and derivative assets related to Root Warrants (each as further discussed in Note 18 — Fair Value of Financial Instruments), the purchase price adjustment receivables based on the performance of the Company's finance receivables, collateral for insurance, deferred tax assets, and debt issuance costs on revolving debt instruments.
Accrued Liabilities
Accrued liabilities consist of various items payable within one year, including, among other items, accruals for sales tax, compensation and benefits, vehicle licenses and fees, interest expense on the Senior Notes, reserves for returns and cancellations, and advertising expenses.
Other Liabilities
As of December 31, 2024 and 2023, other current liabilities primarily consist of the current portion of operating lease liabilities, deferred revenue associated with Root Warrants (as further discussed in Note 18 — Fair Value of Financial Instruments), and tax receivable agreement ("TRA") liability (as further discussed in Note 15 — Income Taxes). Other liabilities consist of various items to be recognized beyond one year, including the deferred revenue associated with Root Warrants, and tax receivable agreement ("TRA") liability.
Revenue Recognition
The Company recognizes revenue in accordance with the five-step model prescribed by ASC 606 that includes: (1) identify the contract; (2) identify the performance obligations; (3) determine the transaction price; (4) allocate the transaction price to the performance obligations; and (5) recognize revenue when (or as) performance obligations are satisfied.
Retail Vehicle Sales
The Company sells retail vehicles directly to its customers through its website. The prices of retail vehicles are set forth in the customer contracts at stand-alone selling prices which are agreed upon prior to delivery. The Company satisfies its performance obligation for retail vehicle sales upon delivery when the risks and rewards of ownership and control pass to the customer. The Company recognizes revenue at the agreed upon purchase price stated in the contract, including any delivery charges, less an estimate for returns. Estimates for returns are based on an analysis of historical experience, trends and sales data. Changes in these estimates are reflected as an adjustment to revenue in the period identified. Retail vehicle sales also include service revenue from retail marketplace transactions, which are retail marketplace partner vehicles sold to customers through Carvana, where the Company recognizes revenue on the sale of the vehicle on a net basis. The amount of consideration received for retail vehicle sales includes noncash consideration representing the value of trade-in vehicles, if applicable, as stated in the contract. Prior to the delivery of the vehicle, the payment is received or financing has been arranged. Payments from customers that finance their purchases with third parties are typically due and collected within 30 days of delivery of the retail vehicle. Revenue excludes any sales taxes, title and registration fees, and other government fees that are collected from customers.
Wholesale Sales and Revenues
The Company sells vehicles to wholesalers. These vehicles sold to wholesalers are primarily acquired from customers and do not meet the Company’s quality standards to list and sell through its website. The Company satisfies its performance obligation for wholesale sales and revenues when the wholesale purchaser obtains control of the underlying vehicle, which is upon delivery or pick up at an auction when the transfer of title, risks and rewards of ownership, and control pass to the wholesale purchaser. The Company recognizes revenue at the amount it expects to receive for the used wholesale vehicle,
CARVANA CO. AND SUBSIDIARIES
NOTES TO CONSOLIDATED FINANCIAL STATEMENTS
(Continued)
which is the fixed price determined at the auction, or for wholesale marketplace transactions, at the amount it expects to receive for auction and service fees charged in facilitating the transaction. The purchase price of the wholesale vehicle is typically due and collected within 30 days of delivery of the wholesale vehicle and auction fees are typically due within two days of a completed sale.
Other Sales and Revenues
Other sales and revenues include gains on the sales of finance receivables, commissions on VSCs, GAP waiver coverage, and other complementary products and interest income received on finance receivables prior to selling them to investors.
Customers purchasing retail vehicles from the Company may enter into contracts for VSCs and, if they finance with the Company, GAP waiver coverage. The prices of VSCs and GAP waiver coverage are set forth in each contract. The Company sells and receives a commission on VSCs under a master dealer agreement with DriveTime, pursuant to which the Company sells VSCs that DriveTime administers and is the obligor. The Company receives a commission on GAP waiver coverage contracts where the administrator of the contract is obligated to reimburse the holder of the underlying finance receivable for a balance that is in excess of the value of the financed vehicle in the event of a total loss. The Company recognizes commission revenue at the time of sale, net of a reserve for estimated contract cancellations. GAP waiver coverage contracts obligate whoever holds the underlying finance receivable to not attempt collection of a balance that is in excess of the value of the financed vehicle in the event of a total loss. GAP waiver coverage is recognized as the performance obligation is satisfied over the period of coverage, generally on a straight-line basis over the expected period the outstanding balance of the related finance receivable will exceed the value of the financed vehicle, less a reserve for cancellations. Upon selling the corresponding finance receivable, the Company recognizes any remaining deferred revenue. The reserve for cancellations of VSCs and GAP waiver coverage contracts is estimated based upon historical experience and recent trends and is reflected as a reduction of other sales and revenues. Changes in these estimates are reflected as an adjustment to other sales and revenues in the period identified.
Under the master dealer agreement with DriveTime, the Company is also contractually entitled to receive profit-sharing revenues based on the performance of the VSCs once a required claims period has passed. This is a form of variable consideration the Company recognizes as revenue to the extent that it is probable that it will not result in a significant revenue reversal. The Company applies the expected value method, utilizing expected VSC performance based on historical claims and cancellation data from its customers, as well as other qualitative assumptions to estimate the amount it expects to receive. The Company reassesses the estimate each reporting period with any changes reflected as an adjustment to other sales and revenues in the period identified. Profit-sharing payments will begin when the underlying VSCs reach a specified level of claims history. As of both December 31, 2024 and 2023, the Company had ending receivables of less than $1 million related to cumulative profit-sharing payments recognized as revenue to which it expects to be entitled. The receivables are included in other current assets and other assets on the accompanying consolidated balance sheets.
The Company accounts for sales of finance receivables in accordance with ASC Topic 860, Transfers and Servicing ("ASC 860"). ASC 860 states that a transfer of an entire financial asset, a group of entire financial assets, or a participating interest in an entire financial asset in which the transferor surrenders control over those financial assets is accounted for as a sale only if all of the following conditions are met:
•The transferred financial assets have been isolated from the transferor - put presumptively beyond the reach of the transferor and its creditors, even in bankruptcy or other receivership.
•Each transferee has the right to pledge or exchange the assets (or beneficial interests) it received, and no condition both constrains the transferee (or third-party holder of its beneficial interests) from taking advantage of its right to pledge or exchange the asset and provides more than a trivial benefit to the transferor.
•The transferor, its consolidated affiliates included in the financial statements being presented or its agents do not maintain effective control over the transferred financial assets or third-party beneficial interests related to those transferred assets.
For the years ended December 31, 2024, 2023, and 2022, all transfers of finance receivables met the requirements for sale treatment. The Company records the gain on the sale of a finance receivable upon receipt of proceeds, in an amount equal to the fair value of the net proceeds received less the carrying amount of the finance receivable. The Company has made customary representations related to the sales of finance receivables. Any significant estimated post-sale obligations or contingent obligations to the purchaser of the receivables would be accrued if probable and estimable in accordance with ASC 450, Contingencies. Any such obligations are considered in the Company's determination of the accounting for the transfers of the finance receivables under ASC 860.
CARVANA CO. AND SUBSIDIARIES
NOTES TO CONSOLIDATED FINANCIAL STATEMENTS
(Continued)
Cost of Sales
Cost of sales includes the cost to acquire used vehicles and direct and indirect vehicle reconditioning costs associated with preparing the vehicles for resale. Vehicle reconditioning costs include parts, labor, inbound transportation costs, and other incremental overhead costs, which are allocated to inventory via specific identification and standard costing. Occupancy and labor costs not related to vehicle acquisition or reconditioning are expensed as incurred as a component of selling, general and administrative expense. Cost of sales also includes any necessary adjustments to reflect vehicle inventory at the lower of cost or net realizable value.
Selling, General, and Administrative Expenses
Selling, general, and administrative ("SG&A") expenses primarily include compensation and benefits, advertising, depreciation expense, facilities costs, technology expenses, logistics and fulfillment expenses, and other administrative expenses. SG&A expenses exclude the costs related to reconditioning vehicles and inbound transportation, which are included in cost of sales, and payroll costs of employees related to the development of software products for internal use, which are capitalized to software and depreciated over the estimated useful lives of the related assets.
Advertising Costs
Advertising production costs are expensed the first time the advertising takes place. All other advertising costs are expensed as incurred. Advertising expenses are included in SG&A expenses on the accompanying consolidated statements of operations. Advertising expenses were $229 million, $228 million, and $490 million during the years ended December 31, 2024, 2023, and 2022, respectively.
Equity-Based Compensation
The Company classifies equity-based awards granted in exchange for services as either equity awards or liability awards. The classification of an award as either an equity award or a liability award is generally based upon cash settlement options. Equity awards are measured based on the fair value of the award at the grant date. Liability awards are re-measured to fair value each reporting period. The Company recognizes equity-based compensation on a straight-line basis over the award’s requisite service period, which is generally the vesting period of the award, less actual forfeitures. No compensation expense is recognized for awards for which participants do not render the requisite services. For equity and liability awards earned based on performance or upon occurrence of a contingent event, when and if the awards will be earned is estimated. If an award is not considered probable of being earned, no amount of equity-based compensation is recognized. If the award is deemed probable of being earned, related compensation expense is recorded over the estimated service period. To the extent the estimate of awards considered probable of being earned changes, the amount of equity-based compensation recognized will also change. See Note 13 — Equity-Based Compensation for additional information on equity-based compensation.
Shipping and Handling
The Company's logistics costs related to transporting its used vehicle inventory include fuel, maintenance, and depreciation related to operating its own transportation fleet, and third-party transportation fees. The portion of these costs related to inbound transportation from the point of acquisition to the inspection and reconditioning center are capitalized to inventory and then included in cost of sales when the related used vehicle is sold. Logistics costs not included in cost of sales are included in selling, general and administrative expenses in the accompanying consolidated statements of operations and were $118 million, $119 million, and $235 million during the years ended December 31, 2024, 2023, and 2022, respectively, excluding compensation and benefits.
Defined Contribution Plan
The Company sponsors a qualified 401(k) retirement plan (defined contribution plan) for its employees. The plan covers substantially all employees who have attained the age of 18. Participants may voluntarily contribute to the plan up to the maximum limits established by Internal Revenue Service regulations. The Company provides matching contributions of 40% up to the first 6% of an employee’s compensation, which vests evenly over the employee’s initial five-year service period. On January 1, 2022, the plan was amended whereby prospective participants' employer matching contributions vest evenly over the employee's initial four-year service period. Employer contributions to the plan, net of forfeitures, were $8 million for each the
CARVANA CO. AND SUBSIDIARIES
NOTES TO CONSOLIDATED FINANCIAL STATEMENTS
(Continued)
years ended December 31, 2024, 2023, and 2022. Employer contributions are included in selling, general, and administrative expenses in the accompanying consolidated statements of operations.
Derivative Instruments and Hedging Activities
The Company from time to time enters into primarily short-term derivative instruments to manage risks arising from its business operations and economic conditions, primarily cash flow variability that may arise from interest rate changes between the time the Company originates finance receivables and the time it sells them through securitizations. The Company does not designate these derivative instruments as hedges under ASC 815, Derivatives and Hedging for hedge accounting treatment and as a result they are accounted for as economic hedges. Gains and losses related to the derivative instruments are included within other sales and revenues to follow the presentation of the hedged item within the accompanying consolidated statements of operations and any derivative instruments outstanding as of the end of the period are reported at fair value on the accompanying consolidated balance sheets.
Fair Value Measurements
The fair value of financial instruments is based on estimates using quoted market prices, discounted cash flows, or other valuation techniques. Those techniques are significantly affected by the assumptions used, including the discount rate and the estimated timing and amount of future cash flows. Therefore, the estimates of fair value may differ substantially from amounts that ultimately may be realized or paid at settlement or maturity of the financial instruments, and those differences may be material. Accordingly, the aggregate fair value amounts presented may not represent the Company’s underlying institutional value.
The Company uses the three-tier hierarchy established by GAAP, which requires an entity to maximize the use of observable inputs and minimize the use of unobservable inputs when measuring fair value to determine the fair value of its financial instruments. This hierarchy indicates to what extent the inputs used in the Company’s calculations are observable in the market. The different levels of the hierarchy are defined as follows:
| | | | | |
| Level 1: | Unadjusted quoted prices in active markets for identical assets or liabilities. |
| |
| Level 2: | Other than quoted prices that are observable in the market for the asset or liability, either directly or indirectly, such as quoted prices for similar assets or liabilities; quoted prices in markets that are not active; or model-derived valuations or other inputs that are observable or can be corroborated by observable market data for substantially the full term of the assets or liabilities. |
| |
| Level 3: | Inputs are unobservable and reflect management’s estimates of assumptions that market participants would use in pricing the asset or liability. |
The Company has elected the fair value option for its beneficial interests in securitizations, which primarily include notes and certificates of the securitization trusts. Electing the fair value option allows the Company to recognize changes in the fair value of these assets in the period the fair value changes. The changes in fair value are recorded within other (income) expense, net and amounts attributable to interest income are reported in interest expense, net as earned on the accompanying consolidated statements of operations. See Note 18 — Fair Value of Financial Instruments for additional information.
Segments
Business segments are defined as components of an enterprise about which discrete financial information is available that is evaluated regularly by the chief operating decision maker ("CODM") in deciding how to allocate resources and in assessing operating performance. The Company operates and manages an integrated business with the overall objective of increasing the number of retail units sold and total gross profit per retail unit. Because of this, the Company has determined that it currently operates with one operating segment and therefore one reportable segment. The CODM is the chief executive officer and focuses on consolidated results, specifically consolidated net income (loss), in assessing operating performance and allocating resources. Furthermore, the Company offers similar products and services and uses similar processes to sell those products and services to similar classes of customers throughout the United States ("U.S."). The amounts presented in each revenue line item in the accompanying consolidated statements of operations represent categories of revenue disaggregated by product and customer type. The measure of segment assets is reported on the accompanying consolidated balance sheets as total assets. Substantially all revenue is generated and all assets are held in the U.S. for all periods presented.
CARVANA CO. AND SUBSIDIARIES
NOTES TO CONSOLIDATED FINANCIAL STATEMENTS
(Continued)
Segment information for the years ended December 31, 2024 and 2023 are as follows:
| | | | | | | | | | | | | | | | | |
| Years ended December 31, |
| 2024 | | 2023 | | 2022 |
| | | | | |
| (in millions) |
| Net sales and operating revenues | $ | 13,673 | | | $ | 10,771 | | | $ | 13,604 | |
Cost of sales | 10,797 | | | 9,047 | | | 12,358 | |
| Gross profit | 2,876 | | | 1,724 | | | 1,246 | |
Compensation and benefits | 700 | | | 661 | | | 943 | |
Advertising | 229 | | | 228 | | | 490 | |
Market occupancy | 68 | | | 71 | | | 93 | |
Logistics | 118 | | | 119 | | | 235 | |
Other (1) | 759 | | | 717 | | | 975 | |
Goodwill impairment | — | | | — | | | 847 | |
Other operating expense, net | 12 | | | 8 | | | 14 | |
| Operating income (loss) | 990 | | | (80) | | | (2,351) | |
Interest expense | 651 | | | 632 | | | 486 | |
Loss (Gain) on debt extinguishment | 12 | | | (878) | | | — | |
Other (income) expense, net | (73) | | | (9) | | | 56 | |
Net income (loss) before income taxes | 400 | | | 175 | | | (2,893) | |
Income tax (benefit) provision | (4) | | | 25 | | | 1 | |
Net income (loss) | $ | 404 | | | $ | 150 | | | $ | (2,894) | |
(1) Other costs include all other selling, general and administrative expenses such as IT expenses, corporate occupancy, professional services and insurance, limited warranty, and title and registration.
Income Taxes
The Company accounts for income taxes pursuant to the asset and liability method, which requires the recognition of deferred income tax assets and liabilities related to the expected future tax consequences arising from temporary differences between the carrying amounts and tax bases of assets and liabilities based on enacted statutory tax rates applicable to the periods in which the temporary differences are expected to reverse. Any effects of changes in income tax rates or laws are included in income tax expense in the period of enactment. The Company reduces the carrying amounts of deferred tax assets by a valuation allowance if, based on the evidence available, both positive and negative, as well as the objectivity and verifiability of that evidence, it is more likely than not that some portion or all of the Company's deferred tax assets will not be realized. The assessment considers, among other matters, the nature, frequency and severity of current and cumulative losses, forecasts of future profitability, the duration of statutory carry forward periods by jurisdiction, the Company's experience with loss carryforwards not expiring unutilized, and all tax planning alternatives that may be available. See Note 15 — Income Taxes for additional information.
Tax Receivable Agreement
The Company's TRA liability is determined and recorded in accordance with ASC 450, Contingencies, which requires the determination of whether the liability is both probable and reasonably estimable. The primary consideration is the Company's usage of deferred tax assets, which currently have a full valuation allowance applied against them. As such, the Company recorded a TRA liability of $82 million and $14 million as of December 31, 2024 and 2023, respectively, which represents the portion of the liability that is probable and reasonably estimable. For the remaining $2.0 billion TRA liability as of December 31, 2024, the Company determined that it was more likely than not that its deferred tax assets subject to the TRA would not be realized.
CARVANA CO. AND SUBSIDIARIES
NOTES TO CONSOLIDATED FINANCIAL STATEMENTS
(Continued)
Adoption of New Accounting Standards
In November 2023, the Financial Accounting Standard Board (“FASB”) issued Accounting Standards Update “ASU” 2023-07, Segment Reporting (Topic 280): Improvements to Reportable Segment Disclosures (“ASU 2023-07”), which requires the disclosure of significant segment expenses that are regularly provided to the CODM. The amendments also require disclosure of the title and position of the CODM and an explanation of how the CODM uses the reported measure(s) of segment profit or loss in assessing segment performance and deciding how to allocate resources. These amendments apply regardless of the Company having one operating segment. The Company adopted ASU 2023-07 in its fourth quarter of 2024 using a retrospective transition method.
Accounting Standards Issued But Not Yet Adopted
In December 2023, the FASB issued ASU 2023-09, Income Taxes (Topic 740): Improvements to Income Tax Disclosures, which expands disclosures in an entity’s income tax rate reconciliation table and disclosures regarding cash taxes paid both in the U.S. and foreign jurisdictions. The update will be effective for annual periods beginning after December 15, 2025. The Company is currently evaluating the impact that this guidance will have on the presentation of its consolidated financial statements and accompanying notes.
In November 2024, the FASB issued ASU 2024-03, Income Statement - Reporting Comprehensive Income - Expense Disaggregation disclosures (Subtopic 220-40): Disaggregation of Income Statement Expenses, which requires entities to disclose certain additional information including, among other items, purchases of inventory, employee compensation, depreciation, and intangible asset amortization included within each consolidated statements of operations expense caption. The update will be effective for annual reporting periods beginning after December 15, 2026. The Company is currently evaluating the impact that this guidance will have on the presentation of its consolidated financial statements and accompanying notes.
The Company assessed all other Accounting Standards Updates issued but not yet adopted and determined they are not relevant to the Company or are not expected to have a material impact upon adoption.
NOTE 3 — BUSINESS COMBINATIONS
Acquisition of ADESA U.S. Physical Auction Business
On May 9, 2022, the Company completed its acquisition of 100% of the equity interests in the U.S. physical auction business of ADESA from Openlane, Inc., fka KAR Auction Services, Inc. for approximately $2.2 billion in cash (the "ADESA Acquisition"). Proceeds from the issuance and sale of the 2030 Senior Unsecured Notes (as defined below) were used to fund the acquisition. The acquisition included 56 auction sites throughout the U.S. with 6.5 million square feet of buildings on more than 4,000 acres of land, significantly expanding the Company's infrastructure and enhancing its customer offering by facilitating a broader selection of vehicles and faster delivery times.
Identifiable intangible assets acquired consist of the following (in millions):
| | | | | | | | | | | |
| Fair Value | | Useful Life |
| Customer relationships | $ | 50 | | | 10 years |
| Developed technology | $ | 29 | | | 3 years |
Customer relationships were valued using the multi-period excess earnings method of the income approach. Developed technology was valued using the replacement cost method of the cost approach. Significant assumptions used in the valuations were forecasted revenues and attrition rate and are classified as Level 3 due to the lack of observable market data. No residual values were assigned to the customer relationships and developed technology intangible assets and they are amortized on an economic useful life basis commensurate with future anticipated cash flows and straight line, respectively. As of December 31, 2024, the remaining weighted-average amortization period for the intangible assets acquired was 4.6 years.
Real property was valued using market comparable transactions of the market approach, for which the key assumption is the similarity of the acquired property to market comparable transactions. Personal property was valued using the replacement cost method of the cost approach, for which the key assumptions are the costs of similar personal property in new condition and economic obsolescence rates.
CARVANA CO. AND SUBSIDIARIES
NOTES TO CONSOLIDATED FINANCIAL STATEMENTS
(Continued)
The acquisition resulted in the recognition of $838 million of goodwill, which is deductible for tax purposes and represents the future economic benefits expected to arise from anticipated synergies and intangible assets that do not qualify for separate recognition, including an assembled workforce, non-contractual relationships and other agreements.
For the years ended December 31, 2023 and 2022, the Company recognized $856 million and $490 million, respectively, of wholesale sales and revenues, $770 million and $472 million, respectively, of cost of sales, and a net loss of $83 million and $101 million, respectively, from ADESA operations, which includes $122 million and $83 million, respectively, of depreciation and amortization, including acquired intangible assets amortization expense of $15 million for each year.
The following unaudited pro forma combined results of operations information for the year ended December 31, 2022 has been prepared as if the ADESA Acquisition occurred on January 1, 2022:
| | | | | | | |
| Unaudited |
| Year ended December 31, 2022 |
| | | |
| | | |
| (in millions) |
| Revenues | $ | 13,903 | | | |
| Net loss | (3,024) | | | |
| Net loss attributable to non-controlling interests | (1,343) | | | |
| Net loss attributable to Carvana Co. | $ | (1,681) | | | |
| Net loss per share of Class A common stock - basic and diluted | $ | (15.89) | | | |
| Weighted-average shares of Class A common stock - basic and diluted | 105,808 | | | |
The unaudited pro forma combined results of operations information reflect the following pro forma adjustments:
| | | | | | | |
| Unaudited |
| Year ended December 31, 2022 |
| | | |
| | | |
| (in millions) |
| Interest expense | $ | 123 | | | |
| Lease expense | $ | 5 | | | |
| Depreciation and amortization expense | $ | 13 | | | |
| Intercompany revenues and cost of sales | $ | (7) | | | |
The unaudited pro forma combined results of operations information is provided for informational purposes only and is not necessarily intended to represent the results that would have been achieved had the ADESA Acquisition been consummated on January 1, 2022 or indicative of the results that may be achieved in the future.
CARVANA CO. AND SUBSIDIARIES
NOTES TO CONSOLIDATED FINANCIAL STATEMENTS
(Continued)
NOTE 4 — PROPERTY AND EQUIPMENT, NET
The following table summarizes property and equipment, net, as of December 31, 2024 and 2023: | | | | | | | | | | | |
| December 31, |
| 2024 | | 2023 |
| | | |
| (in millions) |
| Land and site improvements | $ | 1,335 | | | $ | 1,331 | |
| Buildings and improvements | 1,380 | | | 1,344 | |
| Transportation fleet | 545 | | | 570 | |
| Software | 301 | | | 296 | |
| Furniture, fixtures, and equipment | 147 | | | 144 | |
| Total property and equipment excluding construction in progress | 3,708 | | | 3,685 | |
| Less: accumulated depreciation and amortization on property and equipment | (994) | | | (775) | |
| Property and equipment excluding construction in progress, net | 2,714 | | | 2,910 | |
| Construction in progress | 59 | | | 72 | |
| Property and equipment, net | $ | 2,773 | | | $ | 2,982 | |
Depreciation and amortization expense on property and equipment in cost of sales was $140 million, $169 million, and $114 million for the years ended December 31, 2024, 2023, and 2022, respectively. Depreciation and amortization expense on property and equipment in selling, general and administrative expense was $147 million, $166 million, and $183 million during the years ended December 31, 2024, 2023, and 2022, respectively.
NOTE 5 — INTANGIBLE ASSETS
The following table summarizes intangible assets, net as of December 31, 2024 and 2023:
| | | | | | | | | | | | | |
| | | December 31, |
| | | 2024 | | 2023 |
| | | | | |
| | | (in millions) |
| | | | | |
| Customer relationships | | | $ | 50 | | | $ | 50 | |
| Developed technology | | | 41 | | | 41 | |
| | | | | |
| Intangible assets, acquired cost | | | 91 | | | 91 | |
| Less: accumulated amortization | | | (57) | | | (39) | |
| Intangible assets, net | | | $ | 34 | | | $ | 52 | |
| | | | | |
| | | | | |
| | | | | |
| | | | | |
| | | | | |
Amortization expense was $18 million, $17 million and $16 million during the years ended December 31, 2024, 2023, and 2022, respectively. As of December 31, 2024, the remaining weighted-average amortization period for definite-lived intangible assets was 4.0 years. The anticipated annual amortization expense to be recognized in future years as of December 31, 2024 is as follows:
| | | | | |
| Expected Future Amortization |
| (in millions) |
| 2025 | $ | 14 | |
| 2026 | 7 | |
| 2027 | 5 | |
| 2028 | 3 | |
| 2029 | 2 | |
| Thereafter | 3 | |
| Total | $ | 34 | |
CARVANA CO. AND SUBSIDIARIES
NOTES TO CONSOLIDATED FINANCIAL STATEMENTS
(Continued)
NOTE 6 — ACCOUNTS PAYABLE AND OTHER ACCRUED LIABILITIES
The following table summarizes accounts payable and accrued liabilities as of December 31, 2024 and 2023:
| | | | | | | | | | | |
| December 31, |
| 2024 | | 2023 |
| | | |
| (in millions) |
Accounts payable, including $17 and $7, respectively, due to related parties | $ | 236 | | | $ | 231 | |
Accrued interest expense | 96 | | | 7 | |
| Accrued compensation and benefits | 92 | | | 41 | |
| Sales taxes and vehicle licenses and fees | 87 | | | 77 | |
| Reserve for returns and cancellations | 75 | | | 57 | |
| Customer deposits | 63 | | | 30 | |
| Accrued advertising costs | 18 | | | 4 | |
| | | |
Income tax liability | — | | | 3 | |
| Other accrued liabilities | 189 | | | 146 | |
Total accounts payable and accrued liabilities | $ | 856 | | | $ | 596 | |
NOTE 7 — RELATED PARTY TRANSACTIONS
Lease Agreements
In November 2014, the Company and DriveTime Automotive Group, Inc. (together with its consolidated affiliates, collectively, "DriveTime"), a related party of the Company due to Ernest Garcia II, Ernest Garcia III, and entities controlled by one or both of them (collectively the "Garcia Parties") controlling and owning substantially all of the interests in DriveTime, entered into a lease agreement, which currently governs the occupation of two inspection and reconditioning centers in Blue Mound, Texas and Delanco, New Jersey. The lease for the Blue Mound, Texas location expires in 2029, with two five-year renewal options, and the lease for the Delanco, New Jersey location expires in 2026, with no current renewal options. The Company makes monthly lease payments based on DriveTime's actual rent expense. In addition, the Company is responsible for the actual insurance costs, tenant improvements required to conduct operations, and real estate taxes.
In February 2017, the Company entered into a lease agreement with DriveTime for sole occupancy of a fully operational inspection and reconditioning center in Winder, Georgia. In May 2024, the lease expiration for the Winder, Georgia location was extended to 2030, subject to two remaining renewal options of five years each.
Expenses related to these operating lease agreements are allocated based on usage to inventory and selling, general and administrative expenses in the accompanying consolidated balance sheets and statements of operations. Costs allocated to inventory are recognized as cost of sales when the inventory is sold. Total costs related to these operating lease agreements, including those noted above, were $3 million, $3 million, and $4 million, for the years ended December 31, 2024, 2023, and 2022, respectively, allocated between inventory and selling, general, and administrative expenses.
Office Leases
In September 2016, the Company entered into a lease for office space in Tempe, Arizona. In connection with that lease, the Company entered into a sublease with DriveTime for the use of another floor in the same building. The lease and sublease each had a term of 83 months, subject to the right to exercise three five-year extension options. Pursuant to the sublease, the Company paid the rent equal to the amounts due under DriveTime's master lease directly to DriveTime's landlord. The lease and sublease expired in February 2024. The rent expense incurred related to the first floor sublease was less than $1 million during each of the years ended December 31, 2024, 2023, and 2022.
In December 2019, Verde Opportunity Heath LLC, an affiliate of DriveTime ("Verde"), purchased an office building in Tempe, Arizona that the Company leased from an unrelated landlord prior to Verde's purchase. In connection with the purchase, Verde assumed that lease. The lease has an initial term of ten years expiring in 2029, subject to the right to exercise
CARVANA CO. AND SUBSIDIARIES
NOTES TO CONSOLIDATED FINANCIAL STATEMENTS
(Continued)
two five-year extension options. The rent expense incurred under the lease with Verde was $1 million during each of the years ended December 31, 2024, 2023, and 2022.
Wholesale Vehicle Sales
DriveTime purchases wholesale vehicles from the Company through competitive auctions that are open to other dealers. As a result, the Company recognized $12 million, $10 million, and $30 million of wholesale sales and revenues from DriveTime during the years ended December 31, 2024, 2023, and 2022, respectively.
Wholesale Marketplace Revenues
DriveTime sells vehicles to, and purchases vehicles from, third parties through the Company's wholesale marketplace platform. These transactions occur through competitive auctions in which all registered buyers and sellers are able to bid on and purchase, or list and sell, wholesale vehicles. In addition, beginning in September 2023, certain auction locations provide DriveTime with reconditioning services. As a result, the Company recognized $16 million, $9 million, and $2 million of wholesale sales and revenues from DriveTime during the years ended December 31, 2024, 2023, and 2022, respectively, and $2 million and less than $1 million of cost of sales to DriveTime related to reconditioning services during the years ended December 31, 2024 and 2023, respectively.
Retail Vehicle Acquisitions and Reconditioning
During the second quarter of 2021, the Company began acquiring reconditioned retail vehicles from DriveTime. The purchase price of each vehicle was equal to the wholesale price of the vehicle plus a fee for transportation and reconditioning services. As of December 31, 2024 and 2023, zero and less than $1 million, respectively, related to these vehicles and reconditioning services were included in vehicle inventory in the accompanying consolidated balance sheets. The Company also recognized less than $1 million, $4 million, and $22 million of cost of goods sold during the years ended December 31, 2024, 2023, and 2022, respectively, related to these vehicles.
Master Dealer Agreement
In December 2016, the Company entered into a master dealer agreement with DriveTime (the "Master Dealer Agreement"), most recently amended in April 2021, pursuant to which the Company may sell VSCs to customers purchasing a vehicle from the Company. The Company earns a commission on each VSC sold to its customers and DriveTime is obligated by and subsequently administers the VSCs. The Company collects the retail purchase price of the VSCs from its customers and remits the purchase price net of commission to DriveTime. The Master Dealer Agreement further allows the Company to receive payments for excess reserves based on the performance of the VSCs versus the reserves held by the VSC administrator, once a required claims period for such VSCs has passed. During the years ended December 31, 2024, 2023, and 2022, the Company recognized $193 million, $138 million, and $176 million, respectively, of commissions earned on VSCs sold to its customers and administered by DriveTime, net of a reserve for estimated contract cancellations, and payments for excess reserves to which it expects to be entitled, which are included in other sales and revenues in the accompanying consolidated statements of operations.
Beginning in 2017, DriveTime also administers the Company's limited warranty provided to all customers. The Company pays a per-vehicle fee to DriveTime to administer the limited warranty included with every purchase. The Company incurred $19 million, $17 million, and $18 million during the years ended December 31, 2024, 2023, and 2022, respectively, related to the administration of limited warranty.
Profit Sharing Agreement
In June 2018, the Company entered into an agreement with an unaffiliated third party, pursuant to which the Company would sell certain Road Hazard ("RH") and Pre-Paid Maintenance ("PPM") contracts. Under this agreement, third parties would administer the RH and PPM contracts, including providing customer and administrative services, and pay a profit sharing component to the Company. In 2022, the Company began selling equivalent offerings from DriveTime, pursuant to the Master Dealer Agreement discussed above, and all rights and obligations in connection with existing RH and PPM contracts were transferred to DriveTime (the "Transferred Contracts"). Finally, in December 2022, the Company entered into a profit sharing agreement with DriveTime with regard to the Transferred Contracts (the "Profit Sharing Agreement"). The Company recognized $7 million in revenue during each of the years ended December 31, 2024 and 2023, and $3 million during the year ended 2022 under the Profit Sharing Agreement.
CARVANA CO. AND SUBSIDIARIES
NOTES TO CONSOLIDATED FINANCIAL STATEMENTS
(Continued)
Servicing and Administrative Fees
DriveTime provides servicing and administrative functions associated with the Company's finance receivables. The Company incurred expenses of $10 million, $13 million, and $10 million for the years ended December 31, 2024, 2023, and 2022, respectively, related to these services.
Aircraft Time Sharing Agreement
The Company entered into an agreement to share usage of two aircraft owned by Verde and operated by DriveTime on October 22, 2015, and the agreement was subsequently amended in 2017. Pursuant to the agreement, the Company agreed to reimburse DriveTime for actual expenses for each of its flights. The original agreement was for 12 months, with perpetual 12-month automatic renewals. Either the Company or DriveTime can terminate the agreement with 30 days’ prior written notice. The Company reimbursed DriveTime less than $1 million under this agreement during each of the years ended December 31, 2024, 2023, and 2022.
Accounts Payable Due to Related Party
As of December 31, 2024 and 2023, $17 million and $7 million, respectively, was due to related parties primarily related to the agreements mentioned above, and is included in accounts payable and accrued liabilities in the accompanying consolidated balance sheets.
Tax Receivable Agreement Liability
As further discussed in Note 15 — Income Taxes, as of December 31, 2024 and 2023, the Company recorded a tax receivable agreement ("TRA") liability of $82 million and $14 million, respectively, of which $61 million and $11 million, respectively, is due to related parties. Refer to Note 15 — Income Taxes for further discussion of the TRA.
Contributions of Class A Common Stock From Ernest Garcia III
On January 5, 2022, in recognition of the Company selling its 1 millionth vehicle in the fourth quarter of 2021, the Company's CEO, Ernest Garcia III ("Mr. Garcia"), committed to giving then-current employees 23 shares of Class A common stock each from his personal shareholdings once employees reach their two-year employment anniversary ("CEO Milestone Gift" or "Gift"). As a result and during the three months ended March 31, 2022, the Company granted 23 restricted stock units ("RSUs") to each current employee, which vested after completion of their second year of employment, for a total of 435,035 RSUs granted during the period. For every Gift that vested, and pursuant to a contribution agreement (the "Contribution Agreement") entered into by and between the Company and Mr. Garcia on February 22, 2022, Mr. Garcia contributed to the Company, at the end of each fiscal quarter, the number of shares of Class A common stock, granted pursuant to the CEO Milestone Gift, that had vested during such quarter. The shares contributed shall be shares of Class A common stock that Mr. Garcia individually owned, at no charge. During the years ended December 31, 2024 and 2023, 1,104 and 62,606 RSUs, respectively, vested and an equal number of shares of Class A common stock were contributed by Mr. Garcia. As of January 2024, all RSUs granted pursuant to the CEO Milestone Gift had vested or been forfeited. Although the Company does not expect Mr. Garcia to incur any tax obligations related to the contribution, the Company has agreed to indemnify Mr. Garcia from any such obligations that may arise.
Private Placement
On July 17, 2023, the Company entered into a Transaction Support Agreement pursuant to which, among other things, and subject to certain conditions, the Garcia Parties committed to purchase up to $126 million of equity in the Company. In satisfaction of that commitment, on August 18, 2023, the Company entered into a Securities Purchase Agreement with the Garcia Parties providing for the purchase of an aggregate of 3.4 million Class A Units, together with 2.7 million shares of Class B common stock, at a price equivalent to $46.31 per share of Class A common stock, or $37.048 per Class A Unit on an as-exchanged basis. The Company used the proceeds therefrom to partially fund the cash tender offer to purchase a portion of the 2025 Senior Unsecured Notes (as defined in Note 10 — Debt Instruments).
CARVANA CO. AND SUBSIDIARIES
NOTES TO CONSOLIDATED FINANCIAL STATEMENTS
(Continued)
NOTE 8 — FINANCE RECEIVABLE SALE AGREEMENTS
The Company originates loans for its customers and sells them to partners and investors pursuant to finance receivable sale agreements. Historically, the Company has sold loans through two types of arrangements: forward flow agreements and fixed pool loan sales, including securitization transactions.
Master Purchase and Sale Agreement
In December 2016, the Company entered into a master purchase and sale agreement (the "Master Purchase and Sale Agreement" or "MPSA") with Ally Bank and Ally Financial Inc. (collectively the "Ally Parties"). Pursuant to the MPSA, the Company sells finance receivables meeting certain underwriting criteria under a committed forward flow arrangement without recourse to the Company for their post-sale performance. On January 11, 2024, the Company and the Ally Parties amended the MPSA to reestablish the commitment by the Ally Parties to purchase up to $4.0 billion of principal balances of finance receivables between January 11, 2024 and January 10, 2025.
During the years ended December 31, 2024, 2023, and 2022, the Company sold $3.0 billion, $3.6 billion, and $3.8 billion, respectively, in principal balances of finance receivables under the MPSA and had $1.0 billion of unused capacity as of December 31, 2024. On January 3, 2025, the Company and the Ally Parties amended the MPSA to, among other things, reestablish the commitment by the Ally Parties to purchase up to $4.0 billion of principal balances of finance receivables between January 3, 2025 and January 2, 2026.
Securitization Transactions
The Company sponsors and establishes securitization trusts to purchase finance receivables from the Company. The securitization trusts issue asset-backed securities, some of which are collateralized by the finance receivables that the Company sells to the securitization trusts. Upon sale of the finance receivables to the securitization trusts, the Company recognizes a gain or loss on sales of finance receivables. The net proceeds from the sales are the fair value of the assets obtained as part of the transactions and typically include cash and at least 5% of the beneficial interests issued by the securitization trusts to comply with the Risk Retention Rules, as defined and further discussed in Note 9 — Securitizations and Variable Interest Entities.
During the years ended December 31, 2024, 2023 and 2022, the Company sold $3.8 billion, $2.8 billion and $2.4 billion, respectively, in principal balances of finance receivables through securitization transactions.
Fixed Pool Loan Sales
During the year ended December 31, 2024, the Company completed fixed pool loan sales of $1.5 billion in principal balances of finance receivables to an unrelated third party on terms substantially similar to the Company’s securitization transactions and sales under the MPSA. There were no fixed pool loan sales other than securitization transactions during the years ended December 31, 2023 or 2022.
Gain on Loan Sales
The total gain related to finance receivables sold to financing partners and pursuant to securitization transactions was $755 million, $434 million, and $411 million during the years ended December 31, 2024, 2023, and 2022, respectively, which is included in other sales and revenues in the accompanying consolidated statements of operations.
NOTE 9 — SECURITIZATIONS AND VARIABLE INTEREST ENTITIES
As noted in Note 8 — Finance Receivable Sale Agreements, the Company sponsors and establishes securitization trusts to purchase finance receivables from the Company. The securitization trusts issue asset-backed securities, some of which are collateralized by the finance receivables that the Company sells to the securitization trusts. Upon sale of the finance receivables to the securitization trusts, the Company recognizes a gain or loss on sales of finance receivables. The net proceeds from the sales are the fair value of the assets obtained as part of the transactions and typically include cash and at least 5% of the beneficial interests issued by the securitization trusts to comply with Regulation RR of the Dodd-Frank Wall Street Reform and Consumer Protection Act of 2010 (the "Risk Retention Rules"). The beneficial interests retained by the Company include, but are not limited to, rated notes and certificates of the securitization trusts. The holders of the certificates issued by the
CARVANA CO. AND SUBSIDIARIES
NOTES TO CONSOLIDATED FINANCIAL STATEMENTS
(Continued)
securitization trusts have rights to cash flows only after the holders of the notes issued by the securitization trusts have received their contractual cash flows. The securitization trusts have no direct recourse to the Company’s assets, and holders of the securities issued by the securitization trusts can look only to the assets of the securitization trusts that issued their securities for payment. The beneficial interests held by the Company are subject principally to the credit and prepayment risk stemming from the underlying finance receivables.
The securitization trusts established in connection with asset-backed securitization transactions are VIEs. For each VIE that the Company establishes in its role as sponsor of securitization transactions, it performs an analysis to determine whether or not it is the primary beneficiary of the VIE. The Company’s continuing involvement with the VIEs consists of retaining a portion of the securities issued by the VIEs, providing industry standard representations and warranties regarding the underlying finance receivables, and performing ministerial duties as the trust administrator. As of December 31, 2024, the Company was not the primary beneficiary of these securitization trusts because its retained interests in the VIEs do not have exposures to losses or benefits that could potentially be significant to the VIEs. As such, the Company does not consolidate the securitization trusts.
The assets the Company retains in the unconsolidated VIEs are presented as beneficial interests in securitizations on the accompanying consolidated balance sheets, which as of December 31, 2024 and 2023 were $464 million and $366 million, respectively. The Company held no other assets or liabilities related to its involvement with unconsolidated VIEs as of December 31, 2024 and 2023.
The following table summarizes the carrying value and total exposure to losses of its assets related to unconsolidated VIEs with which the Company has continuing involvement, but is not the primary beneficiary at December 31, 2024 and 2023. Total exposure represents the estimated loss the Company would incur under severe, hypothetical circumstances, such as if the value of the interests in the securitization trusts and any associated collateral declined to zero. The Company believes the possibility of this is remote. As such, the total exposure presented below is not an indication of the Company's expected losses.
| | | | | | | | | | | | | | | | | | | | | | | |
| December 31, 2024 | | December 31, 2023 |
| Carrying Value | | Total Exposure | | Carrying Value | | Total Exposure |
| | | | | | | |
| (in millions) |
| Rated notes | $ | 355 | | | $ | 355 | | | $ | 287 | | | $ | 287 | |
| Certificates and other assets | 109 | | | 109 | | | 79 | | | 79 | |
| Total unconsolidated VIEs | $ | 464 | | | $ | 464 | | | $ | 366 | | | $ | 366 | |
The beneficial interests in securitizations are considered securities available for sale subject to restrictions on transfer pursuant to the Company’s obligations as a sponsor under the Risk Retention Rules. As described in Note 10 — Debt Instruments, the Company has entered into secured borrowing facilities through which it finances certain of these retained beneficial interests in securitizations. These securities are interests in securitization trusts, thus there are no contractual maturities. The amortized cost and fair value of securities available for sale as of December 31, 2024 and 2023 were as follows:
| | | | | | | | | | | | | | | | | | | | | | | |
| December 31, 2024 | | December 31, 2023 |
| Amortized Cost | | Fair Value | | Amortized Cost | | Fair Value |
| | | | | | | |
| (in millions) |
| Rated notes | $ | 356 | | | $ | 355 | | | $ | 294 | | | $ | 287 | |
| Certificates and other assets | 104 | | | 109 | | | 71 | | | 79 | |
| Total securities available for sale | $ | 460 | | | $ | 464 | | | $ | 365 | | | $ | 366 | |
CARVANA CO. AND SUBSIDIARIES
NOTES TO CONSOLIDATED FINANCIAL STATEMENTS
(Continued)
NOTE 10 — DEBT INSTRUMENTS
Debt instruments, excluding finance leases, which are discussed in Note 16 — Leases, as of December 31, 2024 and 2023 consisted of the following:
| | | | | | | | | | | |
| December 31, |
| 2024 | | 2023 |
| | | |
| (in millions) |
| Asset-based financing: | | | |
| Floor plan facility | $ | 67 | | | $ | 113 | |
| Finance receivable facilities | — | | | 555 | |
Financing of beneficial interests in securitizations | 354 | | | 293 | |
| | | |
| Real estate financing | 485 | | | 485 | |
| Total asset-based financing | 906 | | | 1,446 | |
Senior Secured Notes (1) | 4,358 | | | 4,378 | |
Senior Unsecured Notes | 205 | | | 205 | |
| Total debt | 5,469 | | | 6,029 | |
| Less: current portion | (302) | | | (777) | |
Less: unamortized debt issuance costs (2) | (46) | | | (60) | |
Plus: unamortized premium (3) | 27 | | | 37 | |
| Total included in long-term debt, net | $ | 5,148 | | | $ | 5,229 | |
(1) Includes $105 million and $185 million of accrued paid-in-kind ("PIK") interest as of December 31, 2024 and 2023, respectively. Accrued PIK interest increases the principal amount of Senior Secured Notes on each semi-annual interest payment date.
(2) The unamortized debt issuance costs related to long-term debt are presented as a reduction of the carrying amount of the corresponding liabilities on the accompanying consolidated balance sheets. Unamortized debt issuance costs related to revolving debt arrangements are presented within other assets on the accompanying consolidated balance sheets and not included here.
(3) The unamortized premium relates to a portion of the notes exchange offers completed in September 2023 which were accounted for as a debt modification.
Short-Term Revolving Facilities
Floor Plan Facility
The Company previously entered into a floor plan facility with the Ally Parties to finance its vehicle inventory, which was secured by Carvana LLC's vehicle inventory, general intangibles, accounts receivable, and finance receivables (as amended, the "Floor Plan Facility"). On September 1, 2023, the Company amended the Floor Plan Facility in connection with the issuance of the Senior Secured Notes (as defined below) to provide for an additional exclusive grant of collateral over certain deposit accounts and the cash on deposit in those accounts in favor of the lender and to amend certain other affirmative and negative covenants. The Company amended and restated the Floor Plan Facility on November 1, 2023, to resize the line of credit to $1.5 billion through April 30, 2025 and to lower the interest rate to (i) a prime rate plus 0.10% when amounts drawn under the facility are under 50% of the then current inventory balance and (ii) a prime rate plus 0.50% when amounts drawn are over 50%.
Under the Floor Plan Facility, repayment of amounts drawn for the purchase of a vehicle should generally be made within several days after selling or otherwise disposing of the vehicle. Outstanding balances related to vehicles held in inventory for more than 120 days require monthly principal payments equal to 10% of the original principal amount of that vehicle until the remaining outstanding balance is equal to the lesser of (i) 50% of the original principal amount or (ii) 50% of the wholesale value. Prepayments may be made without incurring a premium or penalty. Additionally, the Company is permitted to make prepayments to the lender to be held as principal payments under the Floor Plan Facility and subsequently reborrow such amounts. The Floor Plan Facility also requires monthly interest payments and restricted cash requirements on a sliding scale whereby at least 12.5% of the total principal amount owed to the lender is required to be held as restricted cash if amounts
CARVANA CO. AND SUBSIDIARIES
NOTES TO CONSOLIDATED FINANCIAL STATEMENTS
(Continued)
drawn are under 50% of the then current inventory balance, which requirement increases to (i) 17.5% required to be held as restricted cash if amounts drawn are between 50% and 59.99%, (ii) 22.5% required to be held as restricted cash if amounts drawn are between 60% and 69.99%, and (iii) 25% required to be held as restricted cash if amounts drawn are equal to or over 70%. The Company is also required to pay the lender an availability fee based on the average unused capacity during the prior calendar quarter under the Floor Plan Facility.
As of December 31, 2024, the Company had $67 million outstanding under the facility, unused capacity of $1.4 billion, and held $8 million in restricted cash related to this facility. During the year ended December 31, 2024, the Company's effective interest rate on the Floor Plan Facility was 6.85%.
As of December 31, 2023, the Company had $113 million outstanding under the Floor Plan Facility, unused capacity of $1.4 billion, and held $14 million in restricted cash related to this facility. For the year ended December 31, 2023, the Company's effective interest rate on the facility was 7.86%.
Finance Receivable Facilities
The Company has various short-term revolving credit facilities to fund certain finance receivables originated by the Company prior to selling them, which are typically secured by the finance receivables pledged to them (the "Finance Receivable Facilities").
In January 2020, the Company entered into an agreement pursuant to which a lender agreed to provide a revolving credit facility to fund certain finance receivables originated by the Company. In 2023, the Company amended its agreement to, among other things, adjust the line of credit to $500 million. In January 2024, the maturity date was extended to January 19, 2025, which date was further extended on January 15, 2025, for a maturity date of April 15, 2026.
In February 2020, the Company entered into an agreement pursuant to which a second lender agreed to provide a $500 million revolving credit facility to fund certain finance receivables originated by the Company. In December 2021, the Company amended its agreement to, among other things, increase the line of credit to $600 million and in December 2023, the maturity date was extended to December 8, 2025.
In April 2021, the Company entered into an agreement pursuant to which a third lender agreed to provide a $500 million revolving credit facility to fund certain finance receivables originated by the Company. In December 2021, the Company amended its agreement to, among other things, increase this line of credit to $600 million, and in April 2024 the maturity date was extended to October 10, 2025.
In March 2022, the Company entered into an agreement pursuant to which a fourth lender agreed to provide a $500 million revolving credit facility to fund certain finance receivables originated by the Company. In August 2024, the Company amended its agreement to extend the maturity date to August 7, 2025.
In May 2023, the Company entered into an agreement pursuant to which a fifth lender agreed to provide a $500 million revolving credit facility to fund certain finance receivables originated by the Company until May 31, 2024. In May 2024, the Company amended its agreement to extend the maturity date to August 15, 2025.
The Finance Receivable Facilities require that any undistributed amounts collected on the pledged finance receivables be held as restricted cash. The Finance Receivable Facilities require monthly payments of interest and fees based on usage and unused facility amounts. The Finance Receivable Facilities self-amortize from the end of the draw period until maturity, offer full prepayment rights, and have no credit sublimits or aging restrictions, subject to negotiated concentration limits. The subsidiaries that entered into these Finance Receivable Facilities are each wholly-owned, special purpose entities whose assets are not available to the general creditors of the Company. As of December 31, 2024 and 2023, the Company had zero and $555 million, respectively, outstanding under these Finance Receivable Facilities, unused capacity of $2.7 billion and $2.1 billion, respectively, and held $2 million and $8 million, respectively, in restricted cash related to these Finance Receivable Facilities. During the years ended December 31, 2024 and 2023, the Company's effective interest rate on these Finance Receivable Facilities was 7.39% and 6.60%.
CARVANA CO. AND SUBSIDIARIES
NOTES TO CONSOLIDATED FINANCIAL STATEMENTS
(Continued)
Long-Term Debt
Senior Secured Notes
The Company has issued various tranches of Senior Secured Notes (collectively, the "Senior Secured Notes") as further described below:
| | | | | | | | | | | | | | | | | | | | | | | | | | | | | |
Senior Secured Notes | December 31,
2024 | | December 31,
2023 | | Year 1 PIK Interest Rate | | Year 2 Cash/PIK Toggle Interest Rate | | Thereafter Cash Interest Rate |
| | | | | | | | | |
| (in millions, except percentages) |
Notes due December 1, 2028 (the "2028 Senior Secured Notes") | $ | 611 | | | $ | 981 | | | 12% | | 9%/12% | | 9% |
Notes due June 1, 2030 (the "2030 Senior Secured Notes") | 1,660 | | | 1,471 | | | 13% | | 11%/13% | | 9% |
Notes due June 1, 2031 (the "2031 Senior Secured Notes") | 1,982 | | | 1,741 | | | 14% | | --/14% | | 9% |
Accrued PIK interest | 105 | | | 185 | | | | | | | |
| Total principal amount | $ | 4,358 | | | $ | 4,378 | | | | | | | |
Less: unamortized debt issuance costs | (40) | | | (53) | | | | | | | |
Plus: unamortized premium | 27 | | | 37 | | | | | | | |
Total Senior Secured debt | $ | 4,345 | | | $ | 4,362 | | | | | | | |
Interest on each of the Senior Secured Notes is payable semi-annually on February 15 and August 15, and commenced on February 15, 2024. On February 15, 2024 and as required by the indentures governing the Senior Secured Notes, the Company increased the principal amount of the 2028, 2030, and 2031 Senior Secured Notes in connection with the payment of interest in kind of $53 million, $88 million, and $111 million, respectively. Further, on August 15, 2024 and as required by the indentures governing the Senior Secured Notes, the Company increased the principal amount of the 2028, 2030, and 2031 Senior Secured Notes in connection with the payment of interest in kind of $47 million, $101 million, and $130 million, respectively. On February 15, 2025, the Company paid interest for the 2028 and 2030 Senior Secured Notes in cash, and intends to continue to pay cash interest for the 2028 and 2030 Senior Secured Notes at the next semi-annual payment date on August 15, 2025. As a result, beginning on August 15, 2024, the Company is accruing PIK interest only on the 2031 Senior Secured Notes. Cash interest expense on the 2028 and 2030 Senior Secured Notes is included in accounts payable and accrued liabilities in the accompanying consolidated balance sheets.
The Company may redeem some or all of each series of Senior Secured Notes at any time prior to certain specified redemption dates (the "Secured Early Redemption Dates") and at 100% of the principal amount outstanding plus applicable make-whole premiums set forth in each respective indenture, plus any accrued and unpaid interest to the redemption date. Prior to the Secured Early Redemption Dates, the Company may also redeem up to 35% of the original aggregate principal amount of the 2028 and 2030 Senior Secured Notes at a redemption price equal to 109% of the principal amount outstanding, together with accrued and unpaid interest to, but not including, the date of redemption, using the net cash proceeds of certain equity offerings. Finally, on or after the Secured Early Redemption Dates, the Company may redeem its Senior Secured Notes in whole or in part at redemption prices set forth in each respective indenture, plus accrued and unpaid interest up to but excluding the redemption date. If the Company experiences certain change of control events, it must make an offer to purchase all of the Senior Secured Notes at 101% of the principal amount thereof, plus any accrued and unpaid interest, to the repurchase date.
During the year ended December 31, 2024, the Company repurchased $370 million of principal amount of the 2028 Senior Secured Notes in the open market for $384 million which included $8 million of accrued interest. Additionally, during the year ended December 31, 2024, the Company redeemed $100 million of principal amount of the 2028 Senior Secured Notes for $108 million which included $3 million of accrued interest. The repurchased notes were cancelled upon receipt. The repurchases and redemption are treated as an extinguishment of debt, with any realized discount (premium) recognized as a gain (loss) on debt extinguishment in the accompanying consolidated statements of operations, net of transaction fees and write-offs of related unamortized debt issuance costs and unamortized premium. As a result of the repurchases and redemption, during the year ended December 31, 2024, the Company recognized a net loss on debt extinguishment of $12 million which included $2 million of transaction fees and write-offs of related unamortized debt issuance costs and unamortized premium.
CARVANA CO. AND SUBSIDIARIES
NOTES TO CONSOLIDATED FINANCIAL STATEMENTS
(Continued)
The Senior Secured Notes mature as specified in the table above unless earlier repurchased or redeemed and are fully and unconditionally guaranteed on a senior secured basis, jointly and severally, by all of the domestic restricted subsidiaries of the Company (other than, subject to certain exceptions, any subsidiary that constitutes an "immaterial subsidiary," "captive insurance subsidiary," "securitization subsidiary" or "permitted joint venture"). The Senior Secured Notes and the guarantees are secured by (i) second-priority liens on certain assets and property of the Company, pledged in favor of the Ally Parties under the Floor Plan Facility and (ii) first-priority liens on certain assets and property of the Company and the guarantors, as identified in the indentures to the Senior Secured Notes.
The indentures to the Senior Secured Notes contain restrictive covenants that limit the ability of the Company and its restricted subsidiaries to, among other things and subject to certain exceptions, incur additional debt or issue preferred stock, create new liens, create restrictions on intercompany payments, pay dividends and make other distributions in respect of the Company's capital stock, redeem or repurchase the Company’s capital stock or prepay subordinated indebtedness, make certain investments or certain other restricted payments, guarantee indebtedness, designate unrestricted subsidiaries, sell certain kinds of assets, enter into certain types of transactions with affiliates, and effect mergers or consolidations.
On September 1, 2023, the Company completed a series of transactions whereby it exchanged validly tendered senior unsecured notes for newly issued senior secured notes (the "Exchange Offers"). Concurrently with the Exchange Offers, the Company also completed a cash tender offer to purchase any and all of the Company's outstanding 2025 Senior Unsecured Notes for cash at a purchase price equal to 85.0% of the aggregate principal amount thereof (the "Cash Tender Offer" and together with the Exchange Offers, the "Offers"). Upon consummation of the Offers, the Company exchanged Senior Unsecured Notes with an aggregate outstanding principal amount of $5.5 billion for $4.2 billion in aggregate principal amount of newly issued senior secured notes (collectively the "Senior Secured Notes"), paid $341 million in cash for validly tendered 2025 Senior Unsecured Notes, and paid $146 million in cash related to accrued and unpaid interest for validly tendered Senior Unsecured Notes. Additionally, the Company wrote off $66 million of debt issuance costs in connection with the Offers.
The Company assessed the Offers to determine whether the transactions represent debt modifications or debt extinguishments under ASC 470. As a result of certain lenders that participated in the Offers, the Company determined that a majority of the Offers were a debt extinguishment and the remainder of the Offers were a debt modification, which resulted in a gain on debt extinguishment of $878 million. As a result, during the year ended December 31, 2023, the Company initially recognized a $40 million premium which is reflected as an addition to the principal balance of the Senior Secured Notes and will be amortized against interest expense over the respective lives of the Senior Secured Notes.
The aggregate principal amounts of the Senior Unsecured Notes that were validly tendered and accepted by the Company in the Offers are set forth in the table below.
| | | | | | | | | | | | | | | | | | | | | | | | | | | | | | | | | | | | | | | | | | | | | | | |
| | | Principal Amount Validly Tendered and Accepted | | | | | | Allocation to Senior Secured Notes Issued |
Senior Unsecured Notes | Outstanding Principal Prior to Exchange | | | Accepted as % of Outstanding | | Cash Tender Offer Payment | | 2028 Senior Secured Notes | | 2030 Senior Secured Notes | | 2031 Senior Secured Notes | | Total Senior Secured Notes |
| | | | | | | | | | | | | | | |
| (in millions, except percentages) |
2025 Senior Unsecured Notes | $ | 500 | | | $ | 402 | | | 80.3 | % | | $ | 341 | | | $ | — | | | $ | — | | | $ | — | | | $ | — | |
2027 Senior Unsecured Notes | 600 | | | 568 | | | 94.7 | % | | — | | | 102 | | | 153 | | | 181 | | | 436 | |
2028 Senior Unsecured Notes | 600 | | | 578 | | | 96.3 | % | | — | | | 90 | | | 135 | | | 160 | | | 385 | |
2029 Senior Unsecured Notes | 750 | | | 724 | | | 96.6 | % | | — | | | 110 | | | 165 | | | 195 | | | 470 | |
2030 Senior Unsecured Notes | 3,275 | | | 3,248 | | | 99.2 | % | | — | | | 679 | | | 1,018 | | | 1,205 | | | 2,902 | |
Total | $ | 5,725 | | | $ | 5,520 | | | 96.4 | % | | $ | 341 | | | $ | 981 | | | $ | 1,471 | | | $ | 1,741 | | | $ | 4,193 | |
CARVANA CO. AND SUBSIDIARIES
NOTES TO CONSOLIDATED FINANCIAL STATEMENTS
(Continued)
Senior Unsecured Notes
The Company has issued various tranches of Senior Unsecured Notes (the "Senior Unsecured Notes") each under a separate indenture, as further described below:
| | | | | | | | | | | | | | | | | |
Senior Unsecured Notes | December 31,
2024 | | December 31,
2023 | | Interest Rate |
| | | | | |
| (in millions, except percentages) |
Notes due October 1, 2025 ("2025 Senior Unsecured Notes") | $ | 98 | | | $ | 98 | | | 5.625 | % |
Notes due April 15, 2027 ("2027 Senior Unsecured Notes") | 32 | | | 32 | | | 5.500 | % |
Notes due October 1, 2028 ("2028 Senior Unsecured Notes") | 22 | | | 22 | | | 5.875 | % |
Notes due September 1, 2029 ("2029 Senior Unsecured Notes") | 26 | | | 26 | | | 4.875 | % |
Notes due May 1, 2030 ("2030 Senior Unsecured Notes") | 27 | | | 27 | | | 10.250 | % |
| Total principal amount | 205 | | | 205 | | | |
| Less: current portion | (98) | | | — | | | |
Less: unamortized debt issuance costs | (1) | | | (1) | | | |
| Total included in long-term debt, net | $ | 106 | | | $ | 204 | | | |
Each of the 2025, 2027, 2028 and 2029 Senior Unsecured Notes were issued pursuant to an indenture entered into by and among the Company, each of the guarantors party thereto and U.S. Bank National Association, as trustee. The 2030 Senior Unsecured Notes were issued pursuant to an indenture entered into by and among the Company, each of the guarantors party thereto and U.S. Bank Trust Company, National Association, as trustee. Interest on each of the Senior Unsecured Notes is payable semi-annually. The Senior Unsecured Notes mature as specified in the table above unless earlier repurchased or redeemed and are guaranteed by certain of the Company's subsidiaries. In March 2023, the Company designated ADESA and its subsidiaries as unrestricted subsidiaries under the indentures governing the Senior Unsecured Notes.
The Company may redeem some or all of each series of Senior Unsecured Notes at any time prior to certain specified redemption dates (the "Unsecured Early Redemption Dates") at the redemption prices and applicable make-whole premiums set forth in each respective indenture, plus any accrued and unpaid interest to the redemption date. Prior to the Unsecured Early Redemption Dates, the Company may also redeem up to 35% of the aggregate principal amount at a redemption price equal to 100% plus the respective interest rate specified in the table above, together with accrued and unpaid interest to, but not including, the date of redemption, with the net cash proceeds of certain equity offerings. With respect to the 2030 Senior Unsecured Notes, the Company may, at its option, redeem in the aggregate up to 10% of the original aggregate principal amount of the 2030 Senior Unsecured Notes during the period from, and including, May 1, 2025 to, but excluding May 1, 2027, at a redemption price equal to 105.125% of the 2030 Senior Unsecured Notes to be redeemed, plus accrued and unpaid interest thereon to the relevant redemption rate. Finally, on or after the Unsecured Early Redemption Dates, the Company may redeem some or all of the Senior Unsecured Notes in whole or in part at redemption prices set forth in each respective indenture, plus accrued and unpaid interest up to but excluding the redemption date.
As discussed above, on September 1, 2023, the Company completed the Offers, including the Exchange Offers to exchange an outstanding principal amount of $5.1 billion of the Senior Unsecured Notes for newly issued Senior Secured Notes, and the Cash Tender Offer to purchase an outstanding principal amount of $402 million of the 2025 Senior Unsecured Notes, leading to a total reduction of an aggregate outstanding principal amount of $5.5 billion of the Senior Unsecured Notes. In connection with the Exchange Offers, the Company obtained consents from holders of each series of Senior Unsecured Notes to amend the indentures governing the notes to eliminate substantially all of the restrictive covenants as well as certain events of default and related provisions therein, and on August 30, 2023, the Company and the trustee entered into supplemental indentures to effect such amendments.
Real Estate Financing
The Company finances certain purchases and construction of its property and equipment through various sale and leaseback transactions. As of December 31, 2024, none of these transactions have qualified for sale accounting due to meeting the criteria for finance leases, or forms of continuing involvement, such as repurchase options or renewal periods that extend the lease for substantially all of the asset's remaining useful life, and are therefore accounted for as financing transactions.
CARVANA CO. AND SUBSIDIARIES
NOTES TO CONSOLIDATED FINANCIAL STATEMENTS
(Continued)
These arrangements require monthly payments and have initial terms of 20 to 25 years. Some of the agreements are subject to renewal options of up to 25 years and some are subject to base rent increases throughout the term. As of both December 31, 2024 and 2023, the outstanding liability associated with these sale and leaseback arrangements, net of unamortized debt issuance costs, was $482 million and was included in long-term debt in the accompanying consolidated balance sheets.
Financing of Beneficial Interests in Securitizations
As discussed in Note 9 — Securitizations and Variable Interest Entities, the Company has retained certain beneficial interests in securitizations pursuant to the Company’s obligations as a sponsor under the Risk Retention Rules. Beginning in June 2019, the Company entered into secured borrowing facilities through which it finances certain retained beneficial interests in securitizations whereby the Company sells such interests and agrees to repurchase them for their fair value at a stated time of repurchase.
As of December 31, 2024 and 2023, the Company had pledged $354 million and $293 million, respectively, of its beneficial interests in securitizations as collateral under the repurchase agreements with expected repurchases ranging from October 2025 to December 2032. The securitization trusts distribute payments related to the Company's pledged beneficial interests in securitizations directly to the lenders, which reduces the beneficial interests in securitizations and the related debt balance. Pledged collateral levels are monitored daily and are generally maintained at an agreed-upon percentage of the fair value of the amounts borrowed during the life of the transactions. In the event of a decline in the fair value of the pledged collateral, the repurchase price of the pledged collateral will be increased by the amount of the decline.
The outstanding balance of these facilities, net of unamortized debt issuance costs, was $351 million and $290 million, as of December 31, 2024 and 2023, respectively, of which $136 million and $108 million, respectively was included in current portion of long-term debt in the accompanying consolidated balance sheets.
Principal Maturities
The following table summarizes the aggregate principal maturities due in each period for Senior Secured Notes (excluding any accrued PIK interest), Senior Unsecured Notes, real estate financing, and financing of beneficial interests in securitizations as of December 31, 2024. Maturities related to financing of beneficial interests in securitizations are estimated based on expected timing of payments from the securitization trusts to the lender.
| | | | | |
| As of December 31, 2024 |
| |
| (in millions) |
| 2025 | $ | 235 | |
| 2026 | 98 | |
| 2027 | 94 | |
| 2028 | 670 | |
| 2029 | 43 | |
| Thereafter | 4,157 | |
| Total | $ | 5,297 | |
As of December 31, 2024, the Company was in compliance with all debt covenants.
NOTE 11 — STOCKHOLDERS' EQUITY (DEFICIT)
Classes of Common Stock and LLC Units
Carvana Co.'s amended and restated certificate of incorporation, among other things, authorizes (i) 50 million shares of Preferred Stock, par value $0.01 per share, (ii) 500 million shares of Class A common stock, par value $0.001 per share, and (iii) 125 million shares of Class B common stock, par value $0.001 per share. Each share of Class A common stock generally entitles its holder to one vote on all matters to be voted on by stockholders. Each share of Class B common stock held by the Garcia Parties generally entitles its holder to ten votes on all matters to be voted on by stockholders, for so long as the Garcia Parties maintain direct or indirect beneficial ownership of at least 25% of the outstanding shares of Carvana Co.'s Class A common stock determined on an as-exchanged basis assuming that all of the Class A Units were exchanged for Class A
CARVANA CO. AND SUBSIDIARIES
NOTES TO CONSOLIDATED FINANCIAL STATEMENTS
(Continued)
common stock. All other shares of Class B common stock generally entitle their holders to one vote per share on all matters to be voted on by stockholders. Holders of Class B common stock are not entitled to receive dividends and would not be entitled to receive any distributions upon the liquidation, dissolution or winding down of the Company. Holders of Class A and Class B common stock vote together as a single class on all matters presented to stockholders for their vote or approval, except as otherwise required by applicable law.
Carvana Group's amended and restated LLC Agreement provides for two classes of common ownership interests in Carvana Group: (i) Class A Units and (ii) Class B Units (together, the "LLC Units"). Carvana Co. is required to, at all times, maintain (i) a four-to-five ratio between the number of shares of Class A common stock issued and outstanding by Carvana Co. and the number of Class A Units owned by Carvana Co. (subject to certain exceptions for treasury shares and shares underlying certain convertible or exchangeable securities and subject to adjustment as set forth in the exchange agreement (the "Exchange Agreement") further discussed below, and taking into account Carvana Co. Sub LLC's 0.1% ownership interest in Carvana, LLC) and (ii) a four-to-five ratio between the number of shares of Class B common stock owned by the original holders of LLC Units prior to the IPO (the "Original LLC Unitholders") and the number of Class A Units owned by the Original LLC Unitholders. The Company may issue shares of Class B common stock only to the extent necessary to maintain these ratios. Shares of Class B common stock are transferable only if an Original LLC Unitholder elects to exchange them, together with 1.25 times as many LLC Units, for consideration from the Company. Such consideration from the Company can be, at the Company's election, either shares of Class A common stock or cash.
As of December 31, 2024 and 2023, there were 265 million and 250 million Class A Units, respectively, and 2 million at each period of Class B Units (as adjusted for the participation thresholds and closing price of Class A common stock on December 31, 2024 and 2023), issued and outstanding. As discussed in Note 13 — Equity-Based Compensation, Class B Units were issued under the Company’s LLC Equity Incentive Plan (the "LLC Equity Incentive Plan") and are subject to a participation threshold, and are earned over the requisite service period.
At-the-Market Offering
On July 19, 2023, the Company entered into a distribution agreement with Citigroup Global Markets Inc. and Moelis & Company LLC to establish an ATM Program, and on July 31, 2024, the Company refreshed the ATM Program by entering into an Amended and Restated Distribution Agreement with Barclays Capital Inc., Citigroup Global Markets Inc., Moelis & Company LLC, and Virtu Americas LLC. Under the ATM Program as of December 31, 2024, the Company could sell up to the greater of (i) shares of Class A common stock representing an aggregate offering price of $1.0 billion or (ii) an aggregate of 35 million shares of Class A common stock, from time to time. The Company uses the net proceeds from the ATM Program to purchase Class A Units.
The following table summarizes the activity under the ATM Program for the years ended December 31, 2024 and 2023.
| | | | | | | | | | | |
| December 31, 2024 | | December 31, 2023 |
| | | |
| (in millions, except share and per share amounts) |
| Shares of Class A common stock issued | 6,826,264 | | | 7,156,838 | |
| Weighted-average issuance price per share | $ | 186.56 | | | $ | 46.94 | |
Gross proceeds (1) | $ | 1,274 | | | $ | 336 | |
(1) Net proceeds were $1.264 billion and $327 million, respectively, after deducting $10 million and $9 million, respectively, of commissions and other offering expenses incurred.
Private Placement
On July 17, 2023, the Company entered into a Transaction Support Agreement pursuant to which, among other things, and subject to certain conditions, the Garcia Parties committed to purchase up to $126 million of equity in the Company. In satisfaction of that commitment, on August 18, 2023, the Company entered into a Securities Purchase Agreement with the Garcia Parties providing for the purchase of an aggregate of 3.4 million Class A Units, together with 2.7 million shares of Class B common stock, at a price equivalent to $46.31 per share of Class A common stock. The price equivalent of $46.31 per share of Class A common stock was equal to the weighted average sale price per share of Class A common stock sold under the ATM Program through August 18, 2023. As further described below, Class B common stock is exchangeable for an equivalent
CARVANA CO. AND SUBSIDIARIES
NOTES TO CONSOLIDATED FINANCIAL STATEMENTS
(Continued)
number of shares of Class A common stock, which exchange must be accompanied by 1.25 times as many Class A Units. As exchanged, the price per Class A Unit was $37.048. The Company may, at its election, pay consideration for such exchange in either shares of Class A common stock or in cash. The Company used the proceeds therefrom to partially fund the Cash Tender Offer as discussed in Note 10 — Debt Instruments.
Exchange Agreement
Carvana Co. and the Original LLC Unitholders together with any holders of LLC Units issued subsequent to the IPO (together, the "LLC Unitholders") entered into an Exchange Agreement under which each LLC Unitholder (and certain permitted transferees thereof) may receive shares of the Company's Class A common stock in exchange for their LLC Units on a four-to-five conversion ratio, or cash at the option of the Company, subject to (i) conversion ratio adjustments for stock splits, stock dividends, reclassifications and similar transactions, (ii) vesting for certain LLC Units, and (iii) the respective participation threshold for Class B Units. To the extent such owners also hold Class B common stock, they are required to deliver to Carvana Co. a number of shares of Class B common stock equal to the number of shares of Class A common stock being exchanged for. Any shares of Class B common stock so delivered are canceled. The number of exchangeable Class B Units is determined based on the value of Carvana Co.'s Class A common stock and the applicable participation threshold. Finally, in connection with each exchange, in order to preserve the required four-to-five ratio between the number of shares of Class A common stock issued and outstanding by Carvana Co. and the number of Class A Units owned by Carvana Co., an equivalent number of LLC units to the LLC units exchanged are issued to Carvana Co.
The exchanges affected pursuant to the Exchange Agreement during the years ended December 31, 2024 and 2023 were as follows:
| | | | | | | | | | | |
| December 31, 2024 | | December 31, 2023 |
| | | |
| (in thousands) |
LLC Units exchanged by certain LLC Unitholders | 8,685 | | | 34 | |
Shares of Class B common stock retired | 6,500 | | | 2 | |
Newly issued Class A common stock | 6,923 | | | 31 | |
LLC Units received by Carvana Co. | 8,653 | | | 39 | |
Class A Non-Convertible Preferred Units
In accordance with the Carvana Group, LLC amended and restated LLC Agreement, and in connection with the issuance of Senior Secured Notes or Senior Unsecured Notes by Carvana Co., Carvana Group, LLC is authorized to issue Class A Non-Convertible Preferred Units to Carvana Co. In each case, the consideration for the capital contribution made or deemed to have been made by Carvana Co. is equal to the net proceeds of notes issuances. As of December 31, 2024 and 2023, Carvana Co. held 4.5 million and 4.4 million Class A Non-Convertible Preferred Units, respectively.
When Carvana Co. makes payments on the Senior Unsecured Notes and Senior Secured Notes (collectively the "Senior Notes"), Carvana Group makes an equal cash distribution, as necessary, to the Class A Non-Convertible Preferred Units. For each $1,000 principal amount of Senior Notes that Carvana Co. repays or otherwise retires, one Class A Non-Convertible Preferred Unit is canceled and retired. During the year ended December 31, 2024, the Company cancelled and retired 0.47 million of Class A Non-Convertible Preferred Units in conjunction with the repurchases and redemption of 2028 Senior Secured Notes as discussed in Note 10 — Debt Instruments and issued 0.53 million of Class A Non-Convertible Preferred Units in conjunction with the PIK interest payments the Company was required to make on each of February 15 and August 15, 2024. During the year ended December 31, 2023, the Company cancelled and retired 5.5 million of Class A Non-Convertible Preferred Units in conjunction with the exchange of a portion of its Senior Unsecured Notes for new Senior Secured Notes.
Tax Asset Preservation Plan
On January 16, 2023, the Company entered into a Section 382 Rights Agreement, which was later amended and restated (the “Tax Asset Preservation Plan”). On June 3, 2024, the Company determined that the Tax Asset Preservation Plan was no longer necessary for the preservation of material valuable Tax Attributes (as defined therein) and set a final expiration date of June 4, 2024, upon which date the preferred share purchase rights expired and the Tax Asset Preservation Plan terminated. In connection therewith, the associated Series B Preferred Stock underlying the preferred share purchase rights was eliminated by
CARVANA CO. AND SUBSIDIARIES
NOTES TO CONSOLIDATED FINANCIAL STATEMENTS
(Continued)
filing of a Certificate of Elimination with the State of Delaware on June 5, 2024, returning such Preferred Stock to authorized but undesignated shares.
NOTE 12 — NON-CONTROLLING INTERESTS
As discussed in Note 1 — Business Organization, Carvana Co. consolidates the financial results of Carvana Group and reports a non-controlling interest related to the portion of Carvana Group owned by the LLC Unitholders. Changes in the ownership interest in Carvana Group while Carvana Co. retains its controlling interest will be accounted for as equity transactions. Exchanges of LLC Units result in a change in ownership and reduce the amount recorded as non-controlling interests and increase additional paid-in capital.
Upon the issuance of shares of Class A common stock by Carvana Co. related to the Company's equity compensation plans such as the exercise of options, issuance of restricted or non-restricted stock, payment of bonuses in stock or settlement of stock appreciation rights in stock, Carvana Group is required to issue to Carvana Co. a number of Class A Units equal to 1.25 times the number of shares of Class A common stock being issued in connection with the exercise of such options or issuance of other types of equity compensation, subject to adjustment for stock splits, stock dividends, reclassifications, and similar transactions. Activity related to the Company's equity compensation plans may result in a change in ownership which will impact the amount recorded as non-controlling interest and additional paid-in capital.
The non-controlling interest related to the Class B Units is determined based on the respective participation thresholds and the share price of Class A common stock on an as-converted basis. To the extent that the number of as-converted Class B Units change or Class B Units are forfeited, the resulting difference in ownership will be accounted for as equity transactions adjusting the non-controlling interest and additional paid-in capital.
During the years ended December 31, 2024, 2023, and 2022, the total adjustments related to exchanges of LLC Units and non-controlling interest related to restricted stock unit ("RSU") vesting and stock option ("NQSO") exercises were an increase in non-controlling interests and a corresponding decrease in additional paid-in capital of $33 million, and a decrease in non-controlling interests and a corresponding increase in additional paid-in capital of $1 million, and $1 million, respectively, which have been included in exchanges of LLC Units and adjustments to non-controlling interests related to RSU vesting and NQSO exercises in the accompanying consolidated statements of stockholders' equity (deficit). During the years ended December 31, 2024, 2023, and 2022, Carvana Co. utilized the net proceeds from its equity offerings and ATM Program to purchase Class A Units, which resulted in adjustments to increase non-controlling interests and to decrease additional paid-in capital by $515 million, $83 million, and $554 million, respectively, which have been included in adjustments to the non-controlling interests related to equity offerings in the accompanying consolidated statements of stockholders' equity (deficit).
As of December 31, 2024, Carvana Co. owned 62.3% of Carvana Group with the LLC Unitholders owning the remaining 37.7%. The net income (loss) attributable to the non-controlling interests on the accompanying consolidated statements of operations represents the portion of the net income (loss) attributable to the economic interest in Carvana Group held by the non-controlling LLC Unitholders calculated based on the weighted average non-controlling interests' ownership during the periods presented.
| | | | | | | | | | | | | | | | | |
| Years Ended December 31, |
| 2024 | | 2023 | | 2022 |
| | | | | |
| (in millions) |
| Transfers (to) from non-controlling interests: | | | | | |
| Decrease as a result of issuances of Class A and B common stock | $ | (515) | | | $ | (83) | | | $ | (554) | |
| | | | | |
| (Decrease) Increase as a result of exchanges of LLC Units and adjustments to non-controlling interests related to RSU vesting and NQSO exercises | (33) | | | 1 | | | 1 | |
| | | | | |
| Total transfers to non-controlling interests | $ | (548) | | | $ | (82) | | | $ | (553) | |
CARVANA CO. AND SUBSIDIARIES
NOTES TO CONSOLIDATED FINANCIAL STATEMENTS
(Continued)
NOTE 13 — EQUITY-BASED COMPENSATION
Equity-based compensation is recognized based on amortizing the grant-date fair value on a straight-line basis over the requisite service period, which is generally the vesting period of the award, less actual forfeitures. A summary of equity-based compensation recognized during the years ended December 31, 2024, 2023, and 2022 is as follows:
| | | | | | | | | | | | | | | | | |
| Years Ended December 31, |
| 2024 | | 2023 | | 2022 |
| | | | | |
| (in millions) |
| | | | | |
| Restricted Stock Units and Awards | $ | 81 | | | $ | 65 | | | $ | 80 | |
| | | | | |
| Options | 21 | | | 16 | | | 13 | |
| | | | | |
| Total equity-based compensation | 102 | | | 81 | | | 93 | |
| Equity-based compensation capitalized to property and equipment | (9) | | | (7) | | | (8) | |
| Equity-based compensation capitalized to inventory | (2) | | | (1) | | | (16) | |
| Equity-based compensation, net of capitalized amounts | $ | 91 | | | $ | 73 | | | $ | 69 | |
During the years ended December 31, 2024, 2023, and 2022, the Company capitalized $9 million, $7 million, and $8 million, respectively, of equity-based compensation to property and equipment related to software development and $2 million, $1 million, and $16 million, respectively, to inventory related to reconditioning and inbound transportation of vehicles. All other equity-related compensation is included in selling, general, and administrative expenses in the accompanying consolidated statements of operations.
As of December 31, 2024, unrecognized equity-based compensation related to outstanding awards and the related weighted-average period over which it is expected to be recognized subsequent to December 31, 2024 is presented in the table below. Total unrecognized equity-based compensation will be adjusted for actual forfeitures.
| | | | | | | | | | | |
| Unrecognized Equity-Based Compensation Related to Outstanding Awards (in millions) | | Remaining Weighted-Average Amortization Period (in years) |
| | | |
| Restricted Stock Units and Awards | $ | 146 | | | 2.5 |
| Options | 41 | | | 2.6 |
| | | |
| Total unrecognized equity-based compensation | $ | 187 | | | |
2017 Omnibus Incentive Plan
In connection with the IPO, the Company adopted the 2017 Omnibus Incentive Plan (the "2017 Incentive Plan"). The number of shares authorized for issuance under the 2017 Incentive Plan is subject to an automatic annual increase (the "Automatic Increase") of the lesser of two percent of the Company's outstanding Class A common stock or an amount determined by the Compensation and Nominating Committee of the Board. On each of January 1, 2025 and 2024, the number of shares authorized for issuance under the 2017 Incentive Plan increased by two percent of the then outstanding Class A common stock under the Automatic Increase. In addition, on May 1, 2023, the Company's stockholders approved an amendment to the 2017 Incentive Plan to further increase the number of shares available under the 2017 Incentive Plan by 20 million shares (the "Amendment Increase"). After taking into account the January 1, 2024 Automatic Increase and the Amendment Increase, as of December 31, 2024, 17 million shares of Class A common stock are available for issuance under the 2017 Incentive Plan, which the Company may grant as stock options, stock appreciation rights, restricted stock awards, restricted stock units and other equity-based awards to employees, directors, officers, and consultants. The majority of equity granted by the Company vests over four-year periods based on continued employment with the Company.
CARVANA CO. AND SUBSIDIARIES
NOTES TO CONSOLIDATED FINANCIAL STATEMENTS
(Continued)
Restricted Stock Awards and Restricted Stock Units
Restricted stock awards ("RSAs") entitle recipients to vote and to receive all dividends declared with respect to such shares, payable upon vesting. RSAs vest over a period of two years, subject to the recipient's continued employment or service. During the year ended December 31, 2022, the Company issued certain employees an aggregate of less than 0.1 million RSAs pursuant to the terms of the 2017 Incentive Plan with a weighted-average grant-date fair value of $34.21. The Company determined the grant-date fair value of the RSAs based on the closing price of the Company's Class A common stock on the grant date. The Company did not grant any RSAs during the years ended December 31, 2024 and 2023.
Restricted stock units ("RSUs") do not entitle recipients to vote or receive dividends. RSUs generally vest over a period of four years, subject to the recipient's continued employment. RSUs also include performance-based awards granted to certain executive employees that cliff vest upon the achievement of certain financial targets, subject to the recipient's continued employment. During the years ended December 31, 2024, 2023, and 2022, the Company issued certain employees an aggregate of 2.0 million, 10.4 million, and 3.5 million RSUs, respectively, pursuant to the terms of the 2017 Incentive Plan with a weighted-average grant-date fair value of $48.00, $13.13, and $65.26, respectively. The Company determined the grant-date fair value of the RSUs based on the closing price of the Company's Class A common stock on the grant date. RSUs are settled in shares of Class A common stock on a one-to-one basis within thirty days of vesting.
RSA and RSU activity during the years ended December 31, 2024, 2023, and 2022 was as follows:
| | | | | | | | | | | |
| Number of RSAs/RSUs (in thousands) | | Weighted-Average Grant-Date Fair Value |
Outstanding at January 1, 2022 | 553 | | | $ | 162.32 | |
| Granted | 3,482 | | | $ | 65.26 | |
| Settled | (432) | | | $ | 113.96 | |
| Forfeited | (951) | | | $ | 134.83 | |
Outstanding and nonvested at December 31, 2022 | 2,652 | | | $ | 52.62 | |
| | | |
| Granted | 10,392 | | | $ | 13.13 | |
| Settled | (1,550) | | | $ | 41.39 | |
| Forfeited | (1,591) | | | $ | 24.25 | |
Outstanding and nonvested at December 31, 2023 | 9,903 | | | $ | 17.49 | |
| | | |
| Granted | 1,984 | | | $ | 48.00 | |
| Settled | (4,938) | | | $ | 18.10 | |
| Forfeited | (446) | | | $ | 23.40 | |
Outstanding and nonvested at December 31, 2024 | 6,503 | | | $ | 25.93 | |
Employee Stock Purchase Plan
In May 2021, the Company adopted an employee stock purchase plan (the "ESPP"), which went into effect on July 1, 2021. The ESPP allows substantially all employees, excluding members of senior management, to acquire shares of the Company's Class A common stock through payroll deductions over six-month offering periods, commencing on January 1 and July 1 of each year. The per share purchase price is equal to 90% of the fair market value of a share of the Company's Class A common stock on the last day of the offering period. Participant purchases are limited to maximums that may vary between $10,000 and $25,000 of stock per calendar year. The Company is authorized to grant up to 0.5 million shares of Class A common stock under the ESPP.
During the years ended December 31, 2024, 2023 and 2022, the Company issued 10,396, 32,790 and 86,352 shares of Class A common stock, respectively, and as of December 31, 2024, 367,968 shares of Class A common stock remained
CARVANA CO. AND SUBSIDIARIES
NOTES TO CONSOLIDATED FINANCIAL STATEMENTS
(Continued)
available for future issuance. During each of the three years ended December 31, 2024, 2023 and 2022, the Company recognized less than $1 million of equity-based compensation expense related to the ESPP.
Non-Qualified Stock Options
Non-qualified stock options allow recipients to purchase shares of Class A common stock at a fixed exercise price. The fixed exercise price is equal to the price of a share of Class A common stock at the time of grant. The options typically vest 25% on the anniversary of the grant date and in equal monthly installments thereafter for a total vesting period of four years and expire ten years after the grant date.
Stock option activity during the years ended December 31, 2024, 2023, and 2022 was as follows:
| | | | | | | | | | | | | | | | | | | | | | | |
| Number of Options (in thousands) | | Weighted-Average Exercise Price | | Weighted-Average Remaining Contractual Life (in years) | | Aggregate Intrinsic Value (in millions) |
Outstanding at January 1, 2022 | 1,066 | | | $ | 39.74 | | | 6.7 | | $ | 183 | |
| Options granted | 297 | | | $ | 119.53 | | | | | n/a |
| Options exercised | (89) | | | $ | 37.89 | | | | | $ | 7 | |
| Options forfeited or expired | (9) | | | $ | 30.97 | | | | | n/a |
Outstanding at December 31, 2022 | 1,265 | | | $ | 80.26 | | | 6.4 | | $ | — | |
| | | | | | | |
| Options granted | 2,805 | | | $ | 10.07 | | | | | n/a |
| Options exercised | (17) | | | $ | 13.62 | | | | | $ | — | |
| Options forfeited or expired | (47) | | | $ | 50.08 | | | | | n/a |
Outstanding at December 31, 2023 | 4,006 | | | $ | 31.75 | | | 8.1 | | $ | 135 | |
| | | | | | | |
| Options granted | 762 | | | $ | 44.80 | | | | | n/a |
| Options exercised | (441) | | | $ | 16.45 | | | | | $ | 59 | |
| Options forfeited or expired | — | | | $ | — | | | | | n/a |
Outstanding at December 31, 2024 | 4,327 | | | $ | 35.60 | | | 7.5 | | $ | 735 | |
| | | | | | | |
Vested and exercisable as of December 31, 2024 | 1,830 | | | $ | 48.93 | | | 6.3 | | $ | 291 | |
Expected to vest as of December 31, 2024 | 2,497 | | | $ | 25.84 | | | 8.4 | | $ | 444 | |
CARVANA CO. AND SUBSIDIARIES
NOTES TO CONSOLIDATED FINANCIAL STATEMENTS
(Continued)
The Company determined the grant-date fair value of the options granted during the years ended December 31, 2024, 2023, and 2022 using the Black-Scholes valuation model with the following weighted-average assumptions:
| | | | | | | | | | | | | | | | | |
| Years Ended December 31, |
| 2024 | | 2023 | | 2022 |
Expected volatility (1) | 93.8 | % | | 74.6 | % | | 69.2 | % |
| Expected dividend yield | — | % | | — | % | | — | % |
Expected term (in years) (2) | 6.00 | | 6.30 | | 6.28 |
| Risk-free interest rate | 4.1 | % | | 3.6 | % | | 2.0 | % |
| Weighted-average grant-date fair value per option | $37.99 | | $6.94 | | $74.85 |
(1) Measured using the Company's historical data, market option volatility and selected high-growth guideline companies and considering the risk factors that would influence the range of expected volatility because the Company does not have sufficient historical data to provide a reasonable basis upon which to estimate the expected volatility for the entirety of the term.
(2) Expected term represents the estimated period of time until an option is exercised and was determined using the simplified method because the Company does not have sufficient historical exercise data to provide a reasonable basis upon which to estimate the expected term.
Class A Units
During 2018, the Company granted certain employees Class A Units with service-based vesting over two- to four-year periods and a grant-date fair value of $18.58 per Class A Unit. The grantees entered into the Exchange Agreement under which each LLC Unitholder (and certain permitted transferees thereof) may receive shares of the Company's Class A common stock in exchange for their LLC Units on a four-to-five conversion ratio, or cash at the option of the Company, subject to conversion ratio adjustments for stock splits, stock dividends, reclassifications, and similar transactions and subject to vesting.
CARVANA CO. AND SUBSIDIARIES
NOTES TO CONSOLIDATED FINANCIAL STATEMENTS
(Continued)
A summary of the Class A Unit activity for the years ended December 31, 2024, 2023, and 2022 is as follows:
| | | | | | | | | | | |
| Class A Units |
| Number of Class A Units (in thousands) | | Weighted-Average Grant Date Fair Value |
Outstanding at January 1, 2022 | 85 | | | |
| Granted | — | | | n/a |
| Exchanged | — | | | n/a |
| Forfeited | (6) | | | $ | 18.58 | |
Outstanding at December 31, 2022 | 79 | | | |
| | | |
| Granted | — | | | n/a |
| Exchanged | — | | | n/a |
| Forfeited | — | | | n/a |
Outstanding at December 31, 2023 | 79 | | | |
| | | |
| Granted | — | | | n/a |
| Exchanged | (13) | | | n/a |
| Forfeited | — | | | n/a |
Outstanding at December 31, 2024 | 66 | | | |
| | | |
Vested as of December 31, 2024 | 66 | | | $ | 18.58 | |
Expected to vest as of December 31, 2024 | — | | | n/a |
Class B Units
In March 2015, Carvana Group adopted the LLC Equity Incentive Plan. Under the LLC Equity Incentive Plan, Carvana Group could grant Class B Units to eligible employees, non-employee officers, consultants and directors with service-based vesting, typically four to five years. In connection with the completion of the IPO, Carvana Group discontinued the grant of new awards under the LLC Equity Incentive Plan, however the LLC Equity Incentive Plan will continue in connection with administration of existing awards that remain outstanding. Grantees may receive shares of the Company's Class A common stock in exchange for Class B Units on a four-to-five conversion ratio, or cash at the option of the Company, subject to conversion ratio adjustments for stock splits, stock dividends, reclassifications, and similar transactions and subject to vesting and the respective participation threshold for Class B Units. Class B Units do not expire. There were no Class B Units issued during the years ended December 31, 2024, 2023, and 2022. As of December 31, 2024, outstanding Class B Units had participation thresholds between $0.00 to $12.00.
CARVANA CO. AND SUBSIDIARIES
NOTES TO CONSOLIDATED FINANCIAL STATEMENTS
(Continued)
A summary of the Class B Unit activity for the years ended December 31, 2024, 2023, and 2022 is as follows:
| | | | | | | | | | | | | | | |
| Class B Units | | |
| Number of Class B Units (in thousands) | | Weighted-Average Participation Threshold per Class B Unit | | | | |
Outstanding at January 1, 2022 | 2,627 | | | $ | 5.60 | | | | | |
| Granted | — | | | n/a | | | | |
| Exchanged | (61) | | | $ | 5.75 | | | | | |
| Forfeited | — | | | n/a | | | | |
Outstanding at December 31, 2022 | 2,566 | | | $ | 5.60 | | | | | |
| | | | | | | |
| Granted | — | | | n/a | | | | |
| Exchanged | (34) | | | $ | 3.52 | | | | | |
| Forfeited | — | | | n/a | | | | |
Outstanding at December 31, 2023 | 2,532 | | | $ | 5.62 | | | | | |
| | | | | | | |
| Granted | — | | | n/a | | | | |
| Exchanged | (546) | | | $ | 7.95 | | | | | |
| Forfeited | — | | | n/a | | | | |
Outstanding at December 31, 2024 | 1,986 | | | $ | 4.98 | | | | | |
| | | | | | | |
Vested as of December 31, 2024 | 1,986 | | | $ | 4.98 | | | | | |
Expected to vest as of December 31, 2024 | — | | | n/a | | | | |
NOTE 14 — NET EARNINGS (LOSS) PER SHARE
Basic and diluted net earnings (loss) per share is computed by dividing the net earnings (loss) attributable to Class A common stockholders by the weighted-average shares of Class A common stock outstanding during the period. Diluted net earnings (loss) per share is computed by giving effect to all potentially dilutive shares. Potentially dilutive shares have been excluded from the computation of diluted net earnings (loss) per share when their effect is anti-dilutive. Net earnings (loss) for all periods presented is attributable only to Class A common stockholders, due to no activity related to convertible preferred stock during those periods.
CARVANA CO. AND SUBSIDIARIES
NOTES TO CONSOLIDATED FINANCIAL STATEMENTS
(Continued)
The following table presents the calculation of basic and diluted net earnings (loss) per share during the years ended December 31, 2024, 2023, and 2022:
| | | | | | | | | | | | | | | | | |
| Years Ended December 31, |
| 2024 | | 2023 | | 2022 |
| | | | | |
| (in millions, except number of shares, which are reflected in thousands, and per share amounts) |
| Numerator: | | | | | |
| Net income (loss) | $ | 404 | | | $ | 150 | | | $ | (2,894) | |
| Net income (loss) attributable to non-controlling interests | 194 | | | (300) | | | (1,307) | |
| Net income (loss) attributable to Carvana Co. Class A common stockholders - basic | 210 | | | 450 | | | (1,587) | |
| Impact on net income of assumed conversions from LLC Units | — | | | (300) | | | — | |
Net income (loss) attributable to Carvana Co. Class A common stockholders - diluted | $ | 210 | | | $ | 150 | | | $ | (1,587) | |
| | | | | |
| Denominator: | | | | | |
| Weighted-average shares of Class A common stock outstanding | 122,346 | | | 109,347 | | | 100,848 | |
| Nonvested weighted-average restricted stock awards | (2) | | | (24) | | | (20) | |
| Weighted-average shares of Class A common stock outstanding - basic | 122,344 | | | 109,323 | | | 100,828 | |
| Dilutive effect of Class A common shares: | | | | | |
Stock Options (1) | 3,173 | | | 979 | | | — | |
Restricted Stock Units and Awards (1) | 6,689 | | | 4,815 | | | — | |
Class A Units (2) | — | | | 83,976 | | | — | |
Class B Units (2) | — | | | 1,485 | | | — | |
| Weighted-average shares of Class A common stock outstanding - diluted | 132,206 | | | 200,578 | | | 100,828 | |
| | | | | |
| Net earnings (loss) per share of Class A common stock - basic | $ | 1.72 | | | $ | 4.12 | | | $ | (15.74) | |
| Net earnings (loss) per share of Class A common stock - diluted | $ | 1.59 | | | $ | 0.75 | | | $ | (15.74) | |
(1) Calculated using the treasury stock method, if dilutive
(2) Calculated using the if-converted stock method, if dilutive
Shares of Class B common stock do not share in the losses or income of the Company and are therefore not participating securities. As such, separate presentation of basic and diluted net earnings (loss) per share of Class B common stock under the two-class method has not been presented.
CARVANA CO. AND SUBSIDIARIES
NOTES TO CONSOLIDATED FINANCIAL STATEMENTS
(Continued)
The following table presents potentially dilutive securities, as of the end of the period, excluded from the computations of diluted net earnings (loss) per share of Class A common stock for the years ended December 31, 2024, 2023, and 2022, respectively:
| | | | | | | | | | | | | | | | | |
| Years Ended December 31, |
| 2024 | | 2023 | | 2022 |
| (in thousands) |
| | | | | |
Options (1) | 365 | | | 976 | | | 1,265 | |
Restricted Stock Units and Awards (1) | 11 | | | 1,308 | | | 64 | |
Class A Units (2) | 83,509 | | | — | | | 82,963 | |
Class B Units (2) | 1,763 | | | — | | | 1,559 | |
(1) Represents number of instruments outstanding at the end of the period that were evaluated under the treasury stock method for potentially dilutive effects and were determined to be anti-dilutive.
(2) Represents the weighted-average as-converted LLC units that were evaluated under the if-converted method for potentially dilutive effects and were determined to be anti-dilutive.
NOTE 15 — INCOME TAXES
As described in Note 1 — Business Organization and Note 11 — Stockholders' Equity (Deficit), as a result of the IPO, Carvana Co. began consolidating the financial results of Carvana Group. Carvana Group is treated as a partnership for U.S. federal and most applicable state and local income tax purposes. As a partnership, Carvana Group is not subject to U.S. federal and certain state and local income taxes. Any taxable income or loss generated by Carvana Group is passed through to and included in the taxable income or loss of its members, including Carvana Co., based on its allocable share held in Carvana Group. Carvana Co. was formed on November 29, 2016 and did not engage in any operations prior to the IPO. Carvana Co. is taxed as a corporation and is subject to U.S. federal, state and local income taxes with respect to its allocable share of any taxable income or loss of Carvana Group, as well as any stand-alone income or loss generated by Carvana Co.
Net income (loss) before income taxes was $400 million, $175 million, and $(2.9) billion for the years ended December 31, 2024, 2023, and 2022, respectively. The Company had an income tax (benefit) provision of $(4) million, $25 million, and $1 million for the years ended December 31, 2024, 2023, and 2022, respectively.
The components of income tax (benefit) provision are as follows:
| | | | | | | | | | | | | | | | | |
| Years Ended December 31, |
| 2024 | | 2023 | | 2022 |
| | | | | |
| (in millions) |
| Federal - Current | $ | — | | | $ | 25 | | | $ | 2 | |
| Federal - Deferred | (3) | | | (4) | | | (1) | |
Federal - Total | (3) | | | 21 | | | 1 | |
| | | | | |
| State - Current | (1) | | | 4 | | | — | |
| State - Deferred | — | | | — | | | — | |
State - Total | (1) | | | 4 | | | — | |
| | | | | |
Income tax (benefit) provision | $ | (4) | | | $ | 25 | | | $ | 1 | |
CARVANA CO. AND SUBSIDIARIES
NOTES TO CONSOLIDATED FINANCIAL STATEMENTS
(Continued)
A reconciliation of the U.S. federal rate to the Company’s effective income tax rate is as follows:
| | | | | | | | | | | | | | | | | | | | | | | | | | | | | | | | | | | | | | |
| | Years Ended December 31, |
| | 2024 | | 2023 | | 2022 |
| | Amount | | Percent | | Amount | | Percent | | Amount | | Percent |
| | | | | | | | | | | | |
| | (dollars in millions) |
| Expected U.S. federal income taxes at statutory rate | $ | 84 | | | 21.0 | % | | $ | 37 | | | 21.0 | % | | $ | (607) | | | 21.0 | % |
| | | | | | | | | | | |
| (Income) Loss attributable to non-controlling interests | (42) | | | (10.6) | % | | 61 | | | 34.9 | % | | 274 | | | (9.5) | % |
| State taxes | 1 | | | 0.3 | % | | 19 | | | 10.9 | % | | (64) | | | 2.2 | % |
| Excess tax benefits related to stock-based compensation | (50) | | | (12.5) | % | | — | | | — | % | | — | | | — | % |
| Valuation allowance | (10) | | | (2.5) | % | | (96) | | | (54.9) | % | | 398 | | | (13.7) | % |
| Disallowed interest | 15 | | | 3.8 | % | | 5 | | | 2.9 | % | | — | | | — | % |
| | | | | | | | | | | |
| Benefit of tax credits | (2) | | | (0.5) | % | | (2) | | | (1.1) | % | | — | | | — | % |
| Other | — | | | — | % | | 1 | | | 0.6 | % | | — | | | — | % |
| Income tax (benefit) provision | $ | (4) | | | (1.0) | % | | $ | 25 | | | 14.3 | % | | $ | 1 | | | — | % |
Deferred income taxes reflect the net tax effects of temporary differences between the tax basis in an asset or liability and its reported amount under GAAP. These temporary differences result in taxable or deductible amounts in future years. The components of the Company’s deferred tax assets are as follows:
| | | | | | | | | | | | | | |
| | Years Ended December 31, |
| | 2024 | | 2023 |
| | | | |
| | (in millions) |
| Deferred tax assets: | | | |
| Investment in Carvana Group | $ | 1,510 | | | $ | 1,362 | |
| Net operating loss carryforward | 299 | | | 299 | |
| Interest expense carryforward | 302 | | | 177 | |
| Tax credit carryforward | 6 | | | 4 | |
| Cancellation of debt income | 103 | | | 116 | |
| Other | 24 | | | 9 | |
| Total gross deferred tax assets | 2,244 | | | 1,967 | |
| Valuation allowance | (2,241) | | | (1,962) | |
| Total deferred tax assets, net of valuation allowance | $ | 3 | | | $ | 5 | |
| | | | |
| Deferred tax liabilities | $ | — | | | $ | — | |
| | | | |
| | | | |
| Total deferred tax assets and liabilities | $ | 3 | | | $ | 5 | |
| | | |
As of both December 31, 2024 and 2023, the Company had federal and state net operating loss carry forwards of $1.2 billion. All federal net operating losses can be carried forward indefinitely, certain state net operating losses can be carried forward indefinitely, and others can be carried forward between 10 and 20 years.
As described in Note 11 — Stockholders' Equity (Deficit), the Company acquires LLC Units in connection with exchanges with LLC Unitholders. During the years ended December 31, 2024 and 2023, the Company recognized a gross deferred tax asset of $280 million and less than $1 million, respectively, associated with the difference in basis in its investment in Carvana Group related to these acquisitions of LLC Units. Additionally, as described in Note 11 — Stockholders' Equity (Deficit), the Company issues shares under the ATM Program and utilizes the proceeds from the issuance of Class A common stock to
CARVANA CO. AND SUBSIDIARIES
NOTES TO CONSOLIDATED FINANCIAL STATEMENTS
(Continued)
purchase Class A Units in Carvana Group. During the years ended December 31, 2024 and 2023, the Company recognized a gross deferred tax asset of $9 million and $21 million, respectively, associated with the difference in basis in its investment in Carvana Group related to these acquisitions of LLC Units.
As described in Note 10 — Debt Instruments, during the year ended December 31, 2023, the Company completed the Exchange Offers, whereby it exchanged validly tendered Senior Unsecured Notes for newly issued Senior Secured Notes. For U.S. tax purposes the Company recognized cancellation of debt income (“CODI”) on the difference between the adjusted issue price of the debt exchanged and the fair market value of the new debt issued. As a result, during the year ended December 31, 2023, the Company recognized $1.4 billion of CODI for tax purposes.
As described in Note 3 — Business Combinations, the Company acquired ADESA on May 9, 2022. The Company made an election under Section 336(e) of the United States Internal Revenue Code of 1986, as amended (the “Code”) to treat the acquisition as a deemed asset acquisition for income tax purposes and as such received a step up in asset basis and is able to amortize the acquired Goodwill under Section 197 of the Code over a 15-year period. The total Goodwill amortization expense was $56 million for each of the years ended December 31, 2024 and 2023, and $37 million for the year ended December 31, 2022.
During the year ended December 31, 2024, management performed an assessment of the recoverability of deferred tax assets. This assessment considered both objective and subjective factors. These factors included, but were not limited to, a history of taxable losses in prior years, excess tax benefits related to equity-based compensation, and future reversal of existing temporary differences. After evaluating all available evidence, management determined, based on the accounting standards applicable to such assessment, that there was sufficient evidence as a result of the Company’s cumulative losses to conclude it was more likely than not that its deferred tax assets would not be realized and has maintained a full valuation allowance against its deferred tax assets. Given the improvement in the Company's operating results and depending on the amount of equity-based compensation tax deductions available in the future, among other factors, a release of the deferred tax asset valuation allowance may be possible in the next few years. Release of all, or a portion, of the valuation allowance would result in the recognition of certain deferred tax assets and a decrease to income tax provision for the period the release is recorded.
The Company recognizes uncertain income tax positions when it is more-likely-than-not the position will be sustained upon examination. As of the year ended December 31, 2024 and 2023, the Company has not identified any uncertain tax positions and has not recognized any related reserves.
The Company's effective tax rate for the years ended December 31, 2024 and 2023 was a benefit of 1.0% and an expense of 14.3%, respectively.
Tax Receivable Agreement
Carvana Co. expects to obtain an increase in its share of the tax basis in the net assets of Carvana Group when LLC Units are exchanged by the LLC Unitholders and other qualifying transactions. As described in Note 11 — Stockholders' Equity (Deficit), each change in outstanding shares of Class A common stock results in a corresponding increase or decrease in Carvana Co.'s ownership of LLC Units. The Company intends to treat any exchanges of LLC Units as direct purchases of LLC interests for U.S. federal income tax purposes. These increases in tax basis may reduce the amounts that Carvana Co. would otherwise pay in the future to various taxing authorities. They may also decrease gains (or increase losses) on future dispositions of certain capital assets to the extent tax basis is allocated to those capital assets.
In connection with the IPO, the Company entered into a TRA. Under the TRA, the Company generally will be required to pay to the LLC Unitholders 85% of the amount of cash savings, if any, in U.S. federal, state or local tax that the Company actually realizes directly or indirectly (or are deemed to realize in certain circumstances) as a result of (i) certain tax attributes created as a result of any sales or exchanges (as determined for U.S. federal income tax purposes) to or with the Company of their interests in Carvana Group for shares of Carvana Co.'s Class A common stock or cash, including any basis adjustment relating to the assets of Carvana Group and (ii) tax benefits attributable to payments made under the TRA (including imputed interest). The Company expects to benefit from the remaining 15% of any tax benefits that it may actually realize. To the extent that the Company is unable to timely make payments under the TRA for any reason, such payments generally will be deferred and will accrue interest until paid.
If the Internal Revenue Service or a state or local taxing authority challenges the tax basis adjustments that give rise to payments under the TRA and the tax basis adjustments are subsequently disallowed, the recipients of payments under the
CARVANA CO. AND SUBSIDIARIES
NOTES TO CONSOLIDATED FINANCIAL STATEMENTS
(Continued)
agreement will not reimburse the Company for any payments the Company previously made to them. Any such disallowance would be taken into account in determining future payments under the TRA and would, therefore, reduce the amount of any such future payments. Nevertheless, if the claimed tax benefits from the tax basis adjustments are disallowed, the Company’s payments under the TRA could exceed its actual tax savings, and the Company may not be able to recoup payments under the TRA that were calculated on the assumption that the disallowed tax savings were available.
The TRA provides that if (i) certain mergers, asset sales, other forms of business combinations, or other changes of control were to occur, (ii) there is a material breach of any material obligations under the TRA; or (iii) the Company elects an early termination of the TRA, then the TRA will terminate and the Company's obligations, or the Company's successor’s obligations, under the TRA will accelerate and become due and payable, based on certain assumptions, including an assumption that the Company would have sufficient taxable income to fully utilize all potential future tax benefits that are subject to the TRA and that any LLC Units that have not been exchanged are deemed exchanged for the fair market value of the Company's Class A common stock at the time of termination.
As of December 31, 2024 and 2023, the Company recorded a TRA liability of $82 million and $14 million, respectively, of which $61 million and $11 million, respectively, will be paid to related parties. As of December 31, 2024 and 2023, $17 million and zero, respectively, is included in other current liabilities and $65 million and $14 million, respectively, is included in other liabilities on the accompanying consolidated balance sheets. For the remaining $2.0 billion TRA liability as of December 31, 2024, the Company has concluded, based on applicable accounting standards, that it was more likely than not that its deferred tax assets subject to the TRA would not be realized; therefore, the Company has not recorded an additional liability related to the tax savings it may realize from utilization of such deferred tax assets. If utilization of the deferred tax assets subject to the TRA becomes more likely than not in the future, the Company will record a liability related to the TRA which will be recognized as expense within its consolidated statements of operations.
Uncertain Tax Positions
Based on the Company's analysis of tax positions taken on income tax returns filed, no uncertain tax positions existed as of December 31, 2024, 2023, and 2022. Carvana Co. was formed in November 2016 and did not engage in any operations prior to the IPO and associated organizational transactions. Carvana Co. was not required to file 2016 tax returns and filed its first tax returns for the tax year 2017, the first year it became subject to examination by taxing authorities for U.S. federal and state income tax purposes. Carvana Group, LLC is treated as a partnership for U.S. federal and state income tax purposes and its tax returns are subject to examination by taxing authorities. Carvana Group has filed income tax returns for years through 2023. These returns are subject to examination by the taxing authorities in the respective jurisdictions, generally for three or four years after they were filed.
NOTE 16 — LEASES
The Company is party to various lease agreements for real estate and transportation equipment. For each lease agreement, the Company determines its lease term as the non-cancellable period of the lease and includes options to extend or terminate the lease when it is reasonably certain that it will exercise that option. The Company also assesses whether each lease is an operating or finance lease at the lease commencement date. Rent expense of operating leases is recognized on a straight-line basis over the lease term and includes scheduled rent increases as well as amortization of tenant improvement allowances.
Operating Leases
As of December 31, 2024, the Company is a tenant under various operating leases related to certain of its hubs, vending machines, inspection and reconditioning centers, auction locations, storage, parking, and corporate offices. The initial terms expire at various dates between 2025 and 2038. Many of the leases include one or more renewal options ranging from one to twenty years and some contain purchase options. The Company leases and subleases certain of its real estate to third parties. Lease and sublease income for the years ended December 31, 2024, 2023, and 2022 was $7 million, $5 million, and $3 million, respectively, and is included in selling, general and administrative expenses in the accompanying consolidated statements of operations.
The Company's operating leases are included in operating lease right-of-use assets, other current liabilities, and operating lease liabilities on the accompanying consolidated balance sheets.
Refer to Note 7 — Related Party Transactions for further discussion of operating leases with related parties.
CARVANA CO. AND SUBSIDIARIES
NOTES TO CONSOLIDATED FINANCIAL STATEMENTS
(Continued)
Finance Leases
The Company has finance leases for certain equipment in its transportation fleet. The leases have initial terms of two to five years, some of which include extension options for up to four additional years, and require monthly payments. The Company's finance leases are included in current portion of long-term debt and long-term debt on the accompanying consolidated balance sheets.
Lease Costs and Activity
The Company's lease costs and activity during the years ended December 31, 2024, 2023, and 2022 were as follows:
| | | | | | | | | | | | | | | | | |
| December 31, |
| 2024 | | 2023 | | 2022 |
| | | | | |
| (in millions) |
| Lease costs: | | | | | |
| Finance leases: | | | | | |
| Amortization of finance lease assets | $ | 96 | | | $ | 108 | | | $ | 95 | |
| Interest obligations under finance leases | 13 | | | 17 | | | 19 | |
| Total finance lease costs | $ | 109 | | | $ | 125 | | | $ | 114 | |
| | | | | |
| Operating leases: | | | | | |
Fixed lease costs to non-related parties (1) | $ | 61 | | | $ | 66 | | | $ | 129 | |
| Fixed lease costs to related parties | 4 | | | 5 | | | 5 | |
| Variable short-term lease costs to related parties | — | | | — | | | 1 | |
| Total operating lease costs | $ | 65 | | | $ | 71 | | | $ | 135 | |
| | | | | |
| Cash payments related to lease liabilities included in operating cash flows: | | | | | |
| Operating lease liabilities to non-related parties | $ | 93 | | | $ | 109 | | | $ | 83 | |
| Operating lease liabilities to related parties | $ | 4 | | | $ | 5 | | | $ | 5 | |
| Interest payments on finance lease liabilities | $ | 13 | | | $ | 18 | | | $ | 19 | |
| | | | | |
| Cash payments related to lease liabilities included in financing cash flows: | | | | | |
| Principal payments on finance lease liabilities | $ | 81 | | | $ | 115 | | | $ | 139 | |
(1) The year ended December 31, 2022 includes $28 million of lease termination fees, net of amounts written off for the corresponding operating lease right-of-use assets and operating lease liabilities which were terminated.
CARVANA CO. AND SUBSIDIARIES
NOTES TO CONSOLIDATED FINANCIAL STATEMENTS
(Continued)
Maturity Analysis of Lease Liabilities
The following table summarizes maturities of lease liabilities as of December 31, 2024:
| | | | | | | | | | | | | | | | | | | | | | | | | | | | | |
| | | Operating Leases (1) | | |
| Finance Leases | | Related Party (2) | | Non-Related Party | | Total Operating | | Total |
| | | | | | | | | |
| (in millions) |
| 2025 | $ | 84 | | | $ | 4 | | | $ | 97 | | | $ | 101 | | | $ | 185 | |
| 2026 | 71 | | | 3 | | | 95 | | | 98 | | | 169 | |
| 2027 | 34 | | | 3 | | | 88 | | | 91 | | | 125 | |
| 2028 | 8 | | | 3 | | | 79 | | | 82 | | | 90 | |
| 2029 | — | | | 2 | | | 61 | | | 63 | | | 63 | |
| Thereafter | — | | | — | | | 193 | | | 193 | | | 193 | |
| Total minimum lease payments | 197 | | | 15 | | | 613 | | | 628 | | | 825 | |
| Less: amount representing interest | (14) | | | (3) | | | (144) | | | (147) | | | (161) | |
| | | | | | | | | |
| Total lease liabilities | $ | 183 | | | $ | 12 | | | $ | 469 | | | $ | 481 | | | $ | 664 | |
(1) Leases that are on a month-to-month basis, short-term leases, and lease extensions that the Company does not expect to exercise are not included.
(2) Related party lease payments exclude rent payments due under the DriveTime lease Agreements for locations where the Company shares space with DriveTime, as those are variable lease payments contingent upon the Company's utilization of the leased assets.
As of December 31, 2024 and 2023, none of the Company's lease agreements contain material residual value guarantees or material restrictive covenants.
Lease Terms and Discount Rates
The weighted-average remaining lease terms and discount rates as of December 31, 2024, 2023, and 2022 were as follows, excluding short-term operating leases:
| | | | | | | | | | | | | | | | | |
| December 31, |
| 2024 | | 2023 | | 2022 |
| Weighted average remaining lease terms (years) | | | | | |
| Operating leases | 7.2 | | 7.8 | | 8.4 |
| Finance leases | 2.6 | | 3.5 | | 4.2 |
| Weighted-average discount rate | | | | | |
| Operating leases | 7.3 | % | | 7.1 | % | | 7.1 | % |
| Finance leases | 5.9 | % | | 5.9 | % | | 5.7 | % |
NOTE 17 — COMMITMENTS AND CONTINGENCIES
Accrued Limited Warranty
As part of its retail strategy, the Company provides a 100-day or 4,189-mile limited warranty to customers to repair certain broken or defective components of each used vehicle sold. As such, the Company accrues for such repairs based on actual claims incurred to-date and repair reserves based on historical trends. The liability was $21 million and $16 million, as of December 31, 2024 and 2023, respectively, and is included in accounts payable and other accrued liabilities in the accompanying consolidated balance sheets. The expense was $116 million, $87 million, and $144 million for the years ended December 31, 2024, 2023, and 2022, respectively, and is included in selling, general and administrative expenses in the accompanying consolidated statements of operations.
CARVANA CO. AND SUBSIDIARIES
NOTES TO CONSOLIDATED FINANCIAL STATEMENTS
(Continued)
Purchase Obligations
The Company has purchase obligations for certain customary services related to operating a wholesale auction business of $109 million in aggregate over the next four years, as of December 31, 2024. These purchase obligations are recorded as liabilities when the services are rendered.
Legal Matters
From time to time, the Company is involved in various claims, legal actions, and governmental inquiries. For example, the Company is currently a party to legal and regulatory disputes, including intellectual property disputes, putative class action lawsuits, and shareholder derivative lawsuits, alleging, among other things, patent infringement, the violation of federal securities and antitrust laws and state laws regarding consumer protection, stockholders' rights, and the titling and registration of vehicles sold to its customers. These disputes include, but are not limited to, Carvana, LLC v. IBM Corp., United States District Court for the Southern District of New York (Case No. 7:23-cv-08616-KMK-VR); Dana Jennings, et al. v. Carvana, LLC, United States District Court for the Eastern District of Pennsylvania (Case No. 5:21-cv-05400-EGS); and Syretta Harvin et al. v. Carvana, LLC et al., United States District Court for the Eastern District of Pennsylvania (Case No. 2:23-cv-02068-MRP).
In 2024, In re Carvana Co. Stockholders Litigation, Delaware Chancery Court (Case No. 2020-0415-KSJM) was dismissed, all charges against Company officers and directors brought in In re Carvana Co. Stockholders Litigation, Delaware Chancery Court (Case No. 2023-0600-KSJM) were dismissed, and Michael Cribier v. Carvana, LLC, United States District Court for the Southern District of California (Case No. 3:24-cv-00094-DMS-JLB) was settled for an immaterial amount.
Additionally, the Attorney General offices of various states, from time to time, conduct inquiries regarding the Company's inspection, reconditioning, advertising, sale, delivery, titling, registration, and post-sale service of retail vehicles. The Company works closely with government agencies to respond to these requests and fully cooperates with any such inquiries, which if not amicably resolved, have resulted and may again result in state Attorney General offices filing claims against the Company.
The Company believes the claims or counterclaims against the Company in the legal matters above are not material or are without merit, as may be applicable, and intends to defend the matters vigorously. As of December 31, 2024 and 2023, the Company has an accrual for unresolved legal matters, including, if applicable, those discussed above, of $10 million and $3 million, respectively. The accrual is classified in accounts payable and accrued expenses in the accompanying consolidated balance sheets and selling, general and administrative expenses in the accompanying statements of operations. If an unfavorable ruling or development were to occur, there exists the possibility of a material adverse impact on the Company's business, results of operations, financial condition, or cash flows.
Securities Class Action
On August 3, 2022, a putative class action complaint titled John Brent v. Carvana Co., et al. was filed in the United States District Court for the District of New Jersey against the Company and certain of the Company's executive officers. The complaint was filed on behalf of a purported class of stockholders and asserts violations of Section 10(b) and 20(a) of the Exchange Act and Rule 10b-5. The complaint sought unspecified damages and an award of fees, costs, and expenses. On September 29, 2022, a second putative class action complaint titled Rodeo Collection Ltd. v. Carvana Co., et al. was filed in the United States District Court for the District of New Jersey, alleging similar claims against the same defendants, and seeking the same form of relief. The two cases were then consolidated and subsequently transferred to the United States District Court for the District of Arizona (the "Arizona District Court") as In re Carvana Co. Securities Litigation, United States District Court for the District of Arizona (Case No. CV-22-2126-PHX-MTL). On February 14, 2023, a consolidated complaint was filed in the Arizona District Court, alleging new claims for violation of Section 20A of the Exchange Act and Sections 11, 12(a)(2), and 15 of the Securities Act of 1933, as amended (the "Securities Act"), and naming as new defendants certain Carvana directors, officers, and underwriters. The Arizona District Court granted the Company's motion to dismiss the consolidated complaint on February 29, 2024 and gave the plaintiff leave to file an amended complaint, which was filed on March 29, 2024. On December 16, 2024, the Company's motion to dismiss the consolidated complaint, as amended, was granted with respect to alleged violations of Section 20A of the Exchange Act and Section 12(a)(2) of the Securities Act, granted in part and denied in part with respect to alleged violations of Section 10(b) and Rule 10b-5 of the Exchange Act and Section 11 of the Securities Act, and denied with respect to alleged violations of Section 20(a) of the Exchange Act and Section 15 of the Securities Act. The Company intends to vigorously defend the remaining claims under this action in all respects. At this time, the Company is not
CARVANA CO. AND SUBSIDIARIES
NOTES TO CONSOLIDATED FINANCIAL STATEMENTS
(Continued)
in a position to assess the likelihood of any potential loss or adverse effect on its financial condition or to estimate the amount or range of potential losses, if any, from this action.
Future litigation may be necessary to defend the Company and its partners by determining the scope, enforceability and validity of third-party proprietary rights or to establish its proprietary rights. The results of any current or future litigation or government inquiries cannot be predicted with certainty, and regardless of the outcome, litigation and government inquiries can have an adverse impact on the Company because of defense and settlement costs, diversion of management resources, and other factors.
NOTE 18 — FAIR VALUE OF FINANCIAL INSTRUMENTS
The Company holds certain assets that are required to be measured at fair value on a recurring basis, and beneficial interests in securitizations for which it elected the fair value option. A description of the fair value hierarchy and the Company's methodologies are included in Note 2 — Summary of Significant Accounting Policies.
The following tables are a summary of fair value measurements and hierarchy level at December 31, 2024 and 2023:
| | | | | | | | | | | | | | | | | | | | | | | |
| December 31, 2024 |
| Carrying Value | | Level 1 | | Level 2 | | Level 3 |
| | | | | | | |
| (in millions) |
Assets: | | | | | | | |
Money market funds | $ | 1,154 | | | $ | 1,154 | | | $ | — | | | $ | — | |
Beneficial interests in securitizations | $ | 464 | | | $ | — | | | $ | — | | | $ | 464 | |
Purchase price adjustment receivables | $ | 2 | | | $ | — | | | $ | — | | | $ | 2 | |
Root Warrants | $ | 120 | | | $ | — | | | $ | — | | | $ | 120 | |
| | | | | | | |
| | | | | | | | | | | | | | | | | | | | | | | |
| December 31, 2023 |
| Carrying Value | | Level 1 | | Level 2 | | Level 3 |
| | | | | | | |
| (in millions) |
Assets: | | | | | | | |
Money market funds | $ | 339 | | | $ | 339 | | | $ | — | | | $ | — | |
| Beneficial interests in securitizations | $ | 366 | | | $ | — | | | $ | — | | | $ | 366 | |
Purchase price adjustment receivables | $ | 7 | | | $ | — | | | $ | — | | | $ | 7 | |
Root Warrants | $ | 5 | | | $ | — | | | $ | — | | | $ | 5 | |
| | | | | | | |
Money Market Funds
Money market funds consist of highly liquid investments with original maturities of three months or less and are classified in cash and cash equivalents and restricted cash in the accompanying consolidated balance sheets.
Beneficial Interests in Securitizations
Beneficial interests in securitizations include rated notes and certificates of the securitization trusts, the same securities as issued to other investors as described in Note 9 — Securitizations and Variable Interest Entities. Beneficial interests in securitizations are initially treated as Level 2 assets when the securitization transaction occurs in close proximity to the end of the period and there is a lack of observable changes in the economic inputs. When the securitization transaction does not occur in close proximity to the end of the period and there have been observable changes in the economic inputs, beneficial interests in securitizations are classified as Level 3.
The Company's beneficial interests in securitizations include rated notes and certificates and other assets, all of which are classified as Level 3 due to the lack of observable market data. The Company determines the fair value of its rated notes based
CARVANA CO. AND SUBSIDIARIES
NOTES TO CONSOLIDATED FINANCIAL STATEMENTS
(Continued)
on non-binding broker quotes. The non-binding broker quotes are based on models that consider the prevailing interest rates, recent market transactions, and current business conditions. The Company determines the fair value of its certificates and other assets using a combination of non-binding market quotes and internally developed discounted cash flow models. The discounted cash flow models use discount rates based on prevailing interest rates and the characteristics of the specific instruments. As of December 31, 2024 and 2023, the range of discount rates were 6.0% to 10.0% and 6.2% to 12.0%, respectively, and the weighted average of discount rates were 9.7% and 8.9%, respectively. Significant increases or decreases in the inputs to the models could result in a significantly higher or lower fair value measurement. The Company elected the fair value option on its beneficial interests in securitizations, which allows it to recognize changes in the fair value of these assets in the period the fair value changes. Changes in the fair value of the beneficial interests in securitizations are reflected in other (income) expense, net in the accompanying consolidated statements of operations.
For beneficial interests in securitizations measured at fair value on a recurring basis, the Company's transfers between levels of the fair value hierarchy are deemed to have occurred at the beginning of the reporting period on a quarterly basis. There were no transfers out of Level 3 during the years ended December 31, 2024 and 2023.
The Company sells certain of its beneficial interests in securitizations that are not required to be retained by the Risk Retention Rules. For the years ended December 31, 2024 and 2023, the Company sold beneficial interests in securitizations for a purchase price totaling $9 million and $13 million, respectively.
The following table presents additional information about Level 3 beneficial interests in securitizations measured at fair value on a recurring basis for the years ended December 31, 2024 and 2023:
| | | | | | | | | | | |
| Years Ended December 31, |
| 2024 | | 2023 |
| | | |
| (in millions) |
| Opening Balance | $ | 366 | | | $ | 321 | |
| | | |
| Received in securitization transactions | 272 | | | 194 | |
Payments received | (188) | | | (150) | |
| Change in fair value | 23 | | | 14 | |
| Sales of beneficial interests | (9) | | | (13) | |
| Ending Balance | $ | 464 | | | $ | 366 | |
Purchase Price Adjustment Receivables
The Company's purchase price adjustment receivables are carried at fair value and classified as other assets and other current assets in the accompanying consolidated balance sheets. Under the MPSA, the purchaser will make future cash payments to the Company based on the performance of the finance receivables sold. The fair value of the purchase price adjustment receivables are determined based on the extent to which the Company’s estimated performance of the underlying finance receivables exceeds a mutually agreed upon performance threshold of the underlying finance receivables as of measurement dates specified in the MPSA. The Company develops its estimate of future cumulative losses based on the historical performance of finance receivables it originated with similar characteristics as well as general macro-economic trends. The Company then utilizes a discounted cash flow model to calculate the present value of the expected future payment amounts. Due to the lack of observable market data these receivables are classified as Level 3. The adjustments to the fair value of the purchase price adjustment receivables were a loss of of less than $1 million and gain of $1 million during the years ended December 31, 2024 and 2023, respectively, and are reflected in other (income) expense, net in the accompanying consolidated statements of operations.
Root Warrants
In October 2021, the Company purchased Series A convertible preferred shares in Root, Inc. ("Root"), an equity security that does not have a readily determinable fair value. The Company elected to measure this investment using a measurement alternative pursuant to the accounting standards and recorded the investment at its cost of $126 million, which will subsequently be adjusted for observable price changes. The Company considered all relevant transactions since the date of its investment and has not recorded any impairments or upward or downward adjustments to the carrying amount of its investment in Root, as there have not been changes in the observable price of its equity interest through December 31, 2024.
CARVANA CO. AND SUBSIDIARIES
NOTES TO CONSOLIDATED FINANCIAL STATEMENTS
(Continued)
Also in October 2021, the Company entered into a commercial agreement with Root, under which the Root auto insurance products were to be embedded into the Company's e-commerce platform. In accordance with the provisions of the commercial agreement, the Company received eight tranches of warrants to purchase shares of Root's Class A common stock (the "Root Warrants"). On September 1, 2022, the integrated auto insurance solution, which embedded into the Company's e-commerce platform was completed. The first tranche of Root Warrants, consisting of 2.4 million shares of Root's Class A common stock, became exercisable upon completion of the integrated solution, and is considered a derivative instrument. The second tranche of Root Warrants, consisting of 3.2 million shares of Root's Class A common stock, became exercisable on November 14, 2023, and the third tranche, consisting of 1.6 million shares of Root's Class A common stock, became exercisable on May 3, 2024. Both the second and third tranche of the Root Warrants became exercisable upon the achievement of certain insurance sales metrics through the integrated solution, and are considered derivative investments. The other tranches vest based on a combination of the arrival of certain dates and further insurance product sales through the integrated solution and are considered derivative instruments. The Company used a Monte Carlo simulation to estimate the fair value of these Root Warrants, which are classified as Level 3. Under this Monte Carlo simulation, the primary unobservable input utilized in determining the fair value of the Root Warrants was the expected volatility of Root's class A common stock, which was implied from the historical volatility of their stock. As of December 31, 2024 and 2023, the expected volatility utilized in the Monte Carlo simulation was 100% and 85%, respectively.
At contract inception, the Company recognized an asset of $30 million for the Root Warrants and deferred revenue, classified in other assets and other liabilities, respectively in the accompanying consolidated balance sheets. In 2022, the Company determined it was probable that the volume of insurance products required to earn the Root Warrants would be achieved and recorded an additional $75 million of Root Warrants and deferred revenue based on the contract inception date fair value as determined by the Monte Carlo simulation. As of December 31, 2024 and 2023, the deferred revenue balance was $57 million and $78 million, respectively, and the Company recognized $21 million in Root Warrant revenue during each of the years ended December 31, 2024 and 2023, and $7 million during the year ended December 31, 2022. The Root Warrants and deferred revenue are classified in other assets and other liabilities, respectively, in the accompanying consolidated balance sheets. The deferred revenue is recognized over the expected contract performance period within other sales and revenues in the accompanying consolidated statements of operations.
The following table presents changes in the Company's Level 3 Root Warrants measured at fair value:
| | | | | | | | | | | |
| Years Ended December 31, |
| 2024 | | 2023 |
| | | |
| (in millions) |
Opening balance | $ | 5 | | | $ | 2 | |
| | | |
Unrealized gain | 115 | | | 3 | |
Ending balance | $ | 120 | | | $ | 5 | |
In relation to the Root Warrants, the Company recognized an increase in fair value of $115 million and $3 million during the years ended December 31, 2024 and 2023, respectively, which are included in other (income) expense, net in the accompanying consolidated statements of operations.
Interest Rate Caps
The Company utilizes non-designated cash flow hedges including interest rate cap agreements to minimize its exposure to interest rate fluctuations on variable rate debt borrowings. Interest rate caps provide that the counterparty will pay the purchaser at the end of each contractual period in which the index interest rate exceeds the contractually agreed upon cap rate.
During the year ended December 31, 2023, the Company entered into two interest rate cap agreements to limit exposure to interest rate risk on variable rate debt associated with finance receivables. The two interest rate caps each had cap rates of 5.0%, notional amounts of $364 million and $236 million, and expiry dates of July 2027 and April 2027, respectively.
The fair value of the Company's interest rate caps is impacted by the credit risk of both the Company and its counterparty. The Company has an agreement with its derivative financial instrument counterparty that contains provisions providing that if the Company defaults on the indebtedness associated with its derivative financial instrument, then the Company could also be
CARVANA CO. AND SUBSIDIARIES
NOTES TO CONSOLIDATED FINANCIAL STATEMENTS
(Continued)
declared in default on its derivative financial instrument obligation. In addition, the Company minimizes nonperformance risk on its derivative instrument by evaluating the creditworthiness of its counterparty, which is limited to major banks and financial institutions.
The Company does not apply hedge accounting to the interest rate caps and records all mark-to-market adjustments directly to other (income) expense, net in the accompanying consolidated statements of operations. The fair value of the interest rate caps is categorized as Level 2 in the fair value hierarchy as they are based on well-recognized financial principles and available market data. For the year ended December 31, 2023, the Company recognized mark-to-market adjustments of $2 million of expense within other (income) expense, net in the accompanying consolidated statements of operations. The interest rate caps were terminated during the year ended December 31, 2023.
Fair Value of Financial Instruments
The carrying amounts of restricted cash, accounts receivable, accounts payable and accrued liabilities, and accounts payable to related party approximate fair value due to their respective short-term maturities. The carrying value of the short-term revolving facilities were determined to approximate fair value due to their short-term duration and variable interest rates that approximate prevailing interest rates as of each reporting period. The carrying value of sale leasebacks were determined to approximate fair value as each of the transactions were entered into at prevailing interest rates during each respective period and they have not materially changed as of or during the years ended December 31, 2024 and 2023. The carrying value of the financing of beneficial interests in securitizations was determined to approximate fair value because in the event of a decline in the fair value of the pledged collateral of the financing, the repurchase price of the pledged collateral will be increased by the amount of the decline.
The fair value of the Senior Notes, which are not carried at fair value on the accompanying consolidated balance sheets, was determined using Level 2 inputs based on quoted market prices for the identical liability. The fair value of the Senior Notes as of December 31, 2024 and 2023 was as follows:
| | | | | | | | | | | |
| December 31, |
| 2024 | | 2023 |
| | | |
| (in millions) |
Carrying value, net of unamortized debt issuance costs, unamortized premium, and accrued PIK interest | $ | 4,549 | | | $ | 4,566 | |
| Fair value | $ | 5,050 | | | $ | 3,866 | |
The fair value of finance receivables, which are not carried at fair value on the accompanying consolidated balance sheets, was determined utilizing the estimated sales price based on the historical experience of the Company. Such fair value measurement of the finance receivables, net is considered Level 2 under the fair value hierarchy. The carrying value and fair value of the finance receivables as of December 31, 2024 and 2023 were as follows:
| | | | | | | | | | | |
| December 31, |
| 2024 | | 2023 |
| | | |
| (in millions) |
| Carrying value | $ | 612 | | | $ | 807 | |
| Fair value | $ | 670 | | | $ | 854 | |
CARVANA CO. AND SUBSIDIARIES
NOTES TO CONSOLIDATED FINANCIAL STATEMENTS
(Continued)
NOTE 19 — SUPPLEMENTAL CASH FLOW INFORMATION
The following table summarizes supplemental cash flow information for the years ended December 31, 2024, 2023, and 2022:
| | | | | | | | | | | | | | | | | |
| Years Ended December 31, |
| 2024 | | 2023 | | 2022 |
| | | | | |
| (in millions) |
| Supplemental cash flow information: | | | | | |
Cash payments for interest | $ | 115 | | | $ | 538 | | | $ | 423 | |
Cash payments for taxes | $ | 5 | | | $ | 28 | | | $ | 3 | |
| Non-cash investing and financing activities: | | | | | |
| | | | | |
| Capital expenditures included in accounts payable and accrued liabilities | $ | 1 | | | $ | 1 | | | $ | 18 | |
| Operating lease right-of-use assets obtained in exchange for operating lease liabilities | $ | 38 | | | $ | 2 | | | $ | 375 | |
| Property and equipment acquired under finance leases | $ | 1 | | | $ | 51 | | | $ | 326 | |
| Warrants to acquire Root Class A common stock | $ | — | | | $ | — | | | $ | 75 | |
| Equity-based compensation expense capitalized to property and equipment | $ | 9 | | | $ | 8 | | | $ | 8 | |
| | | | | |
| Fair value of beneficial interests received in securitization transactions | $ | 272 | | | $ | 194 | | | $ | 148 | |
| Reductions of beneficial interests in securitizations and associated long-term debt | $ | 130 | | | $ | 110 | | | $ | 134 | |
| | | | | |
| | | | | |
The following table provides a reconciliation of cash, cash equivalents and restricted cash reported within the accompanying consolidated balance sheets that sum to the total of the same amounts shown in the accompanying consolidated statements of cash flows for all periods presented:
| | | | | | | | | | | | | | | | | |
| December 31, |
| 2024 | | 2023 | | 2022 |
| | | | | |
| (in millions) |
| Cash and cash equivalents | $ | 1,716 | | | $ | 530 | | | $ | 434 | |
| Restricted cash | 44 | | | 64 | | | 194 | |
| Total cash, cash equivalents and restricted cash | $ | 1,760 | | | $ | 594 | | | $ | 628 | |
NOTE 20 — SUBSEQUENT EVENTS
Master Purchase and Sale Agreement
On January 3, 2025, the Company and the Ally Parties amended the MPSA to, among other things, reestablish the commitment by the Ally Parties to purchase up to $4.0 billion of principal balances of finance receivables between January 3, 2025 and January 2, 2026.
Finance Receivable Facilities
On January 15, 2025, the Company amended one of its agreements governing one of its short-term revolving credit facilities to, among other things, extend the maturity date to April 15, 2026.
CARVANA CO. AND SUBSIDIARIES
NOTES TO CONSOLIDATED FINANCIAL STATEMENTS
(Continued)
ATM Program
On February 19, 2025, the Company entered into a Second Amended and Restated Distribution Agreement (the "Second A&R Distribution Agreement") with Barclays Capital Inc., Citigroup Global Markets Inc., and Virtu Americas LLC to further refresh its ATM Program, whereby the Company may sell up to the greater of (i) a number of shares of Class A common stock representing an aggregate offering price of $1.0 billion or (ii) an aggregate of 21,016,898 shares of its Class A common stock, from time to time. In connection therewith, the Company intends to file a Registration Statement on Form S-3 on February 19, 2025 in connection with the offer and sale of shares contemplated by the Second A&R Distribution Agreement.
ITEM 9. CHANGES IN AND DISAGREEMENTS WITH ACCOUNTANTS ON ACCOUNTING AND FINANCIAL DISCLOSURE.
None.
ITEM 9A. CONTROLS AND PROCEDURES.
Evaluation of Disclosure Controls and Procedures
Under the supervision and with the participation of our management, including the chief executive officer and chief financial officer, we conducted an evaluation of the effectiveness of our disclosure controls and procedures (as such term is defined in Rules 13a-15(e) and 15d-15(e) under the Exchange Act) as of the end of the period covered by this report. Based on this evaluation, our chief executive officer and chief financial officer concluded that our disclosure controls and procedures were effective as of such date. Our disclosure controls and procedures are designed to ensure that information required to be disclosed in the reports we file or submit under the Exchange Act is recorded, processed, summarized and reported within the time periods specified in the SEC’s rules and forms and that such information is accumulated and communicated to management, including the chief executive officer and chief financial officer, to allow timely decisions regarding required disclosure.
Management's Annual Report on Internal Controls over Financial Reporting
Our management is responsible for establishing and maintaining adequate internal control over financial reporting (as defined in Rules 13a-15(f) and 15d-15(f) under the Exchange Act). Management conducted an evaluation of the effectiveness of our internal control over financial reporting based on the framework in Internal Control — Integrated Framework (2013) issued by the Committee of Sponsoring Organizations of the Treadway Commission. Based on the assessment, management has concluded that its internal control over financial reporting was effective as of December 31, 2024 to provide reasonable assurance regarding the reliability of financial reporting and the preparation of financial statements in accordance with GAAP. Our independent registered public accounting firm, Grant Thornton LLP, has issued an audit report with respect to our internal control over financial reporting, which appears in Part II, Item 8, "Financial Statements and Supplementary Data" of this Annual Report on Form 10-K.
Changes in Internal Controls Over Financial Reporting
There were no changes in our internal controls over financial reporting during the three months ended December 31, 2024 that have materially affected, or are reasonably likely to materially affect, our internal control over financial reporting.
Limitations of Effectiveness of Controls and Procedures and Internal Control over Financial Reporting
In designing and evaluating the disclosure controls and procedures and internal control over financial reporting, management recognizes that any controls and procedures, no matter how well designed and operated, can provide only reasonable assurance of achieving the desired control objectives. In addition, the design of disclosure controls and procedures and internal control over financial reporting must reflect the fact that there are resource constraints and that management is required to apply judgment in evaluating the benefits of possible controls and procedures relative to their costs.
ITEM 9B. OTHER INFORMATION.
Rule 10b5-1 Trading Plan Elections
On December 3, 2024, Tom Taira, the Company's President of Special Projects, entered into a trading plan intended to satisfy the affirmative defense conditions of Rule 10b5-1(c) under the Exchange Act (a "10b5-1 Plan"). Mr. Taira's 10b5-1 Plan provides for the potential sale of up to 128,471 shares of Class A common stock, including shares obtained through the exercise of vested stock options, between the first potential sale date on March 4, 2025 and the expiration of the 10b5-1 Plan on December 31, 2025.
On December 11, 2024, Daniel Gill, the Company's Chief Product Officer, terminated his previously disclosed 10b5-1 Plan, entered into on June 14, 2023. On December 13, 2024, Mr. Gill entered into a new 10b5-1 Plan, providing for the
potential sale of up to 515,166 shares of Class A common stock, including shares obtained through the exercise of vested stock options, between the first potential sale date on March 14, 2025, and the expiration of the 10b5-1 Plan on December 31, 2026.
On December 13, 2024, Benjamin Huston, the Company's Chief Operating Officer, modified a previously adopted 10b5-1 Plan. The previously adopted 10b5-1 Plan was entered into on March 16, 2021, was set to expire on December 31, 2024, and provided for the potential sale of up to approximately 499,973 shares of Class A common stock, including shares obtained from the conversion of Carvana Group, LLC Class B common units into shares of Class A common stock. Mr. Huston's modified 10b5-1 Plan provides for the potential sale of up to 608,495 shares of Class A common stock, including shares obtained through the exercise of vested stock options and shares obtained from the conversion of Carvana Group, LLC Class B common units into shares of Class A common stock, between the first potential sale date on March 14, 2025, and the expiration of the 10b5-1 Plan on December 31, 2026.
On December 13, 2024, Ernest Garcia III, the Company's Chief Executive Officer, entered into a 10b5-1 Plan providing for the potential sale of up to 1,000,000 shares of Class A common stock between the first potential sale date on March 14, 2025, and the expiration of the 10b5-1 Plan on March 16, 2026.
ATM Program
On February 19, 2025, the Company entered into a Second Amended and Restated Distribution Agreement (the "Second A&R Distribution Agreement") with Barclays Capital Inc., Citigroup Global Markets Inc., and Virtu Americas LLC to refresh its ATM program, whereby the Company may sell up to the greater of (i) a number of shares of Class A common stock representing an aggregate offering price of $1.0 billion or (ii) an aggregate of 21,016,898 shares of its Class A common stock, from time to time. In connection therewith, the Company intends to file a Registration Statement on Form S-3 on February 19, 2025 to register the offer and sale of the Class A common stock under the Second A&R Distribution Agreement.
The foregoing description of the Second A&R Distribution Agreement is not complete and is qualified in its entirety by reference to the Second A&R Distribution Agreement, a copy of which is attached to this Annual Report on Form 10-K as Exhibit 10.38 and incorporated by reference herein.
ITEM 9C. DISCLOSURE REGARDING FOREIGN JURISDICTIONS THAT PREVENT INSPECTIONS.
Not applicable.
PART III
ITEM 10. DIRECTORS, EXECUTIVE OFFICERS, AND CORPORATE GOVERNANCE.
The information required by this item is incorporated by reference to Carvana’s Proxy Statement for its 2025 Annual Meeting of Stockholders to be filed with the SEC within 120 days after the end of the fiscal year ended December 31, 2024.
ITEM 11. EXECUTIVE COMPENSATION.
The information required by this item is incorporated by reference to Carvana’s Proxy Statement for its 2025 Annual Meeting of Stockholders to be filed with the SEC within 120 days after the end of the fiscal year ended December 31, 2024.
ITEM 12. SECURITY OWNERSHIP OF CERTAIN BENEFICIAL OWNERS AND MANAGEMENT AND RELATED STOCKHOLDER MATTERS.
Securities Authorized for Issuance under Equity Incentive Plans
The following table provides information about our equity compensation plans under which our Class A common stock is authorized for issuance as of December 31, 2024:
| | | | | | | | | | | |
| Plan Category | Number of securities to be issued upon exercise of outstanding options (2) | Weighted-average exercise price of outstanding options (3) | Number of securities remaining available for future issuance under equity compensation plans (2)(4)(5) |
Equity compensation plans approved by security holders (1) | 4,327 | | $ | 35.60 | | 17,638 | |
Equity compensation plans not approved by security holders | — | | $ | — | | — | |
| Total | 4,327 | | $ | 35.60 | | 17,638 | |
(1) Includes awards granted and available for future issuance under our 2017 Omnibus Incentive Plan and offerings under our Employee Stock Purchase Plan ("ESPP"), which was approved in 2021. As of December 31, 2024, there were 17,637,779 shares of Class A common stock outstanding under our equity compensation plans, which includes 17,269,811 shares of Class A common stock outstanding under the 2017 Omnibus Incentive Plan and 367,968 shares of Class A common stock outstanding under the ESPP. The latest offering period under our ESPP ended on December 31, 2024.
(2) Presented in thousands.
(3) The weighted-average exercise price is calculated based solely on the exercise prices of the outstanding options and does not reflect the shares that will be issued upon the vesting of outstanding awards of RSUs, which have no exercise price.
(4) Consists of shares available under the ESPP and shares available under the 2017 Omnibus Incentive Plan. Includes 260,270 shares of Class A common stock issuable in respect of performance restricted stock units, representing the maximum number of shares that may be issued upon vesting if the maximum performance goal is achieved for the performance period.
(5) The number of shares authorized for issuance under the 2017 Omnibus Incentive Plan is subject to an automatic annual increase of the lesser of two percent of our outstanding common stock or an amount determined by the Compensation and Nominating Committee of our Board. The number of securities remaining available for future issuances under equity compensation plans does not include 2,665,416 shares added to the 2017 Omnibus Incentive Plan pursuant to the automatic annual increase on January 1, 2025.
The additional information required by this item is incorporated by reference to Carvana’s Proxy Statement for its 2025 Annual Meeting of Stockholders to be filed with the SEC within 120 days after the end of the fiscal year ended December 31, 2024.
ITEM 13. CERTAIN RELATIONSHIPS AND RELATED TRANSACTIONS, AND DIRECTOR INDEPENDENCE.
The information required by this item is incorporated by reference to Carvana’s Proxy Statement for its 2025 Annual Meeting of Stockholders to be filed with the SEC within 120 days after the end of the fiscal year ended December 31, 2024.
ITEM 14. PRINCIPAL ACCOUNTANT FEES AND SERVICES.
The information required by this item is incorporated by reference to Carvana’s Proxy Statement for its 2025 Annual Meeting of Stockholders to be filed with the SEC within 120 days after the end of the fiscal year ended December 31, 2024.
PART IV
ITEM 15. EXHIBIT AND FINANCIAL STATEMENT SCHEDULES.
| | | | | |
| 1. | Financial Statements: The Consolidated Financial Statements of Carvana are set forth in Part II, Item 8, "Financial Statements and Supplementary Data," of this Form 10-K. |
| 2. | Financial Statement Schedules: Schedule II - Valuation and Qualifying Accounts. |
Schedule II - Valuation and Qualifying Accounts | | | | | | | | | | | | | | | | | | | | | | | | | | | | | |
| | | Additions | | | | |
| Balance at beginning of period | | Charged to costs and expenses | | Charged to other accounts | | Reductions | | Balance at end of period |
| | | | | | | | | |
| (in millions) |
| Deferred tax asset valuation allowance: | | | | | | | | | |
| Year ended December 31, 2024 | $ | 1,962 | | | $ | (10) | | | $ | 289 | | (1) | $ | — | | | $ | 2,241 | |
| Year ended December 31, 2023 | $ | 2,058 | | | $ | (96) | | | $ | — | | (1) | $ | — | | | $ | 1,962 | |
| Year ended December 31, 2022 | $ | 1,638 | | | $ | 398 | | | $ | 22 | | (1) | $ | — | | | $ | 2,058 | |
(1) Amount relates to a valuation allowance established on deferred taxes related to our investment in Carvana Group.
All other financial statement schedules are not required or are not applicable, or the required information is shown in the consolidated financial statements or notes to the consolidated financial statements.
| | | | | |
| 3. | Exhibits: The exhibits listed in the accompanying Exhibit Index are filed, furnished or incorporated by reference as part of this Form 10-K. |
ITEM 16. FORM 10-K SUMMARY.
None.
EXHIBIT INDEX | | | | | |
| Exhibit No. | Description |
| |
| |
| |
| |
| |
| |
| |
| |
| |
| |
| |
| |
| |
| |
| |
| |
| |
| |
| |
| |
| |
| |
| |
| |
| |
| |
| |
| |
| |
| |
| |
| |
| |
| |
| |
| |
| |
| |
| |
| |
| |
| |
| |
| |
| |
| |
| |
| |
| |
| |
| |
| |
| |
| |
| |
| |
| |
| |
| |
| |
| |
| |
| |
| |
| |
| |
| |
| |
| |
| |
| |
| |
| |
| |
| |
| |
| |
| |
| |
| |
| |
| |
| |
| |
| |
| |
| |
| Third Addendum to the Master Dealer Agreement, effective April 19, 2021, among SilverRock Automotive, Inc., SilverRock Automotive of Florida, Inc., and Carvana, LLC,(incorporated by reference to Exhibit 10.4 to Carvana Co.'s Quarterly Report on Form 10-Q, filed with the SEC on May 6, 2021). |
| |
| |
| |
| |
| |
| |
| |
| |
| |
| |
| |
| |
| |
| |
| |
| |
| |
| |
| |
| |
| |
| |
| 101.INS | Inline XBRL Instance Document. |
| 101.SCH | Inline XBRL Taxonomy Extension Schema Document. |
| 101.CAL | Inline XBRL Taxonomy Extension Calculation Linkbase Document. |
| 101.LAB | Inline XBRL Taxonomy Extension Label Linkbase Document. |
| 101.PRE | Inline XBRL Taxonomy Extension Presentation Linkbase Document. |
| 101.DEF | Inline XBRL Taxonomy Extension Definition Linkbase Document. |
| 104 | Cover Page Interactive Data File - the cover page XBRL tags are embedded within the Inline XBRL document. |
| |
* Certain portions of this exhibit have been omitted in accordance with Item 601(b)(10)(iv) of Regulation S-K. The registrant agrees to furnish supplementally an unredacted copy of this exhibit to the U.S. Securities and Exchange Commission upon its request. |
† Indicates a management contract or compensatory plan or arrangement. |
SIGNATURES
Pursuant to the requirements of Section 13 or 15(d) of the Securities Exchange Act of 1934, the registrant has duly caused this report to be signed on its behalf by the undersigned, thereunto duly authorized.
| | | | | | | | | | | | | | |
| | | | |
| Date: | February 19, 2025 | Carvana Co. | |
| | | (Registrant) | |
| | | | |
| | By: | /s/ Ernest C. Garcia, III | |
| | | Ernest C. Garcia, III | |
| | | President, Chief Executive Officer and Chairman |
| | | February 19, 2025 |
Pursuant to the requirements of the Securities Exchange Act of 1934, this report has been signed below by the following persons on behalf of the registrant and in the capacities and on the dates indicated.
| | | | | | | | | | | | | | |
| Signature | | Title | | Date |
| | | | |
/s/ Ernest C. Garcia, III | | President, Chief Executive Officer, and Chairman (Principal Executive Officer) | | February 19, 2025 |
Ernest C. Garcia, III | | | | |
| | | | |
| /s/ Mark Jenkins | | Chief Financial Officer (Principal Financial Officer) | | February 19, 2025 |
| Mark Jenkins | | | | |
| | | | |
| /s/ Stephen Palmer | | Vice President of Accounting and Finance (Principal Accounting Officer) | | February 19, 2025 |
| Stephen Palmer | | | | |
| | | | |
| /s/ Michael Maroone | | Lead Director | | February 19, 2025 |
| Michael Maroone | | | | |
| | | | |
| /s/ Ira Platt | | Director | | February 19, 2025 |
| Ira Platt | | | | |
| | | | |
| /s/ Dan Quayle | | Director | | February 19, 2025 |
| Dan Quayle | | | | |
| | | | |
| /s/ Greg Sullivan | | Director | | February 19, 2025 |
| Greg Sullivan | | | | |
| | | | |
| /s/ Neha Parikh | | Director | | February 19, 2025 |
| Neha Parikh | | | | |