http://fasb.org/us-gaap/2023#SecuredDebthttp://fasb.org/us-gaap/2023#SecuredDebthttp://fasb.org/us-gaap/2023#OtherAssetshttp://fasb.org/us-gaap/2023#OtherCostAndExpenseOperatinghttp://fasb.org/us-gaap/2023#OtherCostAndExpenseOperatinghttp://fasb.org/us-gaap/2023#OtherCostAndExpenseOperatinghttp://fasb.org/us-gaap/2023#OtherCostAndExpenseOperatinghttp://fasb.org/us-gaap/2023#OtherCostAndExpenseOperatinghttp://fasb.org/us-gaap/2023#OtherCostAndExpenseOperatinghttp://fasb.org/us-gaap/2023#OtherCostAndExpenseOperatinghttp://fasb.org/us-gaap/2023#OtherCostAndExpenseOperatinghttp://fasb.org/us-gaap/2023#OtherCostAndExpenseOperatinghttp://fasb.org/us-gaap/2023#OtherCostAndExpenseOperatinghttp://fasb.org/us-gaap/2023#OtherCostAndExpenseOperatinghttp://fasb.org/us-gaap/2023#OtherCostAndExpenseOperatinghttp://fasb.org/us-gaap/2023#OtherCostAndExpenseOperatinghttp://fasb.org/us-gaap/2023#OtherCostAndExpenseOperatinghttp://fasb.org/us-gaap/2023#OtherCostAndExpenseOperatinghttp://fasb.org/us-gaap/2023#OtherCostAndExpenseOperatinghttp://fasb.org/us-gaap/2023#OtherCostAndExpenseOperatinghttp://fasb.org/us-gaap/2023#OtherCostAndExpenseOperatinghttp://fasb.org/us-gaap/2023#OtherCostAndExpenseOperatinghttp://fasb.org/us-gaap/2023#OtherCostAndExpenseOperatinghttp://fasb.org/us-gaap/2023#OtherCostAndExpenseOperatinghttp://fasb.org/us-gaap/2023#OtherCostAndExpenseOperatinghttp://fasb.org/us-gaap/2023#OtherCostAndExpenseOperatinghttp://fasb.org/us-gaap/2023#OtherCostAndExpenseOperatinghttp://fasb.org/us-gaap/2023#OtherCostAndExpenseOperatinghttp://fasb.org/us-gaap/2023#OtherCostAndExpenseOperatinghttp://fasb.org/us-gaap/2023#OtherCostAndExpenseOperatinghttp://fasb.org/us-gaap/2023#SecuredDebthttp://fasb.org/us-gaap/2023#SecuredDebthttp://fasb.org/us-gaap/2023#SecuredDebthttp://fasb.org/us-gaap/2023#SecuredDebthttp://fasb.org/us-gaap/2023#SecuredDebthttp://fasb.org/us-gaap/2023#SecuredDebthttp://www.deere.com/20240428#LongTermDebtAndFinanceLeasesNoncurrenthttp://fasb.org/us-gaap/2023#AccountsPayableAndAccruedLiabilitiesCurrentAndNoncurrenthttp://fasb.org/us-gaap/2023#AccountsPayableAndAccruedLiabilitiesCurrentAndNoncurrentDEERE & COhttp://fasb.org/us-gaap/2023#SecuredDebthttp://fasb.org/us-gaap/2023#OtherAssetsP6MP12MP12MP12MP12MP12MP24Mhttp://fasb.org/us-gaap/2023#OtherCostAndExpenseOperatinghttp://fasb.org/us-gaap/2023#OtherCostAndExpenseOperatinghttp://fasb.org/us-gaap/2023#OtherCostAndExpenseOperatinghttp://fasb.org/us-gaap/2023#OtherCostAndExpenseOperatinghttp://fasb.org/us-gaap/2023#OtherCostAndExpenseOperatinghttp://fasb.org/us-gaap/2023#OtherCostAndExpenseOperatinghttp://fasb.org/us-gaap/2023#OtherCostAndExpenseOperatinghttp://fasb.org/us-gaap/2023#OtherCostAndExpenseOperatinghttp://fasb.org/us-gaap/2023#OtherCostAndExpenseOperatinghttp://fasb.org/us-gaap/2023#AccountsPayableAndAccruedLiabilitiesCurrentAndNoncurrenthttp://www.deere.com/20240428#LongTermDebtAndFinanceLeasesNoncurrenthttp://www.deere.com/20240428#CorrectionOfTimingAndExpenseClassificationForPortionOfFinancialServicesIncentiveProgramsMember0000315189false--10-27Q20000315189us-gaap:TreasuryStockCommonMember2024-04-280000315189us-gaap:TreasuryStockCommonMember2024-01-280000315189us-gaap:TreasuryStockCommonMember2023-10-290000315189us-gaap:TreasuryStockCommonMember2023-04-300000315189us-gaap:TreasuryStockCommonMember2023-01-290000315189us-gaap:TreasuryStockCommonMember2022-10-300000315189us-gaap:RetainedEarningsMember2024-04-280000315189us-gaap:NoncontrollingInterestMember2024-04-280000315189us-gaap:CommonStockMember2024-04-280000315189us-gaap:RetainedEarningsMember2024-01-280000315189us-gaap:NoncontrollingInterestMember2024-01-280000315189us-gaap:CommonStockMember2024-01-280000315189us-gaap:AccumulatedOtherComprehensiveIncomeMember2024-01-280000315189us-gaap:RetainedEarningsMember2023-10-290000315189us-gaap:NoncontrollingInterestMember2023-10-290000315189us-gaap:CommonStockMember2023-10-290000315189us-gaap:RetainedEarningsMember2023-04-300000315189us-gaap:NoncontrollingInterestMember2023-04-300000315189us-gaap:CommonStockMember2023-04-300000315189us-gaap:RetainedEarningsMember2023-01-290000315189us-gaap:NoncontrollingInterestMember2023-01-290000315189us-gaap:CommonStockMember2023-01-290000315189us-gaap:AccumulatedOtherComprehensiveIncomeMember2023-01-290000315189us-gaap:RetainedEarningsMember2022-10-300000315189us-gaap:NoncontrollingInterestMember2022-10-300000315189us-gaap:CommonStockMember2022-10-300000315189us-gaap:AccumulatedOtherComprehensiveIncomeMember2022-10-300000315189us-gaap:AccumulatedTranslationAdjustmentMember2024-04-280000315189us-gaap:AccumulatedOtherComprehensiveIncomeMember2024-04-280000315189us-gaap:AccumulatedNetUnrealizedInvestmentGainLossMember2024-04-280000315189us-gaap:AccumulatedGainLossNetCashFlowHedgeParentMember2024-04-280000315189us-gaap:AccumulatedDefinedBenefitPlansAdjustmentMember2024-04-280000315189us-gaap:AccumulatedTranslationAdjustmentMember2023-10-290000315189us-gaap:AccumulatedOtherComprehensiveIncomeMember2023-10-290000315189us-gaap:AccumulatedNetUnrealizedInvestmentGainLossMember2023-10-290000315189us-gaap:AccumulatedGainLossNetCashFlowHedgeParentMember2023-10-290000315189us-gaap:AccumulatedDefinedBenefitPlansAdjustmentMember2023-10-290000315189us-gaap:AccumulatedTranslationAdjustmentMember2023-04-300000315189us-gaap:AccumulatedOtherComprehensiveIncomeMember2023-04-300000315189us-gaap:AccumulatedNetUnrealizedInvestmentGainLossMember2023-04-300000315189us-gaap:AccumulatedGainLossNetCashFlowHedgeParentMember2023-04-300000315189us-gaap:AccumulatedDefinedBenefitPlansAdjustmentMember2023-04-300000315189us-gaap:EmployeeStockOptionMember2024-04-280000315189us-gaap:EmployeeStockOptionMember2023-11-272023-12-240000315189de:RestrictedStockUnitsServiceBasedMember2023-10-302024-04-280000315189de:RestrictedStockUnitsPerformanceServiceBasedMember2023-10-302024-04-280000315189de:RestrictedStockUnitsMarketServiceBasedMember2023-10-302024-04-280000315189us-gaap:SecuredDebtMemberus-gaap:SubsequentEventMember2024-05-260000315189srt:LatinAmericaMemberde:SmallAgricultureAndTurfSegmentMember2024-01-292024-04-280000315189srt:LatinAmericaMemberde:ProductionAndPrecisionAgricultureSegmentMember2024-01-292024-04-280000315189srt:LatinAmericaMemberde:ConstructionAndForestrySegmentMember2024-01-292024-04-280000315189de:WesternEuropeMemberde:SmallAgricultureAndTurfSegmentMember2024-01-292024-04-280000315189de:WesternEuropeMemberde:ProductionAndPrecisionAgricultureSegmentMember2024-01-292024-04-280000315189de:WesternEuropeMemberde:ConstructionAndForestrySegmentMember2024-01-292024-04-280000315189de:SmallAgricultureAndTurfSegmentMemberus-gaap:TransferredOverTimeMember2024-01-292024-04-280000315189de:SmallAgricultureAndTurfSegmentMemberus-gaap:TransferredAtPointInTimeMember2024-01-292024-04-280000315189de:ProductionAndPrecisionAgricultureSegmentMemberus-gaap:TransferredOverTimeMember2024-01-292024-04-280000315189de:ProductionAndPrecisionAgricultureSegmentMemberus-gaap:TransferredAtPointInTimeMember2024-01-292024-04-280000315189de:ConstructionAndForestrySegmentMemberus-gaap:TransferredOverTimeMember2024-01-292024-04-280000315189de:ConstructionAndForestrySegmentMemberus-gaap:TransferredAtPointInTimeMember2024-01-292024-04-280000315189de:CentralEuropeAndCommonwealthOfIndependentStatesMemberde:SmallAgricultureAndTurfSegmentMember2024-01-292024-04-280000315189de:CentralEuropeAndCommonwealthOfIndependentStatesMemberde:ProductionAndPrecisionAgricultureSegmentMember2024-01-292024-04-280000315189de:CentralEuropeAndCommonwealthOfIndependentStatesMemberde:ConstructionAndForestrySegmentMember2024-01-292024-04-280000315189de:AsiaAfricaOceaniaAndMiddleEastMemberde:SmallAgricultureAndTurfSegmentMember2024-01-292024-04-280000315189de:AsiaAfricaOceaniaAndMiddleEastMemberde:ProductionAndPrecisionAgricultureSegmentMember2024-01-292024-04-280000315189de:AsiaAfricaOceaniaAndMiddleEastMemberde:ConstructionAndForestrySegmentMember2024-01-292024-04-280000315189country:USde:SmallAgricultureAndTurfSegmentMember2024-01-292024-04-280000315189country:USde:ProductionAndPrecisionAgricultureSegmentMember2024-01-292024-04-280000315189country:USde:ConstructionAndForestrySegmentMember2024-01-292024-04-280000315189country:CAde:SmallAgricultureAndTurfSegmentMember2024-01-292024-04-280000315189country:CAde:ProductionAndPrecisionAgricultureSegmentMember2024-01-292024-04-280000315189country:CAde:ConstructionAndForestrySegmentMember2024-01-292024-04-280000315189us-gaap:TransferredOverTimeMember2024-01-292024-04-280000315189us-gaap:TransferredAtPointInTimeMember2024-01-292024-04-280000315189us-gaap:FinancialServiceMember2024-01-292024-04-280000315189srt:LatinAmericaMember2024-01-292024-04-280000315189de:WesternEuropeMember2024-01-292024-04-280000315189de:SmallAgricultureAndTurfSegmentMember2024-01-292024-04-280000315189de:ProductionAndPrecisionAgricultureSegmentMember2024-01-292024-04-280000315189de:OtherMember2024-01-292024-04-280000315189de:ConstructionAndForestrySegmentMember2024-01-292024-04-280000315189de:CentralEuropeAndCommonwealthOfIndependentStatesMember2024-01-292024-04-280000315189de:AsiaAfricaOceaniaAndMiddleEastMember2024-01-292024-04-280000315189country:US2024-01-292024-04-280000315189country:CA2024-01-292024-04-280000315189srt:LatinAmericaMemberde:SmallAgricultureAndTurfSegmentMember2023-10-302024-04-280000315189srt:LatinAmericaMemberde:ProductionAndPrecisionAgricultureSegmentMember2023-10-302024-04-280000315189srt:LatinAmericaMemberde:ConstructionAndForestrySegmentMember2023-10-302024-04-280000315189de:WesternEuropeMemberde:SmallAgricultureAndTurfSegmentMember2023-10-302024-04-280000315189de:WesternEuropeMemberde:ProductionAndPrecisionAgricultureSegmentMember2023-10-302024-04-280000315189de:WesternEuropeMemberde:ConstructionAndForestrySegmentMember2023-10-302024-04-280000315189de:SmallAgricultureAndTurfSegmentMemberus-gaap:TransferredOverTimeMember2023-10-302024-04-280000315189de:SmallAgricultureAndTurfSegmentMemberus-gaap:TransferredAtPointInTimeMember2023-10-302024-04-280000315189de:ProductionAndPrecisionAgricultureSegmentMemberus-gaap:TransferredOverTimeMember2023-10-302024-04-280000315189de:ProductionAndPrecisionAgricultureSegmentMemberus-gaap:TransferredAtPointInTimeMember2023-10-302024-04-280000315189de:ConstructionAndForestrySegmentMemberus-gaap:TransferredOverTimeMember2023-10-302024-04-280000315189de:ConstructionAndForestrySegmentMemberus-gaap:TransferredAtPointInTimeMember2023-10-302024-04-280000315189de:CentralEuropeAndCommonwealthOfIndependentStatesMemberde:SmallAgricultureAndTurfSegmentMember2023-10-302024-04-280000315189de:CentralEuropeAndCommonwealthOfIndependentStatesMemberde:ProductionAndPrecisionAgricultureSegmentMember2023-10-302024-04-280000315189de:CentralEuropeAndCommonwealthOfIndependentStatesMemberde:ConstructionAndForestrySegmentMember2023-10-302024-04-280000315189de:AsiaAfricaOceaniaAndMiddleEastMemberde:SmallAgricultureAndTurfSegmentMember2023-10-302024-04-280000315189de:AsiaAfricaOceaniaAndMiddleEastMemberde:ProductionAndPrecisionAgricultureSegmentMember2023-10-302024-04-280000315189de:AsiaAfricaOceaniaAndMiddleEastMemberde:ConstructionAndForestrySegmentMember2023-10-302024-04-280000315189country:USde:SmallAgricultureAndTurfSegmentMember2023-10-302024-04-280000315189country:USde:ProductionAndPrecisionAgricultureSegmentMember2023-10-302024-04-280000315189country:USde:ConstructionAndForestrySegmentMember2023-10-302024-04-280000315189country:CAde:SmallAgricultureAndTurfSegmentMember2023-10-302024-04-280000315189country:CAde:ProductionAndPrecisionAgricultureSegmentMember2023-10-302024-04-280000315189country:CAde:ConstructionAndForestrySegmentMember2023-10-302024-04-280000315189us-gaap:TransferredOverTimeMember2023-10-302024-04-280000315189us-gaap:TransferredAtPointInTimeMember2023-10-302024-04-280000315189us-gaap:FinancialServiceMember2023-10-302024-04-280000315189srt:LatinAmericaMember2023-10-302024-04-280000315189de:WesternEuropeMember2023-10-302024-04-280000315189de:OtherMember2023-10-302024-04-280000315189de:CentralEuropeAndCommonwealthOfIndependentStatesMember2023-10-302024-04-280000315189de:AsiaAfricaOceaniaAndMiddleEastMember2023-10-302024-04-280000315189country:US2023-10-302024-04-280000315189country:CA2023-10-302024-04-280000315189srt:LatinAmericaMemberde:SmallAgricultureAndTurfSegmentMember2023-01-302023-04-300000315189srt:LatinAmericaMemberde:ProductionAndPrecisionAgricultureSegmentMember2023-01-302023-04-300000315189srt:LatinAmericaMemberde:ConstructionAndForestrySegmentMember2023-01-302023-04-300000315189de:WesternEuropeMemberde:SmallAgricultureAndTurfSegmentMember2023-01-302023-04-300000315189de:WesternEuropeMemberde:ProductionAndPrecisionAgricultureSegmentMember2023-01-302023-04-300000315189de:WesternEuropeMemberde:ConstructionAndForestrySegmentMember2023-01-302023-04-300000315189de:SmallAgricultureAndTurfSegmentMemberus-gaap:TransferredOverTimeMember2023-01-302023-04-300000315189de:SmallAgricultureAndTurfSegmentMemberus-gaap:TransferredAtPointInTimeMember2023-01-302023-04-300000315189de:ProductionAndPrecisionAgricultureSegmentMemberus-gaap:TransferredOverTimeMember2023-01-302023-04-300000315189de:ProductionAndPrecisionAgricultureSegmentMemberus-gaap:TransferredAtPointInTimeMember2023-01-302023-04-300000315189de:ConstructionAndForestrySegmentMemberus-gaap:TransferredOverTimeMember2023-01-302023-04-300000315189de:ConstructionAndForestrySegmentMemberus-gaap:TransferredAtPointInTimeMember2023-01-302023-04-300000315189de:CentralEuropeAndCommonwealthOfIndependentStatesMemberde:SmallAgricultureAndTurfSegmentMember2023-01-302023-04-300000315189de:CentralEuropeAndCommonwealthOfIndependentStatesMemberde:ProductionAndPrecisionAgricultureSegmentMember2023-01-302023-04-300000315189de:CentralEuropeAndCommonwealthOfIndependentStatesMemberde:ConstructionAndForestrySegmentMember2023-01-302023-04-300000315189de:AsiaAfricaOceaniaAndMiddleEastMemberde:SmallAgricultureAndTurfSegmentMember2023-01-302023-04-300000315189de:AsiaAfricaOceaniaAndMiddleEastMemberde:ProductionAndPrecisionAgricultureSegmentMember2023-01-302023-04-300000315189de:AsiaAfricaOceaniaAndMiddleEastMemberde:ConstructionAndForestrySegmentMember2023-01-302023-04-300000315189country:USde:SmallAgricultureAndTurfSegmentMember2023-01-302023-04-300000315189country:USde:ProductionAndPrecisionAgricultureSegmentMember2023-01-302023-04-300000315189country:USde:ConstructionAndForestrySegmentMember2023-01-302023-04-300000315189country:CAde:SmallAgricultureAndTurfSegmentMember2023-01-302023-04-300000315189country:CAde:ProductionAndPrecisionAgricultureSegmentMember2023-01-302023-04-300000315189country:CAde:ConstructionAndForestrySegmentMember2023-01-302023-04-300000315189us-gaap:TransferredOverTimeMember2023-01-302023-04-300000315189us-gaap:TransferredAtPointInTimeMember2023-01-302023-04-300000315189us-gaap:FinancialServiceMember2023-01-302023-04-300000315189srt:LatinAmericaMember2023-01-302023-04-300000315189de:WesternEuropeMember2023-01-302023-04-300000315189de:SmallAgricultureAndTurfSegmentMember2023-01-302023-04-300000315189de:ProductionAndPrecisionAgricultureSegmentMember2023-01-302023-04-300000315189de:OtherMember2023-01-302023-04-300000315189de:ConstructionAndForestrySegmentMember2023-01-302023-04-300000315189de:CentralEuropeAndCommonwealthOfIndependentStatesMember2023-01-302023-04-300000315189de:AsiaAfricaOceaniaAndMiddleEastMember2023-01-302023-04-300000315189country:US2023-01-302023-04-300000315189country:CA2023-01-302023-04-300000315189srt:LatinAmericaMemberde:SmallAgricultureAndTurfSegmentMember2022-10-312023-04-300000315189srt:LatinAmericaMemberde:ProductionAndPrecisionAgricultureSegmentMember2022-10-312023-04-300000315189srt:LatinAmericaMemberde:ConstructionAndForestrySegmentMember2022-10-312023-04-300000315189de:WesternEuropeMemberde:SmallAgricultureAndTurfSegmentMember2022-10-312023-04-300000315189de:WesternEuropeMemberde:ProductionAndPrecisionAgricultureSegmentMember2022-10-312023-04-300000315189de:WesternEuropeMemberde:ConstructionAndForestrySegmentMember2022-10-312023-04-300000315189de:SmallAgricultureAndTurfSegmentMemberus-gaap:TransferredOverTimeMember2022-10-312023-04-300000315189de:SmallAgricultureAndTurfSegmentMemberus-gaap:TransferredAtPointInTimeMember2022-10-312023-04-300000315189de:ProductionAndPrecisionAgricultureSegmentMemberus-gaap:TransferredOverTimeMember2022-10-312023-04-300000315189de:ProductionAndPrecisionAgricultureSegmentMemberus-gaap:TransferredAtPointInTimeMember2022-10-312023-04-300000315189de:ConstructionAndForestrySegmentMemberus-gaap:TransferredOverTimeMember2022-10-312023-04-300000315189de:ConstructionAndForestrySegmentMemberus-gaap:TransferredAtPointInTimeMember2022-10-312023-04-300000315189de:CentralEuropeAndCommonwealthOfIndependentStatesMemberde:SmallAgricultureAndTurfSegmentMember2022-10-312023-04-300000315189de:CentralEuropeAndCommonwealthOfIndependentStatesMemberde:ProductionAndPrecisionAgricultureSegmentMember2022-10-312023-04-300000315189de:CentralEuropeAndCommonwealthOfIndependentStatesMemberde:ConstructionAndForestrySegmentMember2022-10-312023-04-300000315189de:AsiaAfricaOceaniaAndMiddleEastMemberde:SmallAgricultureAndTurfSegmentMember2022-10-312023-04-300000315189de:AsiaAfricaOceaniaAndMiddleEastMemberde:ProductionAndPrecisionAgricultureSegmentMember2022-10-312023-04-300000315189de:AsiaAfricaOceaniaAndMiddleEastMemberde:ConstructionAndForestrySegmentMember2022-10-312023-04-300000315189country:USde:SmallAgricultureAndTurfSegmentMember2022-10-312023-04-300000315189country:USde:ProductionAndPrecisionAgricultureSegmentMember2022-10-312023-04-300000315189country:USde:ConstructionAndForestrySegmentMember2022-10-312023-04-300000315189country:CAde:SmallAgricultureAndTurfSegmentMember2022-10-312023-04-300000315189country:CAde:ProductionAndPrecisionAgricultureSegmentMember2022-10-312023-04-300000315189country:CAde:ConstructionAndForestrySegmentMember2022-10-312023-04-300000315189us-gaap:TransferredOverTimeMember2022-10-312023-04-300000315189us-gaap:TransferredAtPointInTimeMember2022-10-312023-04-300000315189us-gaap:FinancialServiceMember2022-10-312023-04-300000315189srt:LatinAmericaMember2022-10-312023-04-300000315189de:WesternEuropeMember2022-10-312023-04-300000315189de:OtherMember2022-10-312023-04-300000315189de:CentralEuropeAndCommonwealthOfIndependentStatesMember2022-10-312023-04-300000315189de:AsiaAfricaOceaniaAndMiddleEastMember2022-10-312023-04-300000315189country:US2022-10-312023-04-300000315189country:CA2022-10-312023-04-3000003151892029-10-292024-04-2800003151892028-10-302024-04-2800003151892024-04-292024-04-2800003151892027-11-012024-04-2800003151892026-11-022024-04-2800003151892025-11-032024-04-2800003151892024-10-282024-04-280000315189srt:LatinAmericaMemberde:FinancialServicesSegmentMember2024-01-292024-04-280000315189de:WesternEuropeMemberde:FinancialServicesSegmentMember2024-01-292024-04-280000315189de:FinancialServicesSegmentMemberus-gaap:TransferredOverTimeMember2024-01-292024-04-280000315189de:FinancialServicesSegmentMemberus-gaap:TransferredAtPointInTimeMember2024-01-292024-04-280000315189de:FinancialProductsMemberde:SmallAgricultureAndTurfSegmentMember2024-01-292024-04-280000315189de:FinancialProductsMemberde:ProductionAndPrecisionAgricultureSegmentMember2024-01-292024-04-280000315189de:FinancialProductsMemberde:FinancialServicesSegmentMember2024-01-292024-04-280000315189de:FinancialProductsMemberde:ConstructionAndForestrySegmentMember2024-01-292024-04-280000315189de:CentralEuropeAndCommonwealthOfIndependentStatesMemberde:FinancialServicesSegmentMember2024-01-292024-04-280000315189de:AsiaAfricaOceaniaAndMiddleEastMemberde:FinancialServicesSegmentMember2024-01-292024-04-280000315189country:USde:FinancialServicesSegmentMember2024-01-292024-04-280000315189country:CAde:FinancialServicesSegmentMember2024-01-292024-04-280000315189de:FinancialServicesSegmentMember2024-01-292024-04-280000315189de:FinancialProductsMember2024-01-292024-04-280000315189srt:LatinAmericaMemberde:FinancialServicesSegmentMember2023-10-302024-04-280000315189de:WesternEuropeMemberde:FinancialServicesSegmentMember2023-10-302024-04-280000315189de:FinancialServicesSegmentMemberus-gaap:TransferredOverTimeMember2023-10-302024-04-280000315189de:FinancialServicesSegmentMemberus-gaap:TransferredAtPointInTimeMember2023-10-302024-04-280000315189de:FinancialProductsMemberde:SmallAgricultureAndTurfSegmentMember2023-10-302024-04-280000315189de:FinancialProductsMemberde:ProductionAndPrecisionAgricultureSegmentMember2023-10-302024-04-280000315189de:FinancialProductsMemberde:FinancialServicesSegmentMember2023-10-302024-04-280000315189de:FinancialProductsMemberde:ConstructionAndForestrySegmentMember2023-10-302024-04-280000315189de:CentralEuropeAndCommonwealthOfIndependentStatesMemberde:FinancialServicesSegmentMember2023-10-302024-04-280000315189de:AsiaAfricaOceaniaAndMiddleEastMemberde:FinancialServicesSegmentMember2023-10-302024-04-280000315189country:USde:FinancialServicesSegmentMember2023-10-302024-04-280000315189country:CAde:FinancialServicesSegmentMember2023-10-302024-04-280000315189de:FinancialServicesSegmentMember2023-10-302024-04-280000315189de:FinancialProductsMember2023-10-302024-04-280000315189srt:LatinAmericaMemberde:FinancialServicesSegmentMember2023-01-302023-04-300000315189de:WesternEuropeMemberde:FinancialServicesSegmentMember2023-01-302023-04-300000315189de:FinancialServicesSegmentMemberus-gaap:TransferredOverTimeMember2023-01-302023-04-300000315189de:FinancialServicesSegmentMemberus-gaap:TransferredAtPointInTimeMember2023-01-302023-04-300000315189de:FinancialProductsMemberde:SmallAgricultureAndTurfSegmentMember2023-01-302023-04-300000315189de:FinancialProductsMemberde:ProductionAndPrecisionAgricultureSegmentMember2023-01-302023-04-300000315189de:FinancialProductsMemberde:FinancialServicesSegmentMember2023-01-302023-04-300000315189de:FinancialProductsMemberde:ConstructionAndForestrySegmentMember2023-01-302023-04-300000315189de:CentralEuropeAndCommonwealthOfIndependentStatesMemberde:FinancialServicesSegmentMember2023-01-302023-04-300000315189de:AsiaAfricaOceaniaAndMiddleEastMemberde:FinancialServicesSegmentMember2023-01-302023-04-300000315189country:USde:FinancialServicesSegmentMember2023-01-302023-04-300000315189country:CAde:FinancialServicesSegmentMember2023-01-302023-04-300000315189de:FinancialServicesSegmentMember2023-01-302023-04-300000315189de:FinancialProductsMember2023-01-302023-04-300000315189srt:LatinAmericaMemberde:FinancialServicesSegmentMember2022-10-312023-04-300000315189de:WesternEuropeMemberde:FinancialServicesSegmentMember2022-10-312023-04-300000315189de:FinancialServicesSegmentMemberus-gaap:TransferredOverTimeMember2022-10-312023-04-300000315189de:FinancialServicesSegmentMemberus-gaap:TransferredAtPointInTimeMember2022-10-312023-04-300000315189de:FinancialProductsMemberde:SmallAgricultureAndTurfSegmentMember2022-10-312023-04-300000315189de:FinancialProductsMemberde:ProductionAndPrecisionAgricultureSegmentMember2022-10-312023-04-300000315189de:FinancialProductsMemberde:FinancialServicesSegmentMember2022-10-312023-04-300000315189de:FinancialProductsMemberde:ConstructionAndForestrySegmentMember2022-10-312023-04-300000315189de:CentralEuropeAndCommonwealthOfIndependentStatesMemberde:FinancialServicesSegmentMember2022-10-312023-04-300000315189de:AsiaAfricaOceaniaAndMiddleEastMemberde:FinancialServicesSegmentMember2022-10-312023-04-300000315189country:USde:FinancialServicesSegmentMember2022-10-312023-04-300000315189country:CAde:FinancialServicesSegmentMember2022-10-312023-04-300000315189de:FinancialServicesSegmentMember2022-10-312023-04-300000315189de:FinancialProductsMember2022-10-312023-04-300000315189de:TurfMemberde:SmallAgricultureAndTurfSegmentMember2024-01-292024-04-280000315189de:SmallAgricultureMemberde:SmallAgricultureAndTurfSegmentMember2024-01-292024-04-280000315189de:RoadbuildingMemberde:ConstructionAndForestrySegmentMember2024-01-292024-04-280000315189de:ProductionAgricultureMemberde:ProductionAndPrecisionAgricultureSegmentMember2024-01-292024-04-280000315189de:ForestryMemberde:ConstructionAndForestrySegmentMember2024-01-292024-04-280000315189de:ConstructionEquipmentMemberde:ConstructionAndForestrySegmentMember2024-01-292024-04-280000315189de:CompactConstructionEquipmentMemberde:ConstructionAndForestrySegmentMember2024-01-292024-04-280000315189de:TurfMember2024-01-292024-04-280000315189de:SmallAgricultureMember2024-01-292024-04-280000315189de:RoadbuildingMember2024-01-292024-04-280000315189de:ProductionAgricultureMember2024-01-292024-04-280000315189de:ForestryMember2024-01-292024-04-280000315189de:ConstructionEquipmentMember2024-01-292024-04-280000315189de:CompactConstructionEquipmentMember2024-01-292024-04-280000315189de:TurfMemberde:SmallAgricultureAndTurfSegmentMember2023-10-302024-04-280000315189de:SmallAgricultureMemberde:SmallAgricultureAndTurfSegmentMember2023-10-302024-04-280000315189de:RoadbuildingMemberde:ConstructionAndForestrySegmentMember2023-10-302024-04-280000315189de:ProductionAgricultureMemberde:ProductionAndPrecisionAgricultureSegmentMember2023-10-302024-04-280000315189de:ForestryMemberde:ConstructionAndForestrySegmentMember2023-10-302024-04-280000315189de:ConstructionEquipmentMemberde:ConstructionAndForestrySegmentMember2023-10-302024-04-280000315189de:CompactConstructionEquipmentMemberde:ConstructionAndForestrySegmentMember2023-10-302024-04-280000315189de:TurfMember2023-10-302024-04-280000315189de:SmallAgricultureMember2023-10-302024-04-280000315189de:RoadbuildingMember2023-10-302024-04-280000315189de:ProductionAgricultureMember2023-10-302024-04-280000315189de:ForestryMember2023-10-302024-04-280000315189de:ConstructionEquipmentMember2023-10-302024-04-280000315189de:CompactConstructionEquipmentMember2023-10-302024-04-280000315189us-gaap:OperatingSegmentsMemberus-gaap:ProductMemberde:SmallAgricultureAndTurfSegmentMember2023-01-302023-04-300000315189us-gaap:OperatingSegmentsMemberus-gaap:ProductMemberde:ProductionAndPrecisionAgricultureSegmentMember2023-01-302023-04-300000315189us-gaap:OperatingSegmentsMemberus-gaap:ProductMemberde:ConstructionAndForestrySegmentMember2023-01-302023-04-300000315189de:TurfMemberde:SmallAgricultureAndTurfSegmentMember2023-01-302023-04-300000315189de:SmallAgricultureMemberde:SmallAgricultureAndTurfSegmentMember2023-01-302023-04-300000315189de:RoadbuildingMemberde:ConstructionAndForestrySegmentMember2023-01-302023-04-300000315189de:ProductionAgricultureMemberde:ProductionAndPrecisionAgricultureSegmentMember2023-01-302023-04-300000315189de:ForestryMemberde:ConstructionAndForestrySegmentMember2023-01-302023-04-300000315189de:ConstructionEquipmentMemberde:ConstructionAndForestrySegmentMember2023-01-302023-04-300000315189de:CompactConstructionEquipmentMemberde:ConstructionAndForestrySegmentMember2023-01-302023-04-300000315189de:TurfMember2023-01-302023-04-300000315189de:SmallAgricultureMember2023-01-302023-04-300000315189de:RoadbuildingMember2023-01-302023-04-300000315189de:ProductionAgricultureMember2023-01-302023-04-300000315189de:ForestryMember2023-01-302023-04-300000315189de:ConstructionEquipmentMember2023-01-302023-04-300000315189de:CompactConstructionEquipmentMember2023-01-302023-04-300000315189us-gaap:OperatingSegmentsMemberus-gaap:ProductMemberde:SmallAgricultureAndTurfSegmentMember2022-10-312023-04-300000315189us-gaap:OperatingSegmentsMemberus-gaap:ProductMemberde:ProductionAndPrecisionAgricultureSegmentMember2022-10-312023-04-300000315189us-gaap:OperatingSegmentsMemberus-gaap:ProductMemberde:ConstructionAndForestrySegmentMember2022-10-312023-04-300000315189de:TurfMemberde:SmallAgricultureAndTurfSegmentMember2022-10-312023-04-300000315189de:SmallAgricultureMemberde:SmallAgricultureAndTurfSegmentMember2022-10-312023-04-300000315189de:RoadbuildingMemberde:ConstructionAndForestrySegmentMember2022-10-312023-04-300000315189de:ProductionAgricultureMemberde:ProductionAndPrecisionAgricultureSegmentMember2022-10-312023-04-300000315189de:ForestryMemberde:ConstructionAndForestrySegmentMember2022-10-312023-04-300000315189de:ConstructionEquipmentMemberde:ConstructionAndForestrySegmentMember2022-10-312023-04-300000315189de:CompactConstructionEquipmentMemberde:ConstructionAndForestrySegmentMember2022-10-312023-04-300000315189de:TurfMember2022-10-312023-04-300000315189de:SmallAgricultureMember2022-10-312023-04-300000315189de:RoadbuildingMember2022-10-312023-04-300000315189de:ProductionAgricultureMember2022-10-312023-04-300000315189de:ForestryMember2022-10-312023-04-300000315189de:ConstructionEquipmentMember2022-10-312023-04-300000315189de:CompactConstructionEquipmentMember2022-10-312023-04-300000315189us-gaap:DisposalGroupDisposedOfBySaleNotDiscontinuedOperationsMemberde:SaleOfFinancialServicesBusinessInRussiaMemberde:FinancialServicesSegmentMember2023-03-072023-03-070000315189us-gaap:ReclassificationOutOfAccumulatedOtherComprehensiveIncomeMemberus-gaap:AccumulatedNetUnrealizedInvestmentGainLossMember2023-10-302024-04-280000315189us-gaap:ReclassificationOutOfAccumulatedOtherComprehensiveIncomeMemberus-gaap:AccumulatedDefinedBenefitPlansAdjustmentNetUnamortizedGainLossMember2024-01-292024-04-280000315189us-gaap:ReclassificationOutOfAccumulatedOtherComprehensiveIncomeMemberus-gaap:AccumulatedDefinedBenefitPlansAdjustmentNetPriorServiceCostCreditMember2024-01-292024-04-280000315189us-gaap:ReclassificationOutOfAccumulatedOtherComprehensiveIncomeMemberde:AccumulatedDefinedBenefitPlansAdjustmentNetSettlementsMember2024-01-292024-04-280000315189us-gaap:ReclassificationOutOfAccumulatedOtherComprehensiveIncomeMemberus-gaap:AccumulatedDefinedBenefitPlansAdjustmentNetUnamortizedGainLossMember2023-10-302024-04-280000315189us-gaap:ReclassificationOutOfAccumulatedOtherComprehensiveIncomeMemberus-gaap:AccumulatedDefinedBenefitPlansAdjustmentNetPriorServiceCostCreditMember2023-10-302024-04-280000315189us-gaap:ReclassificationOutOfAccumulatedOtherComprehensiveIncomeMemberde:AccumulatedDefinedBenefitPlansAdjustmentNetSettlementsMember2023-10-302024-04-280000315189us-gaap:ReclassificationOutOfAccumulatedOtherComprehensiveIncomeMemberus-gaap:AccumulatedDefinedBenefitPlansAdjustmentNetUnamortizedGainLossMember2023-01-302023-04-300000315189us-gaap:ReclassificationOutOfAccumulatedOtherComprehensiveIncomeMemberus-gaap:AccumulatedDefinedBenefitPlansAdjustmentNetPriorServiceCostCreditMember2023-01-302023-04-300000315189us-gaap:ReclassificationOutOfAccumulatedOtherComprehensiveIncomeMemberde:AccumulatedDefinedBenefitPlansAdjustmentNetSettlementsMember2023-01-302023-04-300000315189us-gaap:ReclassificationOutOfAccumulatedOtherComprehensiveIncomeMemberus-gaap:AccumulatedDefinedBenefitPlansAdjustmentNetUnamortizedGainLossMember2022-10-312023-04-300000315189us-gaap:ReclassificationOutOfAccumulatedOtherComprehensiveIncomeMemberus-gaap:AccumulatedDefinedBenefitPlansAdjustmentNetPriorServiceCostCreditMember2022-10-312023-04-300000315189us-gaap:ReclassificationOutOfAccumulatedOtherComprehensiveIncomeMemberde:AccumulatedDefinedBenefitPlansAdjustmentNetSettlementsMember2022-10-312023-04-300000315189us-gaap:AccumulatedOtherComprehensiveIncomeMember2024-01-292024-04-280000315189us-gaap:AccumulatedOtherComprehensiveIncomeMember2023-10-302024-04-280000315189us-gaap:AccumulatedOtherComprehensiveIncomeMember2023-01-302023-04-300000315189us-gaap:AccumulatedOtherComprehensiveIncomeMember2022-10-312023-04-300000315189us-gaap:InterestRateSwapMember2024-01-292024-04-280000315189us-gaap:InterestRateSwapMember2023-10-302024-04-280000315189us-gaap:InterestRateSwapMember2023-01-302023-04-300000315189us-gaap:InterestRateSwapMember2022-10-312023-04-300000315189us-gaap:AccumulatedTranslationAdjustmentMember2024-01-292024-04-280000315189us-gaap:AccumulatedTranslationAdjustmentMember2023-10-302024-04-280000315189us-gaap:AccumulatedTranslationAdjustmentMember2023-01-302023-04-300000315189us-gaap:AccumulatedTranslationAdjustmentMember2022-10-312023-04-300000315189us-gaap:OperatingSegmentsMemberde:ConstructionAndForestrySegmentMember2023-01-302023-04-300000315189us-gaap:OperatingSegmentsMember2023-01-302023-04-300000315189us-gaap:OperatingSegmentsMemberde:ConstructionAndForestrySegmentMember2022-10-312023-04-300000315189us-gaap:OperatingSegmentsMember2022-10-312023-04-300000315189us-gaap:AccumulatedNetUnrealizedInvestmentGainLossMember2024-01-292024-04-280000315189us-gaap:AccumulatedGainLossNetCashFlowHedgeParentMember2024-01-292024-04-280000315189us-gaap:AccumulatedDefinedBenefitPlansAdjustmentMember2024-01-292024-04-280000315189us-gaap:AccumulatedNetUnrealizedInvestmentGainLossMember2023-10-302024-04-280000315189us-gaap:AccumulatedGainLossNetCashFlowHedgeParentMember2023-10-302024-04-280000315189us-gaap:AccumulatedDefinedBenefitPlansAdjustmentMember2023-10-302024-04-280000315189us-gaap:AccumulatedNetUnrealizedInvestmentGainLossMember2023-01-302023-04-300000315189us-gaap:AccumulatedGainLossNetCashFlowHedgeParentMember2023-01-302023-04-300000315189us-gaap:AccumulatedDefinedBenefitPlansAdjustmentMember2023-01-302023-04-300000315189us-gaap:AccumulatedNetUnrealizedInvestmentGainLossMember2022-10-312023-04-300000315189us-gaap:AccumulatedGainLossNetCashFlowHedgeParentMember2022-10-312023-04-300000315189us-gaap:AccumulatedDefinedBenefitPlansAdjustmentMember2022-10-312023-04-300000315189us-gaap:FairValueInputsLevel2Memberus-gaap:FairValueMeasurementsRecurringMemberus-gaap:USStatesAndPoliticalSubdivisionsMember2024-04-280000315189us-gaap:FairValueInputsLevel2Memberus-gaap:FairValueMeasurementsRecurringMemberus-gaap:USGovernmentDebtSecuritiesMember2024-04-280000315189us-gaap:FairValueInputsLevel2Memberus-gaap:FairValueMeasurementsRecurringMemberus-gaap:MortgageBackedSecuritiesMember2024-04-280000315189us-gaap:FairValueInputsLevel2Memberus-gaap:FairValueMeasurementsRecurringMemberus-gaap:CorporateDebtSecuritiesMember2024-04-280000315189us-gaap:FairValueInputsLevel2Memberus-gaap:FairValueMeasurementsRecurringMemberde:ForeignDebtSecuritiesMember2024-04-280000315189us-gaap:FairValueInputsLevel1Memberus-gaap:FairValueMeasurementsRecurringMemberus-gaap:USGovernmentDebtSecuritiesMember2024-04-280000315189us-gaap:FairValueInputsLevel1Memberus-gaap:FairValueMeasurementsRecurringMemberde:ForeignEquitySecuritiesMember2024-04-280000315189us-gaap:FairValueInputsLevel1Memberus-gaap:FairValueMeasurementsRecurringMemberde:FixedIncomeFundsUSMember2024-04-280000315189us-gaap:FairValueInputsLevel1Memberus-gaap:FairValueMeasurementsRecurringMemberde:EquityFundsUSMember2024-04-280000315189us-gaap:FairValueInputsLevel2Memberus-gaap:FairValueMeasurementsRecurringMember2024-04-280000315189us-gaap:FairValueInputsLevel1Memberus-gaap:FairValueMeasurementsRecurringMember2024-04-280000315189us-gaap:FairValueInputsLevel2Memberus-gaap:FairValueMeasurementsRecurringMemberus-gaap:USStatesAndPoliticalSubdivisionsMember2023-10-290000315189us-gaap:FairValueInputsLevel2Memberus-gaap:FairValueMeasurementsRecurringMemberus-gaap:USGovernmentDebtSecuritiesMember2023-10-290000315189us-gaap:FairValueInputsLevel2Memberus-gaap:FairValueMeasurementsRecurringMemberus-gaap:MortgageBackedSecuritiesMember2023-10-290000315189us-gaap:FairValueInputsLevel2Memberus-gaap:FairValueMeasurementsRecurringMemberus-gaap:CorporateDebtSecuritiesMember2023-10-290000315189us-gaap:FairValueInputsLevel2Memberus-gaap:FairValueMeasurementsRecurringMemberde:ForeignDebtSecuritiesMember2023-10-290000315189us-gaap:FairValueInputsLevel1Memberus-gaap:FairValueMeasurementsRecurringMemberus-gaap:USGovernmentDebtSecuritiesMember2023-10-290000315189us-gaap:FairValueInputsLevel1Memberus-gaap:FairValueMeasurementsRecurringMemberde:ForeignMutualFundsSecuritiesMember2023-10-290000315189us-gaap:FairValueInputsLevel1Memberus-gaap:FairValueMeasurementsRecurringMemberde:ForeignEquitySecuritiesMember2023-10-290000315189us-gaap:FairValueInputsLevel1Memberus-gaap:FairValueMeasurementsRecurringMemberde:FixedIncomeFundsUSMember2023-10-290000315189us-gaap:FairValueInputsLevel1Memberus-gaap:FairValueMeasurementsRecurringMemberde:EquityFundsUSMember2023-10-290000315189us-gaap:FairValueInputsLevel2Memberus-gaap:FairValueMeasurementsRecurringMember2023-10-290000315189us-gaap:FairValueInputsLevel1Memberus-gaap:FairValueMeasurementsRecurringMember2023-10-290000315189us-gaap:FairValueInputsLevel2Memberus-gaap:FairValueMeasurementsRecurringMemberus-gaap:USStatesAndPoliticalSubdivisionsMember2023-04-300000315189us-gaap:FairValueInputsLevel2Memberus-gaap:FairValueMeasurementsRecurringMemberus-gaap:USGovernmentDebtSecuritiesMember2023-04-300000315189us-gaap:FairValueInputsLevel2Memberus-gaap:FairValueMeasurementsRecurringMemberus-gaap:MortgageBackedSecuritiesMember2023-04-300000315189us-gaap:FairValueInputsLevel2Memberus-gaap:FairValueMeasurementsRecurringMemberus-gaap:CorporateDebtSecuritiesMember2023-04-300000315189us-gaap:FairValueInputsLevel2Memberus-gaap:FairValueMeasurementsRecurringMemberde:ForeignDebtSecuritiesMember2023-04-300000315189us-gaap:FairValueInputsLevel1Memberus-gaap:FairValueMeasurementsRecurringMemberus-gaap:USGovernmentDebtSecuritiesMember2023-04-300000315189us-gaap:FairValueInputsLevel1Memberus-gaap:FairValueMeasurementsRecurringMemberde:ForeignMutualFundsSecuritiesMember2023-04-300000315189us-gaap:FairValueInputsLevel1Memberus-gaap:FairValueMeasurementsRecurringMemberde:ForeignEquitySecuritiesMember2023-04-300000315189us-gaap:FairValueInputsLevel1Memberus-gaap:FairValueMeasurementsRecurringMemberde:FixedIncomeFundsUSMember2023-04-300000315189us-gaap:FairValueInputsLevel1Memberus-gaap:FairValueMeasurementsRecurringMemberde:EquityFundsUSMember2023-04-300000315189us-gaap:FairValueInputsLevel2Memberus-gaap:FairValueMeasurementsRecurringMember2023-04-300000315189us-gaap:FairValueInputsLevel1Memberus-gaap:FairValueMeasurementsRecurringMember2023-04-300000315189us-gaap:FairValueInputsLevel2Member2024-04-280000315189us-gaap:CarryingReportedAmountFairValueDisclosureMember2024-04-280000315189us-gaap:FairValueInputsLevel2Member2023-10-290000315189us-gaap:CarryingReportedAmountFairValueDisclosureMember2023-10-290000315189us-gaap:FairValueInputsLevel2Member2023-04-300000315189us-gaap:CarryingReportedAmountFairValueDisclosureMember2023-04-300000315189us-gaap:InterestRateSwapMemberus-gaap:ReclassificationOutOfAccumulatedOtherComprehensiveIncomeMemberus-gaap:AccumulatedGainLossNetCashFlowHedgeParentMember2024-01-292024-04-280000315189us-gaap:InterestRateSwapMemberus-gaap:ReclassificationOutOfAccumulatedOtherComprehensiveIncomeMemberus-gaap:AccumulatedGainLossNetCashFlowHedgeParentMember2023-10-302024-04-280000315189us-gaap:InterestRateSwapMemberus-gaap:ReclassificationOutOfAccumulatedOtherComprehensiveIncomeMemberus-gaap:AccumulatedGainLossNetCashFlowHedgeParentMember2023-01-302023-04-300000315189us-gaap:InterestRateSwapMemberus-gaap:ReclassificationOutOfAccumulatedOtherComprehensiveIncomeMemberus-gaap:AccumulatedGainLossNetCashFlowHedgeParentMember2022-10-312023-04-300000315189us-gaap:InterestRateSwapMemberus-gaap:FairValueHedgingMember2023-10-290000315189us-gaap:InterestRateSwapMemberus-gaap:FairValueHedgingMember2023-04-300000315189us-gaap:FinancialGuaranteeMember2024-04-280000315189de:SmallAgricultureAndTurfSegmentMember2023-10-302024-04-280000315189de:ProductionAndPrecisionAgricultureSegmentMember2023-10-302024-04-280000315189de:ConstructionAndForestrySegmentMember2023-10-302024-04-280000315189de:SmallAgricultureAndTurfSegmentMember2022-10-312023-04-300000315189de:ConstructionAndForestrySegmentMember2022-10-312023-04-300000315189de:ProductionAndPrecisionAgricultureSegmentMember2022-10-312023-04-300000315189de:SmallAgricultureAndTurfSegmentMember2024-04-280000315189de:ProductionAndPrecisionAgricultureSegmentMember2024-04-280000315189de:ConstructionAndForestrySegmentMember2024-04-280000315189de:SmallAgricultureAndTurfSegmentMember2023-10-290000315189de:ProductionAndPrecisionAgricultureSegmentMember2023-10-290000315189de:ConstructionAndForestrySegmentMember2023-10-290000315189de:SmallAgricultureAndTurfSegmentMember2023-04-300000315189de:ProductionAndPrecisionAgricultureSegmentMember2023-04-300000315189de:ConstructionAndForestrySegmentMember2023-04-300000315189de:SmallAgricultureAndTurfSegmentMember2022-10-300000315189de:ProductionAndPrecisionAgricultureSegmentMember2022-10-300000315189de:ConstructionAndForestrySegmentMember2022-10-300000315189us-gaap:OtherIntangibleAssetsMember2024-04-280000315189us-gaap:CustomerRelationshipsMember2024-04-280000315189us-gaap:OtherIntangibleAssetsMember2023-10-290000315189us-gaap:CustomerRelationshipsMember2023-10-290000315189us-gaap:OtherIntangibleAssetsMember2023-04-300000315189us-gaap:CustomerRelationshipsMember2023-04-300000315189srt:RevisionOfPriorPeriodErrorCorrectionAdjustmentMemberde:FinancialServicesSegmentMember2023-01-300000315189us-gaap:NoncontrollingInterestMember2024-01-292024-04-280000315189us-gaap:NoncontrollingInterestMember2023-10-302024-04-280000315189us-gaap:NoncontrollingInterestMember2023-01-302023-04-300000315189us-gaap:InterestRateSwapMemberus-gaap:FairValueHedgingMemberus-gaap:DesignatedAsHedgingInstrumentMember2024-04-280000315189us-gaap:InterestRateSwapMemberus-gaap:CashFlowHedgingMemberus-gaap:DesignatedAsHedgingInstrumentMember2024-04-280000315189us-gaap:InterestRateSwapMemberus-gaap:NotDesignatedAsHedgingInstrumentEconomicHedgeMember2024-04-280000315189us-gaap:ForeignExchangeContractMemberus-gaap:NotDesignatedAsHedgingInstrumentEconomicHedgeMember2024-04-280000315189us-gaap:CrossCurrencyInterestRateContractMemberus-gaap:NotDesignatedAsHedgingInstrumentEconomicHedgeMember2024-04-280000315189us-gaap:InterestRateSwapMemberus-gaap:FairValueHedgingMemberus-gaap:DesignatedAsHedgingInstrumentMember2023-10-290000315189us-gaap:InterestRateSwapMemberus-gaap:CashFlowHedgingMemberus-gaap:DesignatedAsHedgingInstrumentMember2023-10-290000315189us-gaap:InterestRateSwapMemberus-gaap:NotDesignatedAsHedgingInstrumentEconomicHedgeMember2023-10-290000315189us-gaap:ForeignExchangeContractMemberus-gaap:NotDesignatedAsHedgingInstrumentEconomicHedgeMember2023-10-290000315189us-gaap:CrossCurrencyInterestRateContractMemberus-gaap:NotDesignatedAsHedgingInstrumentEconomicHedgeMember2023-10-290000315189us-gaap:InterestRateSwapMemberus-gaap:FairValueHedgingMemberus-gaap:DesignatedAsHedgingInstrumentMember2023-04-300000315189us-gaap:InterestRateSwapMemberus-gaap:CashFlowHedgingMemberus-gaap:DesignatedAsHedgingInstrumentMember2023-04-300000315189us-gaap:InterestRateSwapMemberus-gaap:NotDesignatedAsHedgingInstrumentEconomicHedgeMember2023-04-300000315189us-gaap:ForeignExchangeContractMemberus-gaap:NotDesignatedAsHedgingInstrumentEconomicHedgeMember2023-04-300000315189us-gaap:CrossCurrencyInterestRateContractMemberus-gaap:NotDesignatedAsHedgingInstrumentEconomicHedgeMember2023-04-300000315189us-gaap:InterestRateSwapMemberus-gaap:InterestExpenseMember2024-01-292024-04-280000315189us-gaap:ForeignExchangeContractMemberus-gaap:SalesMember2024-01-292024-04-280000315189us-gaap:ForeignExchangeContractMemberus-gaap:OtherExpenseMember2024-01-292024-04-280000315189us-gaap:ForeignExchangeContractMemberus-gaap:CostOfSalesMember2024-01-292024-04-280000315189us-gaap:InterestRateSwapMemberus-gaap:InterestExpenseMember2023-10-302024-04-280000315189us-gaap:ForeignExchangeContractMemberus-gaap:SalesMember2023-10-302024-04-280000315189us-gaap:ForeignExchangeContractMemberus-gaap:OtherExpenseMember2023-10-302024-04-280000315189us-gaap:ForeignExchangeContractMemberus-gaap:CostOfSalesMember2023-10-302024-04-280000315189us-gaap:InterestRateSwapMemberus-gaap:SalesMember2023-01-302023-04-300000315189us-gaap:InterestRateSwapMemberus-gaap:InterestExpenseMember2023-01-302023-04-300000315189us-gaap:ForeignExchangeContractMemberus-gaap:SalesMember2023-01-302023-04-300000315189us-gaap:ForeignExchangeContractMemberus-gaap:OtherExpenseMember2023-01-302023-04-300000315189us-gaap:ForeignExchangeContractMemberus-gaap:CostOfSalesMember2023-01-302023-04-300000315189us-gaap:InterestRateSwapMemberus-gaap:SalesMember2022-10-312023-04-300000315189us-gaap:InterestRateSwapMemberus-gaap:InterestExpenseMember2022-10-312023-04-300000315189us-gaap:ForeignExchangeContractMemberus-gaap:SalesMember2022-10-312023-04-300000315189us-gaap:ForeignExchangeContractMemberus-gaap:OtherExpenseMember2022-10-312023-04-300000315189us-gaap:ForeignExchangeContractMemberus-gaap:CostOfSalesMember2022-10-312023-04-300000315189us-gaap:AccountsPayableAndAccruedLiabilitiesMemberus-gaap:InterestRateSwapMemberus-gaap:FairValueHedgingMemberus-gaap:DesignatedAsHedgingInstrumentMember2024-04-280000315189us-gaap:AccountsPayableAndAccruedLiabilitiesMemberus-gaap:InterestRateSwapMemberus-gaap:CashFlowHedgingMemberus-gaap:DesignatedAsHedgingInstrumentMember2024-04-280000315189us-gaap:AccountsPayableAndAccruedLiabilitiesMemberus-gaap:InterestRateSwapMemberus-gaap:NotDesignatedAsHedgingInstrumentEconomicHedgeMember2024-04-280000315189us-gaap:AccountsPayableAndAccruedLiabilitiesMemberus-gaap:ForeignExchangeContractMemberus-gaap:NotDesignatedAsHedgingInstrumentEconomicHedgeMember2024-04-280000315189us-gaap:AccountsPayableAndAccruedLiabilitiesMemberus-gaap:FairValueInputsLevel2Memberus-gaap:FairValueMeasurementsRecurringMember2024-04-280000315189us-gaap:AccountsPayableAndAccruedLiabilitiesMemberus-gaap:CrossCurrencyInterestRateContractMemberus-gaap:NotDesignatedAsHedgingInstrumentEconomicHedgeMember2024-04-280000315189us-gaap:AccountsPayableAndAccruedLiabilitiesMemberus-gaap:InterestRateSwapMemberus-gaap:FairValueHedgingMemberus-gaap:DesignatedAsHedgingInstrumentMember2023-10-290000315189us-gaap:AccountsPayableAndAccruedLiabilitiesMemberus-gaap:InterestRateSwapMemberus-gaap:NotDesignatedAsHedgingInstrumentEconomicHedgeMember2023-10-290000315189us-gaap:AccountsPayableAndAccruedLiabilitiesMemberus-gaap:ForeignExchangeContractMemberus-gaap:NotDesignatedAsHedgingInstrumentEconomicHedgeMember2023-10-290000315189us-gaap:AccountsPayableAndAccruedLiabilitiesMemberus-gaap:FairValueInputsLevel2Memberus-gaap:FairValueMeasurementsRecurringMember2023-10-290000315189us-gaap:AccountsPayableAndAccruedLiabilitiesMemberus-gaap:CrossCurrencyInterestRateContractMemberus-gaap:NotDesignatedAsHedgingInstrumentEconomicHedgeMember2023-10-290000315189us-gaap:AccountsPayableAndAccruedLiabilitiesMemberus-gaap:InterestRateSwapMemberus-gaap:FairValueHedgingMemberus-gaap:DesignatedAsHedgingInstrumentMember2023-04-300000315189us-gaap:AccountsPayableAndAccruedLiabilitiesMemberus-gaap:InterestRateSwapMemberus-gaap:CashFlowHedgingMemberus-gaap:DesignatedAsHedgingInstrumentMember2023-04-300000315189us-gaap:AccountsPayableAndAccruedLiabilitiesMemberus-gaap:InterestRateSwapMemberus-gaap:NotDesignatedAsHedgingInstrumentEconomicHedgeMember2023-04-300000315189us-gaap:AccountsPayableAndAccruedLiabilitiesMemberus-gaap:ForeignExchangeContractMemberus-gaap:NotDesignatedAsHedgingInstrumentEconomicHedgeMember2023-04-300000315189us-gaap:AccountsPayableAndAccruedLiabilitiesMemberus-gaap:FairValueInputsLevel2Memberus-gaap:FairValueMeasurementsRecurringMember2023-04-300000315189us-gaap:AccountsPayableAndAccruedLiabilitiesMemberus-gaap:CrossCurrencyInterestRateContractMemberus-gaap:NotDesignatedAsHedgingInstrumentEconomicHedgeMember2023-04-300000315189us-gaap:OtherAssetsMemberus-gaap:InterestRateSwapMemberus-gaap:FairValueHedgingMemberus-gaap:DesignatedAsHedgingInstrumentMember2024-04-280000315189us-gaap:OtherAssetsMemberus-gaap:InterestRateSwapMemberus-gaap:CashFlowHedgingMemberus-gaap:DesignatedAsHedgingInstrumentMember2024-04-280000315189us-gaap:OtherAssetsMemberus-gaap:InterestRateSwapMemberus-gaap:NotDesignatedAsHedgingInstrumentEconomicHedgeMember2024-04-280000315189us-gaap:OtherAssetsMemberus-gaap:ForeignExchangeContractMemberus-gaap:NotDesignatedAsHedgingInstrumentEconomicHedgeMember2024-04-280000315189us-gaap:OtherAssetsMemberus-gaap:FairValueInputsLevel2Memberus-gaap:FairValueMeasurementsRecurringMember2024-04-280000315189us-gaap:OtherAssetsMemberus-gaap:CrossCurrencyInterestRateContractMemberus-gaap:NotDesignatedAsHedgingInstrumentEconomicHedgeMember2024-04-280000315189us-gaap:OtherAssetsMemberus-gaap:InterestRateSwapMemberus-gaap:CashFlowHedgingMemberus-gaap:DesignatedAsHedgingInstrumentMember2023-10-290000315189us-gaap:OtherAssetsMemberus-gaap:InterestRateSwapMemberus-gaap:NotDesignatedAsHedgingInstrumentEconomicHedgeMember2023-10-290000315189us-gaap:OtherAssetsMemberus-gaap:ForeignExchangeContractMemberus-gaap:NotDesignatedAsHedgingInstrumentEconomicHedgeMember2023-10-290000315189us-gaap:OtherAssetsMemberus-gaap:FairValueInputsLevel2Memberus-gaap:FairValueMeasurementsRecurringMember2023-10-290000315189us-gaap:OtherAssetsMemberus-gaap:CrossCurrencyInterestRateContractMemberus-gaap:NotDesignatedAsHedgingInstrumentEconomicHedgeMember2023-10-290000315189us-gaap:OtherAssetsMemberus-gaap:InterestRateSwapMemberus-gaap:FairValueHedgingMemberus-gaap:DesignatedAsHedgingInstrumentMember2023-04-300000315189us-gaap:OtherAssetsMemberus-gaap:InterestRateSwapMemberus-gaap:CashFlowHedgingMemberus-gaap:DesignatedAsHedgingInstrumentMember2023-04-300000315189us-gaap:OtherAssetsMemberus-gaap:InterestRateSwapMemberus-gaap:NotDesignatedAsHedgingInstrumentEconomicHedgeMember2023-04-300000315189us-gaap:OtherAssetsMemberus-gaap:ForeignExchangeContractMemberus-gaap:NotDesignatedAsHedgingInstrumentEconomicHedgeMember2023-04-300000315189us-gaap:OtherAssetsMemberus-gaap:FairValueInputsLevel2Memberus-gaap:FairValueMeasurementsRecurringMember2023-04-300000315189us-gaap:OtherAssetsMemberus-gaap:CrossCurrencyInterestRateContractMemberus-gaap:NotDesignatedAsHedgingInstrumentEconomicHedgeMember2023-04-300000315189us-gaap:PensionPlansDefinedBenefitMember2024-04-280000315189us-gaap:OtherPostretirementBenefitPlansDefinedBenefitMember2024-04-280000315189us-gaap:PensionPlansDefinedBenefitMember2024-01-292024-04-280000315189us-gaap:OtherPostretirementBenefitPlansDefinedBenefitMember2024-01-292024-04-280000315189us-gaap:PensionPlansDefinedBenefitMember2023-01-302023-04-300000315189us-gaap:OtherPostretirementBenefitPlansDefinedBenefitMember2023-01-302023-04-300000315189us-gaap:PensionPlansDefinedBenefitMember2022-10-312023-04-300000315189us-gaap:OtherPostretirementBenefitPlansDefinedBenefitMember2022-10-312023-04-300000315189us-gaap:NotesPayableOtherPayablesMember2024-04-280000315189de:Notes7.125PercentDue2031Member2024-04-280000315189de:Notes5.375PercentDue2029Member2024-04-280000315189de:Notes3.90PercentDue2042Member2024-04-280000315189de:Notes3.75PercentDue2050Member2024-04-280000315189de:Notes3.10PercentDue2030Member2024-04-280000315189de:Notes2.875PercentDue2049Member2024-04-280000315189de:MediumTermNotesDueInNextTenYearsMember2024-04-280000315189de:EuroNotes2.20PercentDue2032Member2024-04-280000315189de:EuroNotes1.85PercentDue2028Member2024-04-280000315189de:EuroNotes1.65PercentDue2039Member2024-04-280000315189de:Debentures8.10PercentDue2030Member2024-04-280000315189de:Debentures6.55PercentDue2028Member2024-04-280000315189us-gaap:NotesPayableOtherPayablesMember2023-10-290000315189de:Notes7.125PercentDue2031Member2023-10-290000315189de:Notes5.375PercentDue2029Member2023-10-290000315189de:Notes3.90PercentDue2042Member2023-10-290000315189de:Notes3.75PercentDue2050Member2023-10-290000315189de:Notes3.10PercentDue2030Member2023-10-290000315189de:Notes2.875PercentDue2049Member2023-10-290000315189de:Notes2.75PercentDue2025Member2023-10-290000315189de:MediumTermNotesDueInNextTenYearsMember2023-10-290000315189de:EuroNotes2.20PercentDue2032Member2023-10-290000315189de:EuroNotes1.85PercentDue2028Member2023-10-290000315189de:EuroNotes1.65PercentDue2039Member2023-10-290000315189de:Debentures8.10PercentDue2030Member2023-10-290000315189de:Debentures6.55PercentDue2028Member2023-10-290000315189us-gaap:NotesPayableOtherPayablesMember2023-04-300000315189de:Notes7.125PercentDue2031Member2023-04-300000315189de:Notes5.375PercentDue2029Member2023-04-300000315189de:Notes3.90PercentDue2042Member2023-04-300000315189de:Notes3.75PercentDue2050Member2023-04-300000315189de:Notes3.10PercentDue2030Member2023-04-300000315189de:Notes2.875PercentDue2049Member2023-04-300000315189de:Notes2.75PercentDue2025Member2023-04-300000315189de:MediumTermNotesDueInNextTenYearsMember2023-04-300000315189de:EuroNotes2.20PercentDue2032Member2023-04-300000315189de:EuroNotes1.85PercentDue2028Member2023-04-300000315189de:EuroNotes1.65PercentDue2039Member2023-04-300000315189de:Debentures8.10PercentDue2030Member2023-04-300000315189de:Debentures6.55PercentDue2028Member2023-04-300000315189us-gaap:ProductFinancingArrangementMember2024-04-280000315189us-gaap:NotesPayableToBanksMember2024-04-280000315189us-gaap:CommercialPaperMember2024-04-280000315189de:LongTermDebtCurrentMember2024-04-280000315189us-gaap:ProductFinancingArrangementMember2023-10-290000315189us-gaap:NotesPayableToBanksMember2023-10-290000315189us-gaap:CommercialPaperMember2023-10-290000315189de:LongTermDebtCurrentMember2023-10-290000315189us-gaap:ProductFinancingArrangementMember2023-04-300000315189us-gaap:NotesPayableToBanksMember2023-04-300000315189us-gaap:CommercialPaperMember2023-04-300000315189de:LongTermDebtCurrentMember2023-04-300000315189us-gaap:ProductMember2024-01-292024-04-280000315189us-gaap:ProductMember2023-10-302024-04-280000315189us-gaap:ProductMember2023-01-302023-04-300000315189us-gaap:ProductMember2022-10-312023-04-300000315189us-gaap:SubsequentEventMember2024-05-292024-05-290000315189us-gaap:AccountingStandardsUpdate202204Member2024-04-280000315189us-gaap:AccountingStandardsUpdate202203Member2024-04-280000315189us-gaap:AccountingStandardsUpdate202202Member2024-04-280000315189us-gaap:AccountingStandardsUpdate202201Member2024-04-280000315189us-gaap:AccountingStandardsUpdate202108Member2024-04-280000315189de:AccountingStandardsUpdate202309Member2024-04-280000315189de:AccountingStandardsUpdate202307Member2024-04-280000315189de:AccountingStandardsUpdate202306Member2024-04-280000315189de:AccountingStandardsUpdate202305Member2024-04-280000315189us-gaap:OperatingSegmentsMemberde:SmallAgricultureAndTurfSegmentMember2024-04-280000315189us-gaap:OperatingSegmentsMemberde:ProductionAndPrecisionAgricultureSegmentMember2024-04-280000315189us-gaap:OperatingSegmentsMemberde:FinancialServicesSegmentMember2024-04-280000315189us-gaap:OperatingSegmentsMemberde:ConstructionAndForestrySegmentMember2024-04-280000315189us-gaap:CorporateNonSegmentMember2024-04-280000315189us-gaap:OperatingSegmentsMemberde:SmallAgricultureAndTurfSegmentMember2023-10-290000315189us-gaap:OperatingSegmentsMemberde:ProductionAndPrecisionAgricultureSegmentMember2023-10-290000315189us-gaap:OperatingSegmentsMemberde:FinancialServicesSegmentMember2023-10-290000315189us-gaap:OperatingSegmentsMemberde:ConstructionAndForestrySegmentMember2023-10-290000315189us-gaap:CorporateNonSegmentMember2023-10-290000315189us-gaap:OperatingSegmentsMemberde:SmallAgricultureAndTurfSegmentMember2023-04-300000315189us-gaap:OperatingSegmentsMemberde:ProductionAndPrecisionAgricultureSegmentMember2023-04-300000315189us-gaap:OperatingSegmentsMemberde:FinancialServicesSegmentMember2023-04-300000315189us-gaap:OperatingSegmentsMemberde:ConstructionAndForestrySegmentMember2023-04-300000315189us-gaap:CorporateNonSegmentMember2023-04-300000315189us-gaap:RelatedPartyMember2024-04-280000315189us-gaap:NonrelatedPartyMember2024-04-280000315189us-gaap:RelatedPartyMember2023-10-290000315189us-gaap:NonrelatedPartyMember2023-10-290000315189us-gaap:RelatedPartyMember2023-04-300000315189us-gaap:NonrelatedPartyMember2023-04-300000315189de:RajeshKalathurMember2024-04-280000315189de:CoryJReedMember2024-04-280000315189us-gaap:CommonStockMember2023-10-302024-04-280000315189de:Debentures6.55PercentDue2028Member2023-10-302024-04-280000315189de:RajeshKalathurMember2024-01-292024-04-280000315189de:CoryJReedMember2024-01-292024-04-280000315189us-gaap:TreasuryStockCommonMember2024-01-292024-04-280000315189us-gaap:TreasuryStockCommonMember2023-10-302024-04-280000315189us-gaap:TreasuryStockCommonMember2023-01-302023-04-300000315189us-gaap:TreasuryStockCommonMember2022-10-312023-04-300000315189us-gaap:RetainedEarningsMember2024-01-292024-04-280000315189us-gaap:CommonStockMember2024-01-292024-04-280000315189us-gaap:RetainedEarningsMember2023-10-302024-04-280000315189us-gaap:CommonStockMember2023-10-302024-04-280000315189us-gaap:RetainedEarningsMember2023-01-302023-04-300000315189us-gaap:CommonStockMember2023-01-302023-04-300000315189us-gaap:RetainedEarningsMember2022-10-312023-04-300000315189us-gaap:NoncontrollingInterestMember2022-10-312023-04-300000315189us-gaap:CommonStockMember2022-10-312023-04-300000315189srt:MinimumMemberde:RestrictedStockUnitsMarketServiceBasedMember2023-10-302024-04-280000315189srt:MaximumMemberde:RestrictedStockUnitsMarketServiceBasedMember2023-10-302024-04-280000315189de:OtherProductsAndServicesMemberde:SmallAgricultureAndTurfSegmentMember2024-01-292024-04-280000315189de:OtherProductsAndServicesMemberde:ProductionAndPrecisionAgricultureSegmentMember2024-01-292024-04-280000315189de:OtherProductsAndServicesMemberde:ConstructionAndForestrySegmentMember2024-01-292024-04-280000315189de:OtherProductsAndServicesMember2024-01-292024-04-280000315189de:OtherProductsAndServicesMemberde:SmallAgricultureAndTurfSegmentMember2023-10-302024-04-280000315189de:OtherProductsAndServicesMemberde:ProductionAndPrecisionAgricultureSegmentMember2023-10-302024-04-280000315189de:OtherProductsAndServicesMemberde:ConstructionAndForestrySegmentMember2023-10-302024-04-280000315189de:OtherProductsAndServicesMember2023-10-302024-04-280000315189de:OtherProductsAndServicesMemberde:SmallAgricultureAndTurfSegmentMember2023-01-302023-04-300000315189de:OtherProductsAndServicesMemberde:ProductionAndPrecisionAgricultureSegmentMember2023-01-302023-04-300000315189de:OtherProductsAndServicesMemberde:ConstructionAndForestrySegmentMember2023-01-302023-04-300000315189us-gaap:MaterialReconcilingItemsMember2023-01-302023-04-300000315189de:OtherProductsAndServicesMember2023-01-302023-04-300000315189de:OtherProductsAndServicesMemberde:SmallAgricultureAndTurfSegmentMember2022-10-312023-04-300000315189de:OtherProductsAndServicesMemberde:ProductionAndPrecisionAgricultureSegmentMember2022-10-312023-04-300000315189de:OtherProductsAndServicesMemberde:ConstructionAndForestrySegmentMember2022-10-312023-04-300000315189us-gaap:MaterialReconcilingItemsMember2022-10-312023-04-300000315189de:OtherProductsAndServicesMember2022-10-312023-04-300000315189us-gaap:MaterialReconcilingItemsMember2024-01-292024-04-280000315189us-gaap:MaterialReconcilingItemsMember2023-10-302024-04-280000315189us-gaap:OperatingSegmentsMemberus-gaap:ProductMemberde:SmallAgricultureAndTurfSegmentMember2024-01-292024-04-280000315189us-gaap:OperatingSegmentsMemberus-gaap:ProductMemberde:ProductionAndPrecisionAgricultureSegmentMember2024-01-292024-04-280000315189us-gaap:OperatingSegmentsMemberus-gaap:ProductMemberde:ConstructionAndForestrySegmentMember2024-01-292024-04-280000315189us-gaap:OperatingSegmentsMemberus-gaap:ProductMemberde:SmallAgricultureAndTurfSegmentMember2023-10-302024-04-280000315189us-gaap:OperatingSegmentsMemberus-gaap:ProductMemberde:ProductionAndPrecisionAgricultureSegmentMember2023-10-302024-04-280000315189us-gaap:OperatingSegmentsMemberus-gaap:ProductMemberde:ConstructionAndForestrySegmentMember2023-10-302024-04-280000315189us-gaap:OperatingSegmentsMemberde:ConstructionAndForestrySegmentMember2024-01-292024-04-280000315189us-gaap:OperatingSegmentsMember2024-01-292024-04-280000315189us-gaap:OperatingSegmentsMemberde:ConstructionAndForestrySegmentMember2023-10-302024-04-280000315189us-gaap:OperatingSegmentsMember2023-10-302024-04-280000315189us-gaap:FairValueInputsLevel3Memberus-gaap:AssetPledgedAsCollateralWithRightMember2024-04-280000315189us-gaap:FairValueInputsLevel3Memberus-gaap:AssetNotPledgedAsCollateralMember2024-04-280000315189us-gaap:CarryingReportedAmountFairValueDisclosureMemberus-gaap:AssetPledgedAsCollateralWithRightMember2024-04-280000315189us-gaap:CarryingReportedAmountFairValueDisclosureMemberus-gaap:AssetNotPledgedAsCollateralMember2024-04-280000315189us-gaap:AssetPledgedAsCollateralWithRightMember2024-04-280000315189us-gaap:AssetNotPledgedAsCollateralMember2024-04-280000315189us-gaap:FairValueInputsLevel3Memberus-gaap:AssetPledgedAsCollateralWithRightMember2023-10-290000315189us-gaap:FairValueInputsLevel3Memberus-gaap:AssetNotPledgedAsCollateralMember2023-10-290000315189us-gaap:CarryingReportedAmountFairValueDisclosureMemberus-gaap:AssetPledgedAsCollateralWithRightMember2023-10-290000315189us-gaap:CarryingReportedAmountFairValueDisclosureMemberus-gaap:AssetNotPledgedAsCollateralMember2023-10-290000315189us-gaap:AssetPledgedAsCollateralWithRightMember2023-10-290000315189us-gaap:AssetNotPledgedAsCollateralMember2023-10-290000315189us-gaap:FairValueInputsLevel3Memberus-gaap:AssetPledgedAsCollateralWithRightMember2023-04-300000315189us-gaap:FairValueInputsLevel3Memberus-gaap:AssetNotPledgedAsCollateralMember2023-04-300000315189us-gaap:CarryingReportedAmountFairValueDisclosureMemberus-gaap:AssetPledgedAsCollateralWithRightMember2023-04-300000315189us-gaap:CarryingReportedAmountFairValueDisclosureMemberus-gaap:AssetNotPledgedAsCollateralMember2023-04-300000315189us-gaap:AssetPledgedAsCollateralWithRightMember2023-04-300000315189us-gaap:AssetNotPledgedAsCollateralMember2023-04-300000315189us-gaap:OperatingSegmentsMemberde:SmallAgricultureAndTurfSegmentMember2024-01-292024-04-280000315189us-gaap:OperatingSegmentsMemberde:ProductionAndPrecisionAgricultureSegmentMember2024-01-292024-04-280000315189us-gaap:OperatingSegmentsMemberde:FinancialServicesSegmentMember2024-01-292024-04-280000315189us-gaap:OperatingSegmentsMemberde:SmallAgricultureAndTurfSegmentMember2023-10-302024-04-280000315189us-gaap:OperatingSegmentsMemberde:ProductionAndPrecisionAgricultureSegmentMember2023-10-302024-04-280000315189us-gaap:OperatingSegmentsMemberde:FinancialServicesSegmentMember2023-10-302024-04-280000315189us-gaap:OperatingSegmentsMemberde:SmallAgricultureAndTurfSegmentMember2023-01-302023-04-300000315189us-gaap:OperatingSegmentsMemberde:ProductionAndPrecisionAgricultureSegmentMember2023-01-302023-04-300000315189us-gaap:OperatingSegmentsMemberde:FinancialServicesSegmentMember2023-01-302023-04-300000315189us-gaap:OperatingSegmentsMemberde:SmallAgricultureAndTurfSegmentMember2022-10-312023-04-300000315189us-gaap:OperatingSegmentsMemberde:ProductionAndPrecisionAgricultureSegmentMember2022-10-312023-04-300000315189us-gaap:OperatingSegmentsMemberde:FinancialServicesSegmentMember2022-10-312023-04-300000315189de:LongTermDebtNoncurrentMemberus-gaap:InterestRateSwapMemberus-gaap:FairValueHedgingMember2024-04-280000315189de:DebtCurrentMemberus-gaap:InterestRateSwapMemberus-gaap:FairValueHedgingMember2024-04-280000315189de:LongTermDebtNoncurrentMemberus-gaap:InterestRateSwapMemberus-gaap:FairValueHedgingMember2023-10-290000315189de:DebtCurrentMemberus-gaap:InterestRateSwapMemberus-gaap:FairValueHedgingMember2023-10-290000315189de:LongTermDebtNoncurrentMemberus-gaap:InterestRateSwapMemberus-gaap:FairValueHedgingMember2023-04-300000315189de:DebtCurrentMemberus-gaap:InterestRateSwapMemberus-gaap:FairValueHedgingMember2023-04-300000315189us-gaap:AgriculturalSectorMemberus-gaap:ConsumerPortfolioSegmentMemberus-gaap:FinancingReceivablesEqualToGreaterThan90DaysPastDueMember2023-04-300000315189us-gaap:ConstructionSectorMemberus-gaap:PerformingFinancingReceivableMemberus-gaap:CommercialPortfolioSegmentMember2024-04-280000315189us-gaap:AgriculturalSectorMemberus-gaap:ConsumerPortfolioSegmentMemberus-gaap:FinancingReceivablesEqualToGreaterThan90DaysPastDueMember2023-10-290000315189us-gaap:AgriculturalSectorMemberus-gaap:ConsumerPortfolioSegmentMemberus-gaap:FinancingReceivablesEqualToGreaterThan90DaysPastDueMember2024-04-280000315189us-gaap:ConstructionSectorMemberus-gaap:ConsumerPortfolioSegmentMemberus-gaap:FinancingReceivables60To89DaysPastDueMember2023-10-290000315189us-gaap:ConstructionSectorMemberus-gaap:ConsumerPortfolioSegmentMemberus-gaap:FinancingReceivables30To59DaysPastDueMember2023-10-290000315189us-gaap:AgriculturalSectorMemberus-gaap:NonperformingFinancingReceivableMemberus-gaap:CommercialPortfolioSegmentMember2023-10-290000315189us-gaap:ConstructionSectorMemberus-gaap:ConsumerPortfolioSegmentMemberus-gaap:FinancingReceivablesEqualToGreaterThan90DaysPastDueMember2023-04-300000315189us-gaap:AgriculturalSectorMemberus-gaap:NonperformingFinancingReceivableMemberus-gaap:CommercialPortfolioSegmentMember2023-04-300000315189us-gaap:ConstructionSectorMemberus-gaap:PerformingFinancingReceivableMemberus-gaap:ConsumerPortfolioSegmentMember2024-04-280000315189us-gaap:ConstructionSectorMemberus-gaap:NonperformingFinancingReceivableMemberus-gaap:ConsumerPortfolioSegmentMember2024-04-280000315189us-gaap:ConstructionSectorMemberus-gaap:ConsumerPortfolioSegmentMemberus-gaap:FinancingReceivablesEqualToGreaterThan90DaysPastDueMember2024-04-280000315189us-gaap:ConstructionSectorMemberus-gaap:ConsumerPortfolioSegmentMemberus-gaap:FinancingReceivables60To89DaysPastDueMember2024-04-280000315189us-gaap:ConstructionSectorMemberus-gaap:ConsumerPortfolioSegmentMemberus-gaap:FinancingReceivables30To59DaysPastDueMember2024-04-280000315189us-gaap:AgriculturalSectorMemberus-gaap:PerformingFinancingReceivableMemberus-gaap:ConsumerPortfolioSegmentMember2024-04-280000315189us-gaap:AgriculturalSectorMemberus-gaap:PerformingFinancingReceivableMemberus-gaap:CommercialPortfolioSegmentMember2024-04-280000315189us-gaap:AgriculturalSectorMemberus-gaap:NonperformingFinancingReceivableMemberus-gaap:ConsumerPortfolioSegmentMember2024-04-280000315189us-gaap:AgriculturalSectorMemberus-gaap:NonperformingFinancingReceivableMemberus-gaap:CommercialPortfolioSegmentMember2024-04-280000315189us-gaap:AgriculturalSectorMemberus-gaap:ConsumerPortfolioSegmentMemberus-gaap:FinancingReceivables60To89DaysPastDueMember2024-04-280000315189us-gaap:AgriculturalSectorMemberus-gaap:ConsumerPortfolioSegmentMemberus-gaap:FinancingReceivables30To59DaysPastDueMember2024-04-280000315189us-gaap:ConsumerPortfolioSegmentMember2024-04-280000315189us-gaap:ConstructionSectorMemberus-gaap:PerformingFinancingReceivableMemberus-gaap:ConsumerPortfolioSegmentMember2023-10-290000315189us-gaap:ConstructionSectorMemberus-gaap:PerformingFinancingReceivableMemberus-gaap:CommercialPortfolioSegmentMember2023-10-290000315189us-gaap:ConstructionSectorMemberus-gaap:NonperformingFinancingReceivableMemberus-gaap:ConsumerPortfolioSegmentMember2023-10-290000315189us-gaap:ConstructionSectorMemberus-gaap:ConsumerPortfolioSegmentMemberus-gaap:FinancingReceivablesEqualToGreaterThan90DaysPastDueMember2023-10-290000315189us-gaap:AgriculturalSectorMemberus-gaap:PerformingFinancingReceivableMemberus-gaap:ConsumerPortfolioSegmentMember2023-10-290000315189us-gaap:AgriculturalSectorMemberus-gaap:PerformingFinancingReceivableMemberus-gaap:CommercialPortfolioSegmentMember2023-10-290000315189us-gaap:AgriculturalSectorMemberus-gaap:NonperformingFinancingReceivableMemberus-gaap:ConsumerPortfolioSegmentMember2023-10-290000315189us-gaap:AgriculturalSectorMemberus-gaap:ConsumerPortfolioSegmentMemberus-gaap:FinancingReceivables60To89DaysPastDueMember2023-10-290000315189us-gaap:AgriculturalSectorMemberus-gaap:ConsumerPortfolioSegmentMemberus-gaap:FinancingReceivables30To59DaysPastDueMember2023-10-290000315189us-gaap:ConsumerPortfolioSegmentMember2023-10-290000315189us-gaap:ConstructionSectorMemberus-gaap:PerformingFinancingReceivableMemberus-gaap:ConsumerPortfolioSegmentMember2023-04-300000315189us-gaap:ConstructionSectorMemberus-gaap:PerformingFinancingReceivableMemberus-gaap:CommercialPortfolioSegmentMember2023-04-300000315189us-gaap:ConstructionSectorMemberus-gaap:NonperformingFinancingReceivableMemberus-gaap:ConsumerPortfolioSegmentMember2023-04-300000315189us-gaap:ConstructionSectorMemberus-gaap:ConsumerPortfolioSegmentMemberus-gaap:FinancingReceivables60To89DaysPastDueMember2023-04-300000315189us-gaap:ConstructionSectorMemberus-gaap:ConsumerPortfolioSegmentMemberus-gaap:FinancingReceivables30To59DaysPastDueMember2023-04-300000315189us-gaap:AgriculturalSectorMemberus-gaap:PerformingFinancingReceivableMemberus-gaap:ConsumerPortfolioSegmentMember2023-04-300000315189us-gaap:AgriculturalSectorMemberus-gaap:PerformingFinancingReceivableMemberus-gaap:CommercialPortfolioSegmentMember2023-04-300000315189us-gaap:AgriculturalSectorMemberus-gaap:NonperformingFinancingReceivableMemberus-gaap:ConsumerPortfolioSegmentMember2023-04-300000315189us-gaap:AgriculturalSectorMemberus-gaap:ConsumerPortfolioSegmentMemberus-gaap:FinancingReceivables60To89DaysPastDueMember2023-04-300000315189us-gaap:AgriculturalSectorMemberus-gaap:ConsumerPortfolioSegmentMemberus-gaap:FinancingReceivables30To59DaysPastDueMember2023-04-300000315189us-gaap:ConsumerPortfolioSegmentMember2023-04-300000315189us-gaap:PerformingFinancingReceivableMember2023-10-302024-04-280000315189us-gaap:NonperformingFinancingReceivableMember2023-10-302024-04-280000315189us-gaap:FinancingReceivables30To59DaysPastDueMember2023-10-302024-04-280000315189us-gaap:ConstructionSectorMemberus-gaap:ConsumerPortfolioSegmentMember2023-10-302024-04-280000315189us-gaap:AgriculturalSectorMemberus-gaap:ConsumerPortfolioSegmentMember2023-10-302024-04-280000315189us-gaap:ConsumerPortfolioSegmentMember2023-10-302024-04-280000315189de:RevolvingChargeAccountsPortfolioSegmentMember2024-01-292024-04-280000315189de:RevolvingChargeAccountsPortfolioSegmentMember2023-10-302024-04-280000315189de:RevolvingChargeAccountsPortfolioSegmentMember2023-01-302023-04-300000315189de:RetailNotesAndFinanceLeasesPortfolioSegmentMember2023-01-302023-04-300000315189de:RevolvingChargeAccountsPortfolioSegmentMember2022-10-312023-04-300000315189country:RUde:RetailNotesAndFinanceLeasesPortfolioSegmentMember2022-10-312023-04-300000315189country:RU2022-10-312023-04-300000315189de:RetailNotesAndFinanceLeasesPortfolioSegmentMember2024-01-292024-04-280000315189us-gaap:CommercialPortfolioSegmentMember2023-10-302024-04-280000315189de:RetailNotesAndFinanceLeasesPortfolioSegmentMember2023-10-302024-04-280000315189de:RetailNotesAndFinanceLeasesPortfolioSegmentMember2022-10-312023-04-300000315189us-gaap:CommercialPortfolioSegmentMember2024-04-280000315189de:RevolvingChargeAccountsPortfolioSegmentMember2024-04-280000315189de:RetailNotesAndFinanceLeasesPortfolioSegmentMember2024-04-280000315189us-gaap:CommercialPortfolioSegmentMember2024-01-280000315189de:RevolvingChargeAccountsPortfolioSegmentMember2024-01-280000315189de:RetailNotesAndFinanceLeasesPortfolioSegmentMember2024-01-2800003151892024-01-280000315189us-gaap:CommercialPortfolioSegmentMember2023-10-290000315189de:RevolvingChargeAccountsPortfolioSegmentMember2023-10-290000315189de:RetailNotesAndFinanceLeasesPortfolioSegmentMember2023-10-290000315189us-gaap:CommercialPortfolioSegmentMember2023-04-300000315189de:RevolvingChargeAccountsPortfolioSegmentMember2023-04-300000315189de:RetailNotesAndFinanceLeasesPortfolioSegmentMember2023-04-300000315189us-gaap:CommercialPortfolioSegmentMember2023-01-290000315189de:RevolvingChargeAccountsPortfolioSegmentMember2023-01-290000315189de:RetailNotesAndFinanceLeasesPortfolioSegmentMember2023-01-2900003151892023-01-290000315189us-gaap:CommercialPortfolioSegmentMember2022-10-300000315189de:RevolvingChargeAccountsPortfolioSegmentMember2022-10-300000315189de:RetailNotesAndFinanceLeasesPortfolioSegmentMember2022-10-3000003151892022-10-300000315189srt:RevisionOfPriorPeriodErrorCorrectionAdjustmentMemberde:FinancialServicesSegmentMember2023-01-302023-01-300000315189us-gaap:ForeignExchangeFutureMember2024-04-280000315189us-gaap:ForeignExchangeFutureMember2023-10-290000315189us-gaap:ForeignExchangeFutureMember2023-04-300000315189us-gaap:PensionPlansDefinedBenefitMember2023-10-302024-04-280000315189us-gaap:OtherPostretirementBenefitPlansDefinedBenefitMember2023-10-302024-04-280000315189us-gaap:AccountsPayableAndAccruedLiabilitiesMemberus-gaap:FairValueInputsLevel3Memberus-gaap:FairValueMeasurementsRecurringMember2024-04-280000315189us-gaap:AccountsPayableAndAccruedLiabilitiesMemberus-gaap:FairValueInputsLevel3Memberus-gaap:FairValueMeasurementsRecurringMember2023-10-290000315189us-gaap:AccountsPayableAndAccruedLiabilitiesMemberus-gaap:FairValueInputsLevel3Memberus-gaap:FairValueMeasurementsRecurringMember2023-04-300000315189srt:ConsolidationEliminationsMemberde:TradeAccountsAndNotesReceivableMember2024-04-280000315189srt:ConsolidationEliminationsMemberde:TradeAccountsAndNotesReceivableMember2023-10-290000315189srt:ConsolidationEliminationsMemberde:TradeAccountsAndNotesReceivableMember2023-04-300000315189us-gaap:DisposalGroupDisposedOfBySaleNotDiscontinuedOperationsMemberde:SaleOfFinancialServicesBusinessInRussiaMemberde:FinancialServicesSegmentMember2023-03-0700003151892024-01-292024-04-2800003151892023-01-302023-04-3000003151892022-10-312023-04-300000315189us-gaap:OtherAssetsMember2024-04-2800003151892023-10-302024-04-2800003151892024-04-2800003151892023-10-2900003151892023-04-30iso4217:USDxbrli:purexbrli:sharesiso4217:USDxbrli:sharesiso4217:EUR

UNITED STATES

SECURITIES AND EXCHANGE COMMISSION

WASHINGTON, D.C. 20549

FORM 10-Q


(Mark One)

QUARTERLY REPORT PURSUANT TO SECTION 13 OR 15(d) OF THE SECURITIES EXCHANGE ACT OF 1934

For the quarterly period ended April 28, 2024

or

TRANSITION REPORT PURSUANT TO SECTION 13 OR 15(d) OF THE SECURITIES EXCHANGE ACT OF 1934

For the transition period from ____ to ____


Commission file no: 1-4121


DEERE  &  COMPANY

(Exact name of registrant as specified in its charter)

Delaware
(State of incorporation)

36-2382580
(IRS employer identification no.)

One John Deere Place

Moline, Illinois 61265

(Address of principal executive offices)

Telephone Number: (309) 765-8000

Securities Registered Pursuant to Section 12(b) of the Act:

Title of each class

Trading symbol

Name of each exchange on which registered

Common stock, $1 par value

DE

New York Stock Exchange

6.55% Debentures Due 2028

DE28

New York Stock Exchange

Indicate by check mark whether the registrant: (1) has filed all reports required to be filed by Section 13 or 15(d) of the Securities Exchange Act of 1934 during the preceding 12 months (or for such shorter period that the registrant was required to file such reports), and (2) has been subject to such filing requirements for the past 90 days.

Yes No 


Indicate by check mark whether the registrant has submitted electronically every Interactive Data File required to be submitted pursuant to Rule 405 of Regulation S-T (§232.405 of this chapter) during the preceding 12 months (or for such shorter period that the registrant was required to submit such files).

Yes No 


Indicate by check mark whether the registrant is a large accelerated filer, an accelerated filer, a non-accelerated filer, a smaller reporting company, or an emerging growth company. See the definitions of “large accelerated filer,” “accelerated filer,” “smaller reporting company,” and “emerging growth company” in Rule 12b-2 of the Exchange Act.


Large accelerated filer

Accelerated filer

Non-accelerated filer

Smaller reporting company

Emerging growth company


If an emerging growth company, indicate by check mark if the registrant has elected not to use the extended transition period for complying with any new or revised financial accounting standards provided pursuant to Section 13(a) of the Exchange Act.

Indicate by check mark whether the registrant is a shell company (as defined in Rule 12b-2 of the Exchange Act).

Yes  No 


At April 28, 2024, 275,570,318 shares of common stock, $1 par value, of the registrant were outstanding.

PART I. FINANCIAL INFORMATION

Item 1.FINANCIAL STATEMENTS

DEERE & COMPANY

STATEMENTS OF CONSOLIDATED INCOME

For the Three and Six Months Ended April 28, 2024 and April 30, 2023

(In millions of dollars and shares except per share amounts) Unaudited

Three Months Ended

Six Months Ended


2024


2023


2024


2023


Net Sales and Revenues

Net sales


$

13,610

$

16,079


$

24,097

$

27,481

Finance and interest income

1,387


1,079

2,746


2,073

Other income

238


229

577


484

Total

15,235


17,387

27,420


30,038

Costs and Expenses

Cost of sales

9,157


10,730

16,357


18,663

Research and development expenses

565


547

1,098


1,043

Selling, administrative and general expenses

1,265


1,330

2,330


2,283

Interest expense

836


569

1,638


1,049

Other operating expenses

295


363

664


660

Total

12,118


13,539

22,087


23,698

Income of Consolidated Group before Income Taxes

3,117


3,848

5,333


6,340

Provision for income taxes

751


991

1,220


1,528

Income of Consolidated Group

2,366


2,857

4,113


4,812

Equity in income of unconsolidated affiliates

2


2

3


3

Net Income

2,368


2,859

4,116


4,815

Less: Net loss attributable to noncontrolling interests

(2)


(1)

(5)


(4)

Net Income Attributable to Deere & Company


$

2,370

$

2,860


$

4,121

$

4,819

Per Share Data

Basic


$

8.56

$

9.69


$

14.80

$

16.26

Diluted


8.53

9.65


14.74

16.18

Dividends declared

1.47

1.25

2.94

2.45

Dividends paid

1.47

1.20

2.82

2.33

Average Shares Outstanding

Basic

276.8


295.1

278.4


296.3

Diluted

277.9


296.5

279.5


297.8

See Condensed Notes to Interim Consolidated Financial Statements.

2

DEERE & COMPANY

STATEMENTS OF CONSOLIDATED COMPREHENSIVE INCOME

For the Three and Six Months Ended April 28, 2024 and April 30, 2023

(In millions of dollars) Unaudited

Three Months Ended

Six Months Ended


2024


2023


2024


2023


Net Income


$

2,368

$

2,859


$

4,116

$

4,815

Other Comprehensive Income (Loss), Net of Income Taxes

Retirement benefits adjustment

(87)


(247)

(108)


(258)

Cumulative translation adjustment

(217)


100

57


781

Unrealized gain (loss) on derivatives

8


(18)

(7)


(31)

Unrealized gain (loss) on debt securities

(12)


(1)

1


26

Other Comprehensive Income (Loss), Net of Income Taxes

(308)


(166)

(57)


518

Comprehensive Income of Consolidated Group

2,060


2,693

4,059


5,333

Less: Comprehensive income (loss) attributable to noncontrolling interests

(3)


1

(4)


6

Comprehensive Income Attributable to Deere & Company


$

2,063

$

2,692


$

4,063

$

5,327

See Condensed Notes to Interim Consolidated Financial Statements.

3

DEERE & COMPANY

CONDENSED CONSOLIDATED BALANCE SHEETS

(In millions of dollars) Unaudited


April 28


October 29


April 30


2024

2023

2023


Assets

Cash and cash equivalents


$

5,553

$

7,458

$

5,267

Marketable securities

1,094


946


856

Trade accounts and notes receivable – net

8,880


7,739


9,971

Financing receivables – net

45,278


43,673


38,954

Financing receivables securitized – net

7,262


7,335


5,659

Other receivables

2,535


2,623


2,593

Equipment on operating leases – net

6,965


6,917


6,524

Inventories

8,443


8,160


9,713

Property and equipment – net

7,034


6,879


6,288

Goodwill

3,936


3,900


3,963

Other intangible assets – net

1,064


1,133


1,222

Retirement benefits

3,056


3,007


3,519

Deferred income taxes

1,936


1,814


1,308

Other assets

2,592


2,503


2,510

Total Assets


$

105,628

$

104,087

$

98,347

Liabilities and Stockholders’ Equity

Liabilities

Short-term borrowings

$

17,699

$

17,939

$

17,109

Short-term securitization borrowings

6,976


6,995


5,379

Accounts payable and accrued expenses

14,609


16,130


14,716

Deferred income taxes

491


520


511

Long-term borrowings

40,962


38,477


35,611

Retirement benefits and other liabilities

2,105


2,140


2,520

Total liabilities

82,842


82,201


75,846

Commitments and contingencies (Note 16)

Redeemable noncontrolling interest

98

97

102

Stockholders’ Equity

Common stock, $1 par value (issued shares at April 28, 2024 – 536,431,204)

5,391


5,303


5,227

Common stock in treasury

(33,764)


(31,335)


(26,630)

Retained earnings

54,228


50,931


46,336

Accumulated other comprehensive income (loss)

(3,171)


(3,114)


(2,538)

Total Deere & Company stockholders’ equity

22,684


21,785


22,395

Noncontrolling interests

4


4


4

Total stockholders’ equity

22,688


21,789


22,399

Total Liabilities and Stockholders’ Equity

$

105,628

$

104,087

$

98,347

See Condensed Notes to Interim Consolidated Financial Statements.

4

DEERE & COMPANY

STATEMENTS OF CONSOLIDATED CASH FLOWS

For the Six Months Ended April 28, 2024 and April 30, 2023

(In millions of dollars) Unaudited


2024


2023


Cash Flows from Operating Activities


Net income


$

4,116

$

4,815

Adjustments to reconcile net income to net cash provided by (used for) operating activities:

Provision (credit) for credit losses

131


(89)

Provision for depreciation and amortization

1,045


995

Other non-cash adjustments (Note 21)


173

Share-based compensation expense

104


54

Credit for deferred income taxes

(120)


(377)

Changes in assets and liabilities:

Receivables related to sales

(2,469)


(4,407)

Inventories

(409)


(982)

Accounts payable and accrued expenses

(1,300)


(313)

Accrued income taxes payable/receivable

(29)


(96)

Retirement benefits

(208)


(68)

Other

83


148

Net cash provided by (used for) operating activities

944


(147)

Cash Flows from Investing Activities

Collections of receivables (excluding receivables related to sales)

13,703


12,593

Proceeds from maturities and sales of marketable securities

200


98

Proceeds from sales of equipment on operating leases

1,011


993

Cost of receivables acquired (excluding receivables related to sales)

(14,091)


(13,451)

Purchases of marketable securities

(432)


(188)

Purchases of property and equipment

(719)


(584)

Cost of equipment on operating leases acquired

(1,369)


(1,229)

Collateral on derivatives – net

96

367

Other

(69)


(93)

Net cash used for investing activities

(1,670)


(1,494)

Cash Flows from Financing Activities

Net proceeds in short-term borrowings (original maturities three months or less)

58


3,992

Proceeds from borrowings issued (original maturities greater than three months)

10,189


4,868

Payments of borrowings (original maturities greater than three months)

(8,139)


(3,567)

Repurchases of common stock

(2,422)


(2,546)

Dividends paid

(796)


(697)

Other

(52)


(33)

Net cash provided by (used for) financing activities

(1,162)


2,017

Effect of Exchange Rate Changes on Cash, Cash Equivalents, and Restricted Cash

(5)


70

Net Increase (Decrease) in Cash, Cash Equivalents, and Restricted Cash

(1,893)

446

Cash, Cash Equivalents, and Restricted Cash at Beginning of Period

7,620


4,941

Cash, Cash Equivalents, and Restricted Cash at End of Period

$

5,727

$

5,387

Components of Cash, Cash Equivalents, and Restricted Cash

Cash and cash equivalents

$

5,553

$

5,267

Restricted cash (Other assets)

174

120

Total Cash, Cash Equivalents, and Restricted Cash

$

5,727

$

5,387

See Condensed Notes to Interim Consolidated Financial Statements.

5

DEERE & COMPANY

STATEMENTS OF CHANGES IN CONSOLIDATED STOCKHOLDERS’ EQUITY

For the Three and Six Months Ended April 28, 2024 and April 30, 2023

(In millions of dollars) Unaudited

Total Stockholders’ Equity

Deere & Company Stockholders


Accumulated

Total

Other

Redeemable

Stockholders’

Common

Treasury

Retained

Comprehensive

Noncontrolling

Noncontrolling


Equity


Stock


Stock


Earnings


Income (Loss)


Interests


Interest


Three Months Ended April 30, 2023

Balance January 29, 2023


$

21,336

$

5,191

$

(25,333)

$

43,846

$

(2,372)

$

4

$

100

Net income (loss)


2,861

2,860

1

(2)

Other comprehensive income (loss)


(166)

(166)

2

Repurchases of common stock


(1,301)

(1,301)

Treasury shares reissued


4

4

Dividends declared


(370)

(369)

(1)

Share based awards and other


35

36

(1)

2

Balance April 30, 2023

$

22,399

$

5,227

$

(26,630)

$

46,336

$

(2,538)

$

4

$

102

Six Months Ended April 30, 2023


Balance October 30, 2022


$

20,265

$

5,165

$

(24,094)

$

42,247

$

(3,056)

$

3

$

92


Net income (loss)


4,820

4,819

1

(5)

Other comprehensive income


518

518

10

Repurchases of common stock


(2,558)

(2,558)

Treasury shares reissued


22

22

Dividends declared


(726)

(725)

(1)

Share based awards and other


58

62

(5)

1

5

Balance April 30, 2023

$

22,399

$

5,227

$

(26,630)

$

46,336

$

(2,538)

$

4

$

102

Three Months Ended April 28, 2024

Balance January 28, 2024

$

22,079

$

5,335

$

(32,663)

$

52,266

$

(2,863)

$

4

$

100

Net income (loss)

2,371

2,370

1

(3)

Other comprehensive loss

(308)

(308)

(1)

Repurchases of common stock

(1,105)

(1,105)

Treasury shares reissued

4

4

Dividends declared

(407)

(406)

(1)

Share based awards and other

54

56

(2)

2

Balance April 28, 2024

$

22,688

$

5,391

$

(33,764)

$

54,228

$

(3,171)

$

4

$

98

Six Months Ended April 28, 2024

Balance October 29, 2023

$

21,789

$

5,303

$

(31,335)

$

50,931

$

(3,114)

$

4

$

97

Net income (loss)

4,122

4,121

1

(6)

Other comprehensive income (loss)

(57)

(57)

1

Repurchases of common stock

(2,445)

(2,445)

Treasury shares reissued

16

16

Dividends declared

(819)

(818)

(1)

Share based awards and other

82

88

(6)

6

Balance April 28, 2024

$

22,688

$

5,391

$

(33,764)

$

54,228

$

(3,171)

$

4

$

98

See Condensed Notes to Interim Consolidated Financial Statements.

6

Condensed Notes to Interim Consolidated Financial Statements (Unaudited)

(1) Organization and Consolidation

Deere & Company has been developing innovative solutions to help its customers become more profitable for more than 185 years. References to “Deere & Company,” “John Deere,” “we,” “us,” or “our” include our consolidated subsidiaries. We manage our business through the following operating segments: production and precision agriculture (PPA), small agriculture and turf (SAT), construction and forestry (CF), and financial services (FS). References to “agriculture and turf” include both PPA and SAT.

We use a 52/53 week fiscal year with quarters ending on the last Sunday in the reporting period. The second quarter ends for fiscal year 2024 and 2023 were April 28, 2024 and April 30, 2023, respectively. Both second quarters contained 13 weeks, while both year-to-date periods contained 26 weeks. Unless otherwise stated, references to particular years, quarters, or months refer to our fiscal years generally ending in October and the associated periods in those fiscal years.

All amounts are presented in millions of dollars, unless otherwise specified.

(2)  Summary of Significant Accounting Policies and New Accounting PROnouncements

Quarterly Financial Statements

The interim consolidated financial statements of Deere & Company have been prepared by us, without audit, pursuant to the rules and regulations of the U.S. Securities and Exchange Commission (SEC). Certain information and footnote disclosures normally included in annual financial statements prepared in accordance with accounting principles generally accepted in the U.S. have been condensed or omitted as permitted by such rules and regulations. All normal recurring adjustments have been included. Management believes the disclosures are adequate to present fairly the financial position, results of operations, and cash flows at the dates and for the periods presented. It is suggested these interim consolidated financial statements be read in conjunction with the consolidated financial statements and the notes thereto appearing in our latest Annual Report on Form 10-K. Results for interim periods are not necessarily indicative of those to be expected for the fiscal year.

Use of Estimates in Financial Statements

Certain accounting policies require management to make estimates and assumptions in determining the amounts reflected in the financial statements and related disclosures. Actual results could differ from those estimates.

New Accounting Pronouncements

We closely monitor all Accounting Standard Updates (ASUs) issued by the Financial Accounting Standards Board (FASB) and other authoritative guidance.

Accounting Pronouncements Adopted

We adopted the following standards in 2024, none of which had a material effect on our consolidated financial statements.

2022-04 — Liabilities – Supplier Finance Programs (Subtopic 405-50): Disclosure of Supplier Finance Program Obligations

2022-02 — Financial Instruments – Credit Losses (Topic 326): Troubled Debt Restructurings and Vintage Disclosures

2022-01 — Derivatives and Hedging (Topic 815): Fair Value Hedging – Portfolio Layer Method

2021-08 — Business Combinations (Topic 805): Accounting for Contract Assets and Contract Liabilities from Contracts with Customers

Accounting Pronouncements to be Adopted

In March 2024, the SEC adopted rules to enhance and standardize climate-related disclosures in annual reports and registration statements. The new rules will be effective for our annual reporting periods beginning in fiscal year 2026. In April 2024, the SEC stayed implementation of the climate-related disclosure requirements pending completion of legal challenges. We are monitoring these developments while assessing the effect of these rules on our related disclosures.

In December 2023, the FASB issued ASU 2023-09, Income Taxes (Topic 740): Improvements to Income Tax Disclosures, which expands disclosures in an entity’s income tax rate reconciliation table and cash taxes paid both in the U.S. and foreign jurisdictions. The effective date of the ASU is fiscal year 2026. We are assessing the effect of this update on our related disclosures.

7

We will also adopt the following standards in future periods, none of which are expected to have a material effect on our consolidated financial statements.

2023-07 — Segment Reporting (Topic 280): Improvements to Reportable Segment Disclosures

2023-06 — Disclosure Improvements: Codification Amendments in Response to the SEC’s Disclosure Update and Simplification Initiative

2023-05 — Business Combinations – Joint Venture Formations (Subtopic 805-60): Recognition and Initial Measurement

2022-03 — Fair Value Measurement (Topic 820): Fair Value Measurement of Equity Securities Subject to Contractual Sale Restrictions


(3)  Revenue Recognition

Our net sales and revenues by primary geographic market, major product line, and timing of revenue recognition follow:

Three Months Ended April 28, 2024


Production & Precision Ag


Small Ag & Turf


Construction
& Forestry


Financial
Services


Total

Primary geographic markets:


United States

$

3,881

$

1,842

$

2,500

$

996

$

9,219

Canada

600

167

242


175


1,184

Western Europe

659

688

470


40


1,857

Central Europe and CIS

275

80

91


8


454

Latin America

850

103

334


122


1,409

Asia, Africa, Oceania, and Middle East

414

373

271

54

1,112

Total

$

6,679

$

3,253

$

3,908

$

1,395

$

15,235

Major product lines:


Production agriculture

$

6,507

$

6,507

Small agriculture

$

2,098


2,098

Turf

1,017


1,017

Construction

$

1,736


1,736

Compact construction

695

695

Roadbuilding

1,080


1,080

Forestry

271


271

Financial products

39

32

17

$

1,395


1,483

Other

133

106

109


348

Total

$

6,679

$

3,253

$

3,908

$

1,395

$

15,235

Revenue recognized:


At a point in time

$

6,609

$

3,213

$

3,882

$

35

$

13,739

Over time

70

40

26

1,360

1,496

Total

$

6,679

$

3,253

$

3,908

$

1,395

$

15,235

8


Six Months Ended April 28, 2024

Production & Precision Ag


Small Ag & Turf


Construction
& Forestry


Financial
Services


Total

Primary geographic markets:

United States

$

6,602

$

3,187

$

4,596

$

1,965

$

16,350

Canada

986

285

452


347


2,070

Western Europe

1,162

1,205

831


80


3,278

Central Europe and CIS

454

153

185


16


808

Latin America

1,669

201

590


252


2,712

Asia, Africa, Oceania, and Middle East

849

714

529

110

2,202

Total

$

11,722

$

5,745

$

7,183

$

2,770

$

27,420

Major product lines:


Production agriculture

$

11,298

$

11,298

Small agriculture

$

3,816


3,816

Turf

1,666


1,666

Construction

$

3,220


3,220

Compact construction

1,321

1,321

Roadbuilding

1,843


1,843

Forestry

563


563

Financial products

99

58

35

$

2,770


2,962

Other

325

205

201


731

Total

$

11,722

$

5,745

$

7,183

$

2,770

$

27,420

Revenue recognized:


At a point in time

$

11,564

$

5,669

$

7,126

$

62

$

24,421

Over time

158

76

57

2,708

2,999

Total

$

11,722

$

5,745

$

7,183

$

2,770

$

27,420

Three Months Ended April 30, 2023


Production & Precision Ag


Small Ag & Turf


Construction
& Forestry


Financial
Services


Total

Primary geographic markets:


United States

$

4,058

$

2,241

$

2,561

$

766

$

9,626

Canada

546

189

302


153


1,190

Western Europe

758

888

492

31


2,169

Central Europe and CIS

393

212

90

8


703

Latin America

1,543

201

388

106


2,238

Asia, Africa, Oceania, and Middle East

614

469

335

43

1,461

Total

$

7,912

$

4,200

$

4,168

$

1,107

$

17,387

Major product lines:


Production agriculture

$

7,733

$

7,733

Small agriculture

$

2,952


2,952

Turf

1,099


1,099

Construction

$

1,813


1,813

Compact construction

663

663

Roadbuilding

1,134


1,134

Forestry

429


429

Financial products

29

20

12

$

1,107


1,168

Other

150

129

117


396

Total

$

7,912

$

4,200

$

4,168

$

1,107

$

17,387

Revenue recognized:


At a point in time

$

7,861

$

4,171

$

4,146

$

27

$

16,205

Over time

51

29

22

1,080

1,182

Total

$

7,912

$

4,200

$

4,168

$

1,107

$

17,387

9

Six Months Ended April 30, 2023


Production & Precision Ag


Small Ag & Turf


Construction
& Forestry


Financial
Services


Total

Primary geographic markets:

United States

$

6,686

$

3,906

$

4,461

$

1,479

$

16,532

Canada

906

335

577

303


2,121

Western Europe

1,259

1,452

857

60


3,628

Central Europe and CIS

595

335

165

20


1,115

Latin America

2,780

357

727

201


4,065

Asia, Africa, Oceania, and Middle East

989

869

635

84

2,577

Total

$

13,215

$

7,254

$

7,422

$

2,147

$

30,038

Major product lines:


Production agriculture

$

12,845

$

12,845

Small agriculture

$

5,146


5,146

Turf

1,818


1,818

Construction

$

3,295


3,295

Compact construction

1,136

1,136

Roadbuilding

1,952


1,952

Forestry

785


785

Financial products

60

38

25

$

2,147


2,270

Other

310

252

229


791

Total

$

13,215

$

7,254

$

7,422

$

2,147

$

30,038

Revenue recognized:


At a point in time

$

13,109

$

7,200

$

7,375

$

50

$

27,734

Over time

106

54

47

2,097

2,304

Total

$

13,215

$

7,254

$

7,422

$

2,147

$

30,038

We invoice in advance of recognizing the sale of certain products and the revenue for certain services. These relate to extended warranty premiums, advance payments for future equipment sales, and subscription and service revenue related to precision guidance, telematic services, and other information enabled solutions. These advanced customer payments are presented as deferred revenue, a contract liability, in “Accounts payable and accrued expenses.” The deferred revenue received, but not recognized in revenue, was $1,911, $1,697, and $1,622 at April 28, 2024, October 29, 2023, and April 30, 2023, respectively. The contract liability is reduced as the revenue is recognized. During the three months ended April 28, 2024 and April 30, 2023, $128 and $129, respectively, of revenue was recognized from deferred revenue that was recorded as a contract liability at the beginning of the respective fiscal year. During the six months ended April 28, 2024 and April 30, 2023, $358 and $343, respectively, of revenue was recognized from deferred revenue that was recorded as a contract liability at the beginning of the respective fiscal year.

The amount of unsatisfied performance obligations for contracts with an original duration greater than one year was $1,633 at April 28, 2024. The estimated revenue to be recognized by fiscal year follows: remainder of 2024 – $297, 2025 – $438, 2026 – $352, 2027 – $224, 2028 – $137, 2029 – $97, and later years – $88. As permitted, we elected only to disclose remaining performance obligations with an original contract duration greater than one year. The contracts with an expected duration of one year or less are for sales to dealers and retail customers for equipment, service parts, repair services, and certain telematics services.

(4)Other Comprehensive Income Items

The after-tax components of accumulated other comprehensive income (loss) follow:

April 28

October 29

April 30

2024

2023

2023

Retirement benefits adjustment

$

(953)

$

(845)

$

(647)

Cumulative translation adjustment

(2,094)

(2,151)

(1,813)

Unrealized gain (loss) on derivatives

(15)

(8)

(10)

Unrealized gain (loss) on debt securities

(109)

(110)

(68)

Total accumulated other comprehensive income (loss)

$

(3,171)

$

(3,114)

$

(2,538)

10

The following tables reflect amounts recorded in other comprehensive income (loss), as well as reclassifications out of other comprehensive income (loss).


Before


Tax


After


Tax

(Expense)

Tax


Three Months Ended April 28, 2024

Amount

Credit

Amount


Cumulative translation adjustment


$

(217)


$

(217)

Unrealized gain (loss) on derivatives:

Unrealized hedging gain (loss)

26

$

(5)

21

Reclassification of realized (gain) loss to:

Interest rate contracts – Interest expense

(16)

3

(13)

Net unrealized gain (loss) on derivatives

10

(2)

8

Unrealized gain (loss) on debt securities:

Unrealized holding gain (loss)

(13)

1

(12)

Net unrealized gain (loss) on debt securities

(13)

1

(12)

Retirement benefits adjustment:

Net actuarial gain (loss)

(109)

26

(83)

Reclassification to Other operating expenses through amortization of:

Actuarial (gain) loss

(16)

5

(11)

Prior service (credit) cost

9

(3)

6

Settlements

1

1

Net unrealized gain (loss) on retirement benefits adjustment

(115)

28

(87)

Total other comprehensive income (loss)


$

(335)

$

27

$

(308)


Before


Tax


After


Tax

(Expense)

Tax


Six Months Ended April 28, 2024

Amount

Credit

Amount


Cumulative translation adjustment


$

56

$

1

$

57

Unrealized gain (loss) on derivatives:

Unrealized hedging gain (loss)

18

(3)

15

Reclassification of realized (gain) loss to:

Interest rate contracts – Interest expense

(27)

5

(22)

Net unrealized gain (loss) on derivatives

(9)

2

(7)

Unrealized gain (loss) on debt securities:

Unrealized holding gain (loss)

(12)

7

(5)

Reclassification of realized (gain) loss – Other income

8

(2)

6

Net unrealized gain (loss) on debt securities

(4)

5

1

Retirement benefits adjustment:

Net actuarial gain (loss)

(126)

30

(96)

Reclassification to Other operating expenses through amortization of:

Actuarial (gain) loss

(36)

10

(26)

Prior service (credit) cost

18

(5)

13

Settlements

1

1

Net unrealized gain (loss) on retirement benefits adjustment

(143)

35

(108)

Total other comprehensive income (loss)


$

(100)

$

43

$

(57)

11


Before


Tax


After


Tax

(Expense)

Tax


Three Months Ended April 30, 2023

Amount

Credit

Amount


Cumulative translation adjustment


$

100

$

100

Unrealized gain (loss) on derivatives:

Unrealized hedging gain (loss)

(4)

$

1

(3)

Reclassification of realized (gain) loss to:

Interest rate contracts – Interest expense

(19)

4

(15)

Net unrealized gain (loss) on derivatives

(23)

5

(18)

Unrealized gain (loss) on debt securities:

Unrealized holding gain (loss)

(2)

1

(1)

Net unrealized gain (loss) on debt securities

(2)

1

(1)

Retirement benefits adjustment:

Net actuarial gain (loss)

(349)

83

(266)

Reclassification to Other operating expenses through amortization of:

Actuarial (gain) loss

(20)

5

(15)

Prior service (credit) cost

10

(2)

8

Settlements

36

(10)

26

Net unrealized gain (loss) on retirement benefits adjustment

(323)

76

(247)

Total other comprehensive income (loss)


$

(248)

$

82

$

(166)


Before


Tax


After


Tax

(Expense)

Tax


Six Months Ended April 30, 2023

Amount

Credit

Amount


Cumulative translation adjustment


$

771

$

10

$

781

Unrealized gain (loss) on derivatives:

Unrealized hedging gain (loss)

(5)

1

(4)

Reclassification of realized (gain) loss to:

Interest rate contracts – Interest expense

(34)

7

(27)

Net unrealized gain (loss) on derivatives

(39)

8

(31)

Unrealized gain (loss) on debt securities:

Unrealized holding gain (loss)

33

(7)

26

Net unrealized gain (loss) on debt securities

33

(7)

26

Retirement benefits adjustment:

Net actuarial gain (loss)

(350)

83

(267)

Reclassification to Other operating expenses through amortization of:

Actuarial (gain) loss

(41)

10

(31)

Prior service (credit) cost

19

(5)

14

Settlements

36

(10)

26

Net unrealized gain (loss) on retirement benefits adjustment

(336)

78

(258)

Total other comprehensive income (loss)


$

429

$

89

$

518


(5)Earnings Per Share

A reconciliation of basic and diluted net income per share attributable to Deere & Company follows in millions, except per share amounts:


Three Months Ended 

Six Months Ended


April 28

April 30

April 28

April 30


2024

2023

2024

2023


Net income attributable to Deere & Company


$

2,370


$

2,860


$

4,121


$

4,819

Average shares outstanding

276.8


295.1

278.4


296.3

Basic per share

$

8.56

$

9.69

$

14.80

$

16.26

Average shares outstanding

276.8


295.1

278.4


296.3

Effect of dilutive stock options and restricted stock awards

1.1


1.4

1.1


1.5

Total potential shares outstanding

277.9


296.5

279.5


297.8

Diluted per share

$

8.53

$

9.65

$

14.74

$

16.18

Shares excluded from EPS calculation, as antidilutive

.4

.2

.3

.1

12

(6)Pension and Other Postretirement Benefits

We have several funded and unfunded defined benefit pension plans and other postretirement benefit (OPEB) plans. These plans cover U.S. employees and certain foreign employees. The components of net periodic pension and OPEB (benefit) cost consisted of the following:


Three Months Ended

Six Months Ended


April 28

April 30

April 28

April 30


2024

2023

2024

2023


Pensions:

Service cost


$

57


$

64


$

115


$

124

Interest cost

138


134

274


267

Expected return on plan assets

(241)


(220)

(482)


(432)

Amortization of actuarial gain

(5)


(6)

(9)


(11)

Amortization of prior service cost

10


10

20


20

Settlements

1


36

1


36

Net (benefit) cost

$

(40)

$

18

$

(81)

$

4

OPEB:

Service cost


$

4


$

6


$

9


$

13

Interest cost

44


45

87


88

Expected return on plan assets

(27)


(29)

(54)


(58)

Amortization of actuarial gain

(11)


(14)

(27)


(30)

Amortization of prior service credit

(1)


(2)


(1)

Net cost

$

9

$

8

$

13

$

12

The components of net periodic pension and OPEB (benefit) cost excluding the service cost component are included in the line item “Other operating expenses.”

During the first six months of 2024, we contributed and expect to contribute the following amounts to our pension and OPEB plans.

Pensions

OPEB

Contributed


$

46


$

96


Expected contributions remainder of the year

39


44

13

(7)Segment DATA

Information relating to operations by operating segment follows:


Three Months Ended 

Six Months Ended 


April 28

April 30

%

April 28

April 30

%


  2024   

  2023   

Change

   2024   

   2023   

Change


Net sales and revenues:


Production & precision ag net sales


$

6,581

$

7,822

-16


$

11,430

$

13,021

-12

Small ag & turf net sales

3,185

4,145

-23

5,610

7,146

-21

Construction & forestry net sales

3,844


4,112

-7

7,057


7,314

-4

Financial services revenues

1,395


1,107

+26

2,770


2,147

+29

Other revenues

230


201

+14

553


410

+35

Total net sales and revenues


$

15,235

$

17,387

-12


$

27,420

$

30,038

-9

Operating profit:

Production & precision ag


$

1,650

$

2,170

-24


$

2,695

$

3,378

-20

Small ag & turf

571

849

-33

897

1,296

-31

Construction & forestry

668


838

-20

1,234


1,463

-16

Financial services

209


41

+410

466


279

+67

Total operating profit

3,098


3,898

-21

5,292


6,416

-18

Reconciling items

23


(47)

49


(69)

Income taxes

(751)


(991)

-24

(1,220)


(1,528)

-20

Net income attributable to Deere & Company


$

2,370

$

2,860

-17


$

4,121

$

4,819

-14

Intersegment sales and revenues:

Production & precision ag net sales


$

7

$

8

-13


$

14

$

12

+17

Small ag & turf net sales

1

4

-75

2

7

-71

Construction & forestry net sales


Financial services revenues

193


190

+2

370


395

-6

Operating profit for PPA, SAT, and CF is income from continuing operations before corporate expenses, certain external interest expenses, certain foreign exchange gains and losses, and income taxes. Operating profit of financial services includes the effect of interest expense and foreign exchange gains and losses. Reconciling items to net income are primarily corporate expenses, certain interest income and expenses, certain foreign exchange gains and losses, pension and OPEB benefit (cost) amounts excluding the service cost component, equity in income of unconsolidated affiliates, and net income attributable to noncontrolling interests.

Identifiable operating assets were as follows:


April 28


October 29

April 30


2024

2023

2023


Production & precision ag


$

9,026

$

8,734

$

9,504

Small ag & turf

4,421

4,348

4,743

Construction & forestry

7,337


7,139


7,299

Financial services

73,834


70,732


65,233

Corporate

11,010


13,134


11,568

Total assets


$

105,628

$

104,087

$

98,347


(8)Financing Receivables

We monitor the credit quality of financing receivables based on delinquency status, defined as follows:

Past due balances represent any payments 30 days or more past the due date.
Non-performing financing receivables represent receivables for which we have stopped accruing finance income. This generally occurs when receivables are 90 days delinquent.
Write-offs generally occur when receivables are 120 days delinquent. In these situations, the estimated uncollectible amount is written off to the allowance for credit losses. Any expected recovery is presented as non-performing.

14

The credit quality analysis of retail notes, financing leases, and revolving charge accounts (collectively, retail customer receivables) by year of origination was as follows:

April 28, 2024

2024

2023

2022

2021

2020

Prior

Years

Revolving Charge Accounts

Total

Retail customer receivables:


Agriculture and turf

Current

$

7,393

$

11,869

$

6,934

$

3,987

$

1,682

$

696

$

3,662

$

36,223

30-59 days past due

32

99

55

35

15

6

27

269

60-89 days past due

7

44

23

11

6

3

12

106

90+ days past due

3

1

3

5

12

Non-performing

3

83

90

63

31

35

70

375

Construction and forestry

Current

1,619

2,415

1,514

744

207

79

107

6,685

30-59 days past due

25

61

38

20

7

3

5

159

60-89 days past due

7

34

14

10

3

2

2

72

90+ days past due

4

9

1

1

15

Non-performing

5

100

85

47

17

8

2

264

Total retail customer receivables

$

9,091

$

14,712

$

8,763

$

4,921

$

1,973

$

833

$

3,887

$

44,180

October 29, 2023

2023

2022

2021

2020

2019

Prior
Years

Revolving Charge Accounts

Total

Retail customer receivables:


Agriculture and turf

Current

$

15,191

$

8,430

$

5,120

$

2,334

$

853

$

280

$

4,526

$

36,734

30-59 days past due

62

75

39

21

9

3

29

238

60-89 days past due

18

26

18

10

4

2

9

87

90+ days past due

2

1

3

3

9

Non-performing

30

78

62

33

22

22

8

255

Construction and forestry

Current

2,927

1,961

1,084

353

84

29

119

6,557

30-59 days past due

49

34

27

9

4

4

127

60-89 days past due

19

14

12

5

2

2

54

90+ days past due

6

1

1

8

Non-performing

42

80

55

23

9

4

1

214

Total retail customer receivables

$

18,340

$

10,705

$

6,421

$

2,791

$

987

$

341

$

4,698

$

44,283

April 30, 2023

2023

2022

2021

2020

2019

Prior
Years

Revolving Charge Accounts

Total

Retail customer receivables:


Agriculture and turf

Current

$

6,718

$

10,947

$

6,435

$

3,155

$

1,305

$

619

$

3,621

$

32,800

30-59 days past due

10

55

55

31

18

9

16

194

60-89 days past due

2

15

24

19

4

2

8

74

90+ days past due

1

1

2

Non-performing

5

51

51

36

25

29

25

222

Construction and forestry

Current

1,442

2,434

1,490

557

169

56

106

6,254

30-59 days past due

7

35

29

25

21

10

4

131

60-89 days past due

1

8

16

12

14

12

2

65

90+ days past due

7

1

1

2

11

Non-performing

5

71

61

33

12

6

1

189

Total retail customer receivables

$

8,190

$

13,624

$

8,163

$

3,869

$

1,570

$

743

$

3,783

$

39,942

15

The credit quality analysis of wholesale receivables by year of origination was as follows:

April 28, 2024

2024

2023

2022

2021

2020

Prior
Years

Revolving

Total

Wholesale receivables:


Agriculture and turf

Current

$

441

$

322

$

50

$

2

$

2

$

2

$

6,565

$

7,384

30+ days past due

Non-performing

1

1

Construction and forestry

Current

49

15

4

19

1,118

1,205

30+ days past due

Non-performing

Total wholesale receivables

$

490

$

337

$

54

$

21

$

2

$

3

$

7,683

$

8,590

October 29, 2023

2023

2022

2021

2020

2019

Prior
Years

Revolving

Total

Wholesale receivables:


Agriculture and turf

Current

$

631

$

93

$

21

$

4

$

1

$

160

$

5,175

$

6,085

30+ days past due

Non-performing

1

1

Construction and forestry

Current

23

5

20

76

712

836

30+ days past due

Non-performing

Total wholesale receivables

$

654

$

98

$

41

$

4

2

$

236

$

5,887

$

6,922

April 30, 2023

2023

2022

2021

2020

2019

Prior
Years

Revolving

Total

Wholesale receivables:


Agriculture and turf

Current

$

265

$

198

$

36

$

15

$

2

$

1

$

3,653

$

4,170

30+ days past due

Non-performing

1

1

Construction and forestry

Current

10

6

24

1

1

638

680

30+ days past due

Non-performing

Total wholesale receivables

$

275

$

204

$

60

$

16

$

3

$

2

$

4,291

$

4,851

16

An analysis of the allowance for credit losses and investment in financing receivables follows:


Retail Notes

Revolving

& Financing

Charge

Wholesale

Leases

Accounts

Receivables

Total

Three Months Ended April 28, 2024

Allowance:


Beginning of period balance


$

177


$

16

$

2

$

195

Provision

64

23

87

Write-offs

(36)

(23)

(59)

Recoveries

4

5

9

Translation adjustments

(2)

(2)

End of period balance


$

207


$

21

$

2

$

230

Six Months Ended April 28, 2024

Allowance:


Beginning of period balance


$

172


$

21

$

4

$

197

Provision

99

21

120

Write-offs

(68)

(34)

(102)

Recoveries

5

13

18

Translation adjustments

(1)

(2)

(3)

End of period balance


$

207


$

21

$

2

$

230

Financing receivables:

End of period balance


$

40,293


$

3,887

$

8,590

$

52,770


Retail Notes

Revolving


& Financing

Charge

Wholesale


Leases

Accounts

Receivables

Total

Three Months Ended April 30, 2023

Allowance:


Beginning of period balance

$

140


$

16

$

4

$

160

Provision


30

8


38

Write-offs


(19)

(11)


(30)

Recoveries


6

6


12

End of period balance

$

157

$

19

$

4

$

180

Six Months Ended April 30, 2023

Allowance:


Beginning of period balance

$

299


$

22

$

4

$

325

Provision


45

4

49

Provision transferred to held for sale

(142)

(142)

Provision (credit) subtotal

(97)

4

(93)

Write-offs


(37)

(18)

(55)

Recoveries


10

11

21

Translation adjustments

(18)


(18)

End of period balance

$

157

$

19

$

4

$

180

Financing receivables:

End of period balance

$

36,159


$

3,783

$

4,851

$

44,793

The allowance for credit losses increased in the second quarter and first six months of 2024, primarily due to higher expected losses on the agricultural receivable portfolio as a result of elevated delinquencies and a decline in market conditions.

In the first quarter of 2023, we determined that the financial services business in Russia met the held for sale criteria. The financing receivables in Russia were reclassified to “Other assets.” The associated allowance for credit losses was reversed and a valuation allowance for the assets held for sale was recorded. These operations were sold in the second quarter of 2023 (see Note 20). Excluding the portfolio in Russia, the allowance for credit losses increased in the second quarter and the first six months of 2023 primarily due to higher portfolio balances and higher expected losses on turf and construction financing receivables.

17

Write-offs by year of origination were as follows:

Six Months Ended April 28, 2024

2024

2023

2022

2021

2020

Prior Years

Revolving Charge Accounts

Total

Retail customer receivables:


Agriculture and turf

$

1

$

9

$

10

$

5

$

6

$

2

$

30

$

63

Construction and forestry

12

13

5

3

2

4

39

Total retail customer receivables

$

1

$

21

$

23

$

10

$

9

$

4

$

34

$

102

Modifications

We occasionally grant contractual modifications to customers experiencing financial difficulties. Before offering a modification, we evaluate the ability of the customer to meet the modified payment terms. Modifications offered include payment deferrals, term extensions, or a combination thereof. Finance charges continue to accrue during the deferral or extension period. Our allowance for credit losses incorporates historical loss information, including the effects of loan modifications with customers. Therefore, additional adjustments to the allowance are generally not recorded upon modification of a loan.

The ending amortized cost of modified loans with borrowers experiencing financial difficulty during the second quarter and the six months ended April 28, 2024 were $36 and $53, respectively, of which $48 were current, $3 were 30-59 days past due, and $2 were non-performing. These modifications represented 0.07 and 0.10 percent of our financing receivable portfolio for the same periods, respectively.

Defaults and subsequent write-offs of loans modified in the prior twelve months were not significant during the second quarter and the first six months of 2024. In addition, at April 28, 2024, commitments to provide additional financing to these customers were not significant.

(9)Securitization of Financing Receivables

Our funding strategy includes receivable securitizations, which allows us to receive cash for financing receivables immediately. While these securitization programs are administered in various forms, they are accomplished in the following basic steps:

1.We transfer financing receivables into a bankruptcy-remote special purpose entity (SPE).
2.The SPE issues debt to investors. The debt is secured by the financing receivables.
3.Investors are paid back based on cash receipts from the financing receivables.

As part of step 1, these receivables are legally isolated from the claims of our general creditors. This ensures cash receipts from the financing receivables are accessible to pay back securitization program investors. The structure of these transactions does not meet the accounting criteria for a sale of receivables. As a result, they are accounted for as a secured borrowing. The receivables and borrowings remain on our balance sheet and are separately reported as “Financing receivables securitized – net” and “Short-term securitization borrowings,” respectively.

The components of securitization programs were as follows:


April 28


October 29


April 30


2024

2023

2023


Financing receivables securitized (retail notes)


$

7,289

$

7,357

$

5,674

Allowance for credit losses

(27)


(22)


(15)

Other assets (primarily restricted cash)

164


152


115

Total restricted securitized assets


$

7,426

$

7,487

$

5,774

Short-term securitization borrowings

$

6,976

$

6,995

$

5,379

Accrued interest on borrowings

12

13


8

Total liabilities related to restricted securitized assets

$

6,988

$

7,008

$

5,387


18

(10)  Inventories

A majority of inventories owned by us are valued at cost on the “last-in, first-out” (LIFO) basis. If all inventories had been valued on a “first-in, first-out” (FIFO) basis, the estimated inventories by major classification would have been as follows:


April 28


October 29


April 30


2024

2023

2023


Raw materials and supplies


$

3,851

$

4,080

$

4,647

Work-in-process

1,127


1,010


1,262

Finished goods and parts

5,979


5,435


6,435

Total FIFO value

10,957


10,525


12,344

Excess of FIFO over LIFO

2,514


2,365


2,631

Inventories


$

8,443

$

8,160

$

9,713


(11)  Goodwill and Other Intangible Assets – Net

The changes in amounts of goodwill by operating segments were as follows. There were no accumulated goodwill impairment losses.


Production &


Small Ag


Construction


Precision Ag

& Turf

& Forestry

Total


Goodwill at October 30, 2022


$

646

$

318

$

2,723

$

3,687

Acquisition


41

41

Translation adjustments


18

8

209

235

Goodwill at April 30, 2023

$

705

$

326

$

2,932

$

3,963

Goodwill at October 29, 2023

$

702

$

363

$

2,835

$

3,900

Translation adjustments

1

1

34

36

Goodwill at April 28, 2024

$

703

$

364

$

2,869

$

3,936

The components of other intangible assets were as follows:


April 28


October 29


April 30


2024

2023

2023


Customer lists and relationships

$

505

$

501

$

525

Technology, patents, trademarks, and other

1,404


1,387


1,397

Total at cost

1,909


1,888


1,922

Less accumulated amortization:


Customer lists and relationships

213

195

193

Technology, patents, trademarks, and other

632

560

507

Total accumulated amortization

845

755

700

Other intangible assets – net

$

1,064

$

1,133

$

1,222

The amortization of other intangible assets in the second quarter and the first six months of 2024 was $41 and $83, and for the second quarter and the first six months of 2023 was $45 and $84, respectively. The estimated amortization expense for the next five years is as follows: remainder of 2024 – $89, 2025 – $144, 2026 – $120, 2027 – $119, 2028 – $86, and 2029 – $73.


(12)  Short-Term Borrowings

Short-term borrowings were as follows:

April 28

October 29

April 30


2024


2023


2023

Commercial paper

$

7,675

$

9,100

$

9,184

Notes payable to banks

434

483

284

Finance lease obligations due within one year

30

25

23

Long-term borrowings due within one year


9,560


8,331


7,618

Short-term borrowings

$

17,699

$

17,939

$

17,109


19

(13)  Accounts Payable and Accrued Expenses

Accounts payable and accrued expenses consisted of the following:


April 28


October 29


April 30


2024

2023

2023

Accounts payable:


Trade payables

$

2,968


$

3,467


$

3,680

Dividends payable


409


388


371

Operating lease liabilities

270

281

294

Deposits withheld from dealers and merchants

159

163

157

Payables to unconsolidated affiliates

8

6

9

Other


184


153


131

Accrued expenses:

Employee benefits


1,550


2,152


1,475

Product warranties


1,566


1,610


1,562

Accrued taxes

1,453

1,558

1,691

Derivative liabilities

1,005

1,130

758

Dealer sales discounts


546


1,243


605

Extended warranty premium

1,110

1,021

949

Unearned revenue (contractual liability)


801


676


673

Unearned operating lease revenue

483

451

441

Accrued interest

513

434

354

Parts return liability

404

392

376

Other


1,180


1,005


1,190

Accounts payable and accrued expenses


$

14,609


$

16,130

$

14,716

Amounts are presented net of eliminations, which primarily consist of dealer sales incentives with a right of set-off against trade receivables of $2,650 at April 28, 2024, $2,228 at October 29, 2023, and $1,979 at April 30, 2023. Other eliminations were made for accrued taxes and other accrued expenses.

(14)  Long-Term Borrowings

Long-term borrowings consisted of:

April 28

October 29

April 30


2024


2023


2023

Underwritten term debt


U.S. dollar notes and debentures:

2.75% notes due 2025

$

700

$

700

6.55% debentures due 2028

$

200


200


200

5.375% notes due 2029


500


500


500

3.10% notes due 2030

700

700

700

8.10% debentures due 2030


250


250


250

7.125% notes due 2031


300


300


300

3.90% notes due 2042


1,250


1,250


1,250

2.875% notes due 2049

500

500

500

3.75% notes due 2050

850

850

850

Euro notes:

1.85% notes due 2028 (€600 principal)

644

634

662

2.20% notes due 2032 (€600 principal)

644

634

662

1.65% notes due 2039 (€650 principal)

697

687

717

Serial issuances

Medium-term notes


32,859

29,638

26,734

Other notes and finance lease obligations


1,708


1,769


1,707

Less debt issuance costs and debt discounts

(140)

(135)

(121)

Long-term borrowings


$

40,962

$

38,477

$

35,611


Medium-term notes due through 2034 are primarily offered by prospectus and issued at fixed and variable rates. The principal balances of the medium-term notes were $34,002, $30,902, and $27,428, at April 28, 2024, October 29, 2023, and April 30, 2023, respectively. All outstanding notes and debentures are senior unsecured borrowings and rank equally with each other.

20

(15)  Leases - Lessor

We lease equipment manufactured or sold by us through John Deere Financial. Sales-type and direct financing leases are reported in “Financing receivables – net.” Operating leases are reported in “Equipment on operating leases – net.”

Lease revenues earned by us follow:

Three Months Ended

Six Months Ended

April 28

April 30

April 28

April 30

2024

2023

2024

2023

Sales-type and direct finance lease revenues

$

45

$

37

$

91

$

79

Operating lease revenues

343

321

682

642

Variable lease revenues

4

5

9

11

Total lease revenues

$

392

$

363

$

782

$

732


(16)  Commitments and Contingencies

A standard warranty is provided as assurance that the equipment will function as intended. The standard warranty period varies by product and region. At the time a sale is recognized, we record an estimate of future warranty costs based on historical claims rate experience and estimated population under warranty.

The reconciliation of the changes in the warranty liability follows:


Three Months Ended

Six Months Ended


April 28

April 30

April 28

April 30


2024

2023

2024

2023


Beginning of period balance


$

1,589


$

1,444


$

1,610


$

1,427

Warranty claims paid

(324)


(274)

(634)


(536)

New product warranty accruals

310


386

591


642

Foreign exchange

(9)


6

(1)


29

End of period balance

$

1,566

$

1,562

$

1,566

$

1,562

The costs for extended warranty programs are recognized as incurred.

In certain international markets, we provide guarantees to banks for the retail financing of John Deere equipment. At April 28, 2024, the notional value of these guarantees was $146. We may repossess the equipment collateralizing the receivables. At April 28, 2024, the accrued losses under these agreements were not material.

We also had other miscellaneous contingent liabilities and guarantees totaling approximately $140 at April 28, 2024. The accrued liability for these contingencies was $20 at April 28, 2024.

At April 28, 2024, we had commitments of approximately $560 for the construction and acquisition of property and equipment. Also, at April 28, 2024, we had restricted assets of $225, classified as “Other assets.”

We are subject to various unresolved legal actions. The accrued losses on these matters were not material at April 28, 2024. We believe the reasonably possible range of losses for these unresolved legal actions would not have a material effect on our financial statements. The most prevalent legal claims relate to product liability (including asbestos-related liability), retail credit, employment, patent, trademark, and antitrust matters.

(17)  Fair Value Measurements

The fair values of financial instruments that do not approximate the carrying values were as follows. Long-term borrowings exclude finance lease liabilities.


April 28, 2024

October 29, 2023

April 30, 2023


Carrying
Value

Fair
Value

Carrying
Value

Fair
Value

Carrying
Value

Fair
Value


Financing receivables – net

$

45,278

$

44,741

$

43,673

$

42,777

$

38,954

$

38,337

Financing receivables securitized – net

7,262

7,063

7,335

7,056

5,659

5,494

Short-term securitization borrowings

6,976

6,935

6,995

6,921

5,379

5,271

Long-term borrowings due within one year

9,560

9,434

8,331

8,156

7,618

7,461

Long-term borrowings

40,882

40,059

38,428

36,873

35,571

34,802


Fair value measurements above were Level 3 for all financing receivables and Level 2 for all borrowings.

Fair values of the financing receivables that were issued long-term were based on the discounted values of their related cash flows at interest rates currently being offered by us for similar financing receivables. The fair values of the remaining financing receivables approximated the carrying amounts.

21

Fair values of long-term borrowings and short-term securitization borrowings were based on current market quotes for identical or similar borrowings and credit risk, or on the discounted values of their related cash flows at current market interest rates.

Assets and liabilities measured at fair value on a recurring basis follow, excluding our cash equivalents, which were carried at a cost that approximates fair value and consisted of money market funds and time deposits.


April 28


October 29


April 30


2024

2023

2023


Level 1

Marketable securities:

International equity securities

$

3

$

3

$

2

International mutual funds securities

101

11

U.S. equity fund

101

86

92

U.S. fixed income fund

24


32


97

U.S. government debt securities

263


78


64

Total Level 1 marketable securities

391

300

266

Level 2

Marketable securities:

Corporate debt securities

213


244


213

International debt securities

148

1

1

Mortgage-backed securities

152


185


168

Municipal debt securities

67


75


70

U.S. government debt securities

123

141

138

Total Level 2 marketable securities

703


646


590

Other assets - Derivatives


191

292

367

Accounts payable and accrued expenses - Derivatives


1,005

1,130

758

Level 3

Accounts payable and accrued expenses - Deferred consideration

164

186

214


The mortgage-backed securities are primarily issued by U.S. government-sponsored enterprises.

The contractual maturities of debt securities at April 28, 2024 follow:


Amortized


Fair


Cost

Value


Due in one year or less


$

17

$

17

Due after one through five years

293

254

Due after five through 10 years

421

386

Due after 10 years

192

157

Mortgage-backed securities

186

152

Debt securities


$

1,109


$

966


Actual maturities may differ from contractual maturities because some securities may be called or prepaid. Mortgage-backed securities contain prepayment provisions and are not categorized by contractual maturity.

The following is a description of the valuation methodologies we use to measure certain financial instruments on the balance sheets at fair value:

Marketable securitiesThe portfolio of investments is valued on a market approach (matrix pricing model) in which all significant inputs are observable or can be derived from or corroborated by observable market data such as interest rates, yield curves, volatilities, credit risk, and prepayment speeds. Funds are valued using the fund’s net asset value, based on the fair value of the underlying securities. International debt securities are valued using quoted prices for identical assets in inactive markets.

DerivativesOur derivative financial instruments consist of interest rate contracts (swaps), foreign currency exchange contracts (futures, forwards, and swaps), and cross-currency interest rate contracts (swaps). The portfolio is valued based on an income approach (discounted cash flow) using market observable inputs, including swap curves and both forward and spot exchange rates for currencies.

Financing receivables – Specific reserve impairments are based on the fair value of the collateral, which is measured using a market approach (appraisal values or realizable values).

22

(18)  Derivative Instruments

Fair values of our derivative instruments and the associated notional amounts were as follows. Assets are recorded in “Other assets,” while liabilities are recorded in “Accounts payable and accrued expenses.”

April 28, 2024

October 29, 2023

April 30, 2023


Fair Value

Fair Value

Fair Value


Notional

Assets

Liabilities

Notional

Assets

Liabilities

Notional

Assets

Liabilities


Cash flow hedges:


Interest rate contracts


$

2,700

$

34

$

1


$

1,500

$

45


$

2,250

$

55

$

6


Fair value hedges:

Interest rate contracts

13,664

8

884

12,691

$

970

10,943

49

605


Not designated as hedging instruments:

Interest rate contracts

12,869

112

71

13,853

169

98

11,956

171

91

Foreign exchange contracts

7,582

36

38

8,117


75


54

9,163


91


42

Cross-currency interest rate contracts

211

1

11

176


3


8

163


1


14

The amounts recorded in the consolidated balance sheets related to borrowings designated in fair value hedging relationships were as follows. Fair value hedging adjustments are included in the carrying amount of the hedged item.

Active Hedging Relationships

Discontinued Hedging Relationships

Carrying Amount

Cumulative Fair Value

Carrying Amount of

Cumulative Fair Value

of Hedged Item

Hedging Amount

Formerly Hedged Item

Hedging Amount

April 28, 2024

Short-term borrowings

$

286

$

(7)

$

2,565

$

16

Long-term borrowings

12,434

(879)

7,616

(264)

October 29, 2023

Short-term borrowings

$

1,814

$

15

Long-term borrowings

$

11,660

$

(976)

7,144

(288)

April 30, 2023

Short-term borrowings

$

1,213

$

14

Long-term borrowings

$

10,334

$

(562)

5,657

(132)


The classification and gains (losses), including accrued interest expense, related to derivative instruments on the statements of consolidated income consisted of the following:

Three Months Ended

Six Months Ended


April 28

April 30

April 28

April 30


2024

2023

2024

2023


Fair Value Hedges


Interest rate contracts - Interest expense


$

(448)

$

(10)


$

(104)

$

229


Cash Flow Hedges

Recognized in OCI:

Interest rate contracts - OCI (pretax)

$

26

$

(4)

$

18

$

(5)

Reclassified from OCI:

Interest rate contracts - Interest expense

16


19

27


34


Not Designated as Hedges

Interest rate contracts - Net sales

$

1

$

(6)

Interest rate contracts - Interest expense


$

7

5


$

(2)

(3)

Foreign exchange contracts - Net sales

(2)

(2)

3

(1)

Foreign exchange contracts - Cost of sales

9


59

(21)

64

Foreign exchange contracts - Other operating expenses

46


127

(135)


(15)

Total not designated


$

60

$

190


$

(155)

$

39

Certain of our derivative agreements contain credit support provisions that may require us to post collateral based on the size of the net liability positions and credit ratings. The aggregate fair value of all derivatives with credit-risk-related contingent

23

features that were in a net liability position at April 28, 2024, October 29, 2023, and April 30, 2023, was $967, $1,076, and $716, respectively. In accordance with the limits established in these agreements, we posted $562, $659, and $308 of cash collateral at April 28, 2024, October 29, 2023, and April 30, 2023, respectively. In addition, we paid $8 of collateral that was outstanding at April 28, 2024, October 29, 2023, and April 30, 2023 to participate in an international futures market to hedge currency exposure, not included in the table below.

Derivatives are recorded without offsetting for netting arrangements or collateral. The impact on the derivative assets and liabilities related to netting arrangements and collateral follows:

Gross Amounts

Netting


Recognized


Arrangements


Collateral


Net Amount


April 28, 2024


Assets


$

191


$

(93)


$

98

Liabilities

1,005

(93)

$

(562)

350


October 29, 2023


Assets

$

292


$

(152)


$

140

Liabilities

1,130


(152)

$

(659)

319


April 30, 2023


Assets

$

367


$

(168)


$

(29)

$

170

Liabilities


758

(168)

(308)


282


(19)  Share-Based Awards

We are authorized to grant shares for stock options and restricted stock units. The outstanding shares authorized were 15.0 million at April 28, 2024. In December 2023, we granted stock options to employees for the purchase of 216 thousand shares of common stock at an exercise price of $377.01 per share and a binomial lattice model fair value of $98.04 per share at the grant date. At April 28, 2024, options for 1.8 million shares were outstanding with a weighted-average exercise price of $220.99 per share.

During the six months ended April 28, 2024, the restricted stock units (RSUs) granted in thousands of shares and the weighted-average grant date fair values, using the closing price of our common stock on the grant date, in dollars follow:

Grant Date

Shares

Fair Value

Service-based


367


$

376.98


Performance/service-based

52

360.53

Market/service-based

52

370.87

In December 2023, we granted market/service-based RSUs. The vesting period for the market/service-based RSUs is three years and dividend equivalents are not earned during the vesting period. The market/service-based RSUs are subject to a market related metric based on total shareholder return, compared to a benchmark group of companies, and award common stock in a range of zero to 200 percent for each unit granted based on the level of the metric achieved. The fair value of the market/service based RSUs was determined using a Monte Carlo model.

(20)  Disposition

In March 2023, we sold our financial services business in Russia to Insight Investment Group. The total proceeds, net of restricted cash sold, were $36. The operations were included in the financial services operating segment through the date of sale. At the disposal date, the total assets were $31, consisting primarily of financing receivables, the total liabilities were $5, and the cumulative translation loss was $10. We did not incur additional gains or losses upon disposition.

(21)  Special Item

In the second quarter of 2023, we corrected the accounting treatment for financing incentives offered to John Deere dealers, which impacted the timing of expense recognition and the presentation of incentive costs in the consolidated financial statements. The cumulative effect of this correction, $173 pretax ($135 after-tax), was recorded in the second quarter of 2023 in “Selling, administrative and general expenses” by financial services. Prior period results were not restated, as the adjustment was considered immaterial to our financial statements.

(22)  Subsequent Events

In May 2024, we entered into a retail note securitization transaction, resulting in $319 of secured borrowings.

On May 29, 2024, a quarterly dividend of $1.47 per share was declared at the Board of Directors meeting, payable on August 8, 2024, to stockholders of record on June 28, 2024.

24

Item 2.MANAGEMENT’S DISCUSSION AND ANALYSIS OF FINANCIAL CONDITION AND RESULTS OF OPERATIONS

RESULTS OF OPERATIONS

All amounts are presented in millions of dollars unless otherwise specified.

Overview

Organization

Deere & Company is a global leader in the production of agricultural, turf, construction, and forestry equipment and solutions. John Deere Financial provides financing for John Deere equipment, parts, services, and other input costs customers need to run their operations. Our operations are managed through the production and precision agriculture (PPA), small agriculture and turf (SAT), construction and forestry (CF), and financial services operating segments. References to “equipment operations” include PPA, SAT, and CF, while references to “agriculture and turf” include both PPA and SAT.

Smart Industrial Operating Model and Leap Ambitions

We announced the Smart Industrial Operating Model in 2020. This operating model is based on three focus areas:

(a)

Production systems: A strategic alignment of products and solutions around our customers’ operations.

(b)

Technology stack: Investments in technology, as well as research and development, that deliver intelligent solutions to our customers through digital capabilities, automation, autonomy, and alternative power technologies.

(c)

Lifecycle solutions: The integration of our aftermarket and support capabilities to more effectively manage customer equipment, service, and technology needs across the full lifetime of a John Deere product.

Our Leap Ambitions were launched in 2022. These ambitions are designed to boost economic value and sustainability for our customers. The ambitions align across our customers’ production systems seeking to optimize their operations to deliver better outcomes with fewer resources.

Trends and Economic Conditions

Industry Sales Outlook for Fiscal Year 2024

Agriculture and Turf

Graphic Graphic

Construction and Forestry

Graphic Graphic

Company Trends

Customers seek to improve profitability, productivity, and sustainability through technology. Integration of technology into equipment is a persistent market trend. Our Smart Industrial Operating Model and Leap Ambitions are intended to capitalize on this market trend. These technologies are incorporated into products within each of our operating segments. We expect this trend to persist for the foreseeable future. Our progress is demonstrated, in part, by the growing use of the John Deere Operations Center (our digital operations management system) engaging more agricultural acres globally. Engaged acres give us a foundational understanding of customer utilization of John Deere technology. The investments in these technologies and establishing a Solutions as a Service business model may increase our operating costs and decrease operating margins during the transition period.

Company Outlook for 2024

Production volumes are expected to continue to decline during the remainder of 2024 due to demand shifts amid challenges in the global agricultural and turf sectors coupled with proactive production and inventory management while the construction industry remains relatively stable.

25
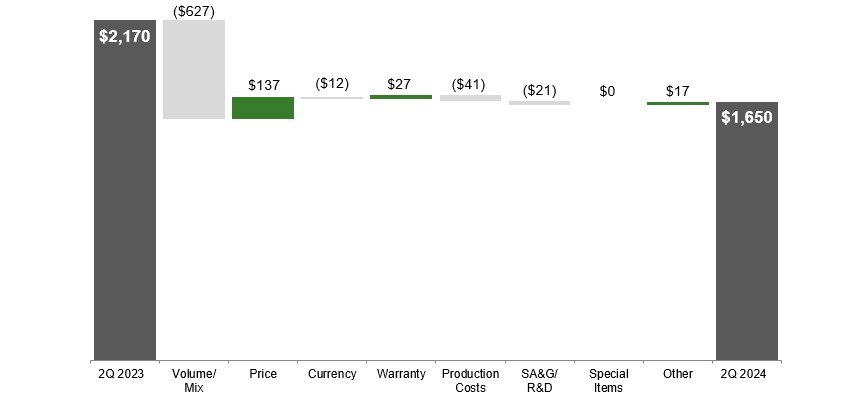
Agriculture and Turf Outlook for 2024

We expect large and small agricultural equipment sales to be down from 2023 levels in North America, Europe, and South America.
Agricultural fundamentals across all our major markets are expected to moderate in 2024 due to rising global stocks, lower commodity prices, elevated interest rates, and weather volatility. In the U.S. and Canada, this is partially offset by resilient farm balance sheets.
The U.S. equipment fleet age is elevated for both tractors and combines. However, increases in used inventory levels are impacting purchasing decisions.
In Europe, the dairy and livestock sector is expected to improve due to stronger pricing amid lower feed costs while spring weather conditions have caused uncertainty about winter seeded crop yields. In addition, persistent, elevated input costs have decreased demand in Europe.
Demand in Brazil is expected to be down due to strong global yields driving down commodity prices, adverse weather conditions, and high interest rates.
Industry sales in Asia are forecasted to be down moderately due to commodity price changes, inventory reductions, and weather impacts.
Due to macro-economic trends in U.S. consumer markets including lower levels of home sales, persistently higher interest rates, and inventory reductions, sales of compact utility tractors and riding lawn equipment continue to be lower.

Construction and Forestry Outlook for 2024

Construction equipment industry sales are forecasted to be flat to down from 2023 levels.
Benefits from increasing U.S. infrastructure spending, elevated manufacturing investment levels, and improving single family housing starts are expected to partially offset declines in commercial real estate construction and softening rental demand.
Roadbuilding demand remains strong in the U.S., largely offset by softening demand in Europe.

Financial Services Outlook for 2024

Net Income

Up moderately

+ Higher average portfolio

Favorable

+ Nonrecurring prior period special item

Favorable

(-) Provision for credit losses

Unfavorable

(-) Financing spreads

Unfavorable

Additional Trends

Agricultural Market Business Cycle. The agricultural market is affected by various factors including commodity prices, acreage planted, crop yields, and government policies. These factors affect farmers’ income and may result in lower demand for equipment. We may experience any of the following effects during unfavorable market conditions: lower net sales, higher sales discounts, higher receivable write-offs, and losses on equipment on operating leases. A potential benefit is that customers may invest in integrated technology solutions and precision agriculture to lower input costs and improve margins.

Interest Rates. Central bank policy interest rates increased in 2023 and have remained elevated. Increased rates impacted us in several ways, primarily affecting the financing spreads for the financial services operations and demand for our products.

The market for our products is negatively impacted by higher interest rates. We expect higher borrowing costs for our customers to affect product sales in 2024.

Most retail customer receivables are fixed rate. Wholesale financing receivables generally are variable rate. Both types of receivables are financed with fixed and floating rate borrowings. We manage our exposure to interest rate fluctuations by matching our receivables with our funding sources. We also enter into interest rate swap agreements to match our interest rate exposure.

Rising interest rates have historically impacted our borrowings sooner than the benefit is realized from receivable and lease portfolios. As a result, our financial services operations experienced $35 (after-tax) less favorable financing spreads in 2024 compared to 2023. We expect to continue experiencing spread compression in 2024, but at a moderating pace relative to spread compression experienced in 2023.

Higher interest rates are driven by factors outside of our control, and as a result we cannot reasonably foresee when this condition will subside.

26

Other Items of Concern and Uncertainties – Other items that could impact our results are:

global and regional political conditions, including the ongoing war between Russia and Ukraine and the conflict in the Middle East,
economic, tax, and trade policies,
new or retaliatory tariffs,
capital market disruptions,
foreign currency and capital control policies,
regulations and legislation regarding right to repair or right to modify,
weather conditions,
marketplace adoption and monetization of technologies we have invested in,
our ability to strengthen our digital capabilities, automation, autonomy, and alternative power technologies,
changes in demand and pricing for new and used equipment,
delays or disruptions in our supply chain,
significant fluctuations in foreign currency exchange rates,
volatility in the prices of many commodities, and
slower economic growth or recession.

Consolidated Results – 2024 Compared with 2023

Three Months Ended

Six Months Ended

Deere & Company

April 28

April 30

%

April 28

April 30

%

(In millions of dollars, except per share amounts)

2024

2023

Change

2024

2023

Change

Net sales and revenues

$

15,235

$

17,387

-12

$

27,420

$

30,038

-9

Net income attributable to Deere & Company

2,370

2,860

-17

4,121

4,819

-14

Diluted earnings per share

8.53

9.65

14.74

16.18

Net sales and revenues decreased for both the quarter and year-to-date periods primarily due to lower sales volumes. Net income and diluted EPS decreased driven by lower sales. The discussion of net sales and operating profit is included in the Business Segment Results below.

An explanation of the cost of sales to net sales ratio and other significant statement of consolidated income changes follow:

Three Months Ended

Six Months Ended

April 28

April 30

%

April 28

April 30

%

Deere & Company

2024

2023

Change

2024

2023

Change

Cost of sales to net sales

67.3%

66.7%

67.9%

67.9%

(+) Price realization

Favorable

Favorable

(+) Inbound freight

Favorable

Favorable

(–) Overhead spending

Unfavorable

Unfavorable

Other income

$

238

$

229

+4

$

577

$

484

+19

Higher for the first six months due to investment income earned on international mutual funds securities.

Research and development expenses

565

547

+3

1,098

1,043

+5

Higher due to continued focus on developing and incorporating technology solutions.

Selling, administrative and general expenses

1,265

1,330

-5

2,330

2,283

+2

Lower in the second quarter as the prior period was impacted by the cumulative correction of the accounting treatment for financing incentives offered to John Deere dealers of $173 pretax ($135 after-tax). Excluding the impact of this item, selling, administrative and general expenses have increased for both periods mostly due to a higher provision for credit losses and higher employee pay driven by inflationary conditions and profit sharing incentives.

Interest expense

836

569

+47

1,638

1,049

+56

Increased for both periods primarily due to higher average borrowing rates and higher average borrowings.

Other operating expenses

295

363

-19

664

660

+1

Lower in the second quarter due to higher pension benefits (see Note 6) and lower foreign exchange losses.

Provision for income taxes

751

991

-24

1,220

1,528

-20

Decreased for both periods as a result of lower pretax income.

27

Business Segment Results – 2024 Compared with 2023

Three Months Ended

Six Months Ended

April 28

April 30

%

April 28

April 30

%

Production and Precision Agriculture

2024

2023

Change

2024

2023

Change

Net sales

$

6,581

$

7,822

-16

$

11,430

$

13,021

-12

Operating profit

1,650

2,170

-24

2,695

3,378

-20

Operating margin

25.1%

27.7%

23.6%

25.9%

Price realization

+2

+3

Currency translation impact on Net sales

Production and precision agriculture sales decreased for the quarter as a result of lower shipment volumes (primarily in Brazil, the U.S., and Europe), driven by softened demand. This was partially offset by price realization in the U.S. and Canada. Operating profit decreased primarily due to lower shipment volumes and higher production costs, partially offset by price realization.

Production & Precision Agriculture Operating Profit

Second Quarter 2024 Compared to Second Quarter 2023

Graphic

Sales for the first six months decreased as a result of lower shipment volumes (primarily in Brazil, the U.S., and Europe), partially offset by price realization in the U.S. and Canada. Operating profit for the first six months decreased due to lower sales volume, higher selling, administrative, and general expenses and research and development expenses, partially offset by price realization.

Production & Precision Agriculture Operating Profit

First Six Months 2024 Compared to First Six Months 2023

Graphic

28

Three Months Ended

Six Months Ended

April 28

April 30

%

April 28

April 30

%

Small Agriculture and Turf

2024

2023

Change

2024

2023

Change

Net sales

$

3,185

$

4,145

-23

$

5,610

$

7,146

-21

Operating profit

571

849

-33

897

1,296

-31

Operating margin

17.9%

20.5%

16.0%

18.1%

Price realization

+2

+2

Currency translation impact on Net sales

Small agriculture and turf sales decreased for the quarter due to lower shipment volumes (primarily in the U.S., Europe, and Mexico), partially offset by price realization in the U.S. Operating profit decreased due to lower shipment volumes, partially offset by price realization.

Small Agriculture & Turf Operating Profit

Second Quarter 2024 Compared to Second Quarter 2023

Graphic

Sales for the first six months decreased as a result of lower shipment volumes (primarily in the U.S., Europe, and Mexico), partially offset by price realization. Operating profit for the first six months decreased primarily as a result of lower sales volumes, higher selling, administrative, and general expenses and research and development expenses, and higher warranty expenses. These items were partially offset by price realization, favorable mix, and lower production costs.

Small Agriculture & Turf Operating Profit

First Six Months 2024 Compared to First Six Months 2023

Graphic

29

Three Months Ended

Six Months Ended

April 28

April 30

%

April 28

April 30

%

Construction and Forestry

2024

2023

Change

2024

2023

Change

Net sales

$

3,844

$

4,112

-7

$

7,057

$

7,314

-4

Operating profit

668

838

-20

1,234

1,463

-16

Operating margin

17.4%

20.4%

17.5%

20.0%

Price realization

+1

Currency translation impact on Net sales

Construction and forestry sales decreased for the quarter due to lower worldwide shipment volumes. Operating profit decreased due to lower sales volumes and increased selling, administrative, and general expenses and research and development expenses.

Construction & Forestry Operating Profit

Second Quarter 2024 Compared to Second Quarter 2023

Graphic

The segment’s six-month sales decreased due to lower shipment volumes in all major regions outside the U.S., partially offset by price realization and the favorable impact of currency translation. The first six-month’s operating profit decreased due to lower sales volumes, higher selling, administrative, and general expenses and research and development expenses, increased production costs, and the unfavorable impact of currency translation. These factors were partially offset by price realization.

Construction & Forestry Operating Profit

First Six Months 2024 Compared to First Six Months 2023

Graphic

30

Three Months Ended

Six Months Ended

April 28

April 30

%

April 28

April 30

%

Financial Services

2024

2023

Change

2024

2023

Change

Revenue (including intercompany)

$

1,588

$

1,297

+22

$

3,140

$

2,542

+24

Interest expense

780

540

+44

1,542

983

+57

Net income

162

28

+479

370

212

+75

The average balance of receivables and leases financed was 16 percent higher in the second quarter of 2024 and 18 percent higher in the first six months of 2024 compared with the same periods last year. Revenue also increased due to higher average financing rates in both periods. Interest expense increased compared to both prior periods as a result of higher average borrowings and higher average borrowing rates. Financial services net income in both periods increased due to income earned on higher average portfolio balances, partially offset by a higher provision for credit losses and less favorable financing spreads. The results of both periods were also affected by a correction of the accounting treatment for financing incentives offered to John Deere dealers. The cumulative effect of this correction, $173 pretax ($135 after-tax), was recorded in the second quarter of 2023.

Critical Accounting Estimates

See our critical accounting estimates discussed in the Management’s Discussion and Analysis of the most recently filed Annual Report on Form 10-K. There have been no material changes to these policies.

Capital Resources and Liquidity – 2024 Compared with 2023

We have access to global markets at a reasonable cost. Sources of liquidity include:

cash, cash equivalents, and marketable securities on hand,
funds from operations,
the issuance of commercial paper and term debt,
the securitization of retail notes, and
bank lines of credit.

We closely monitor our cash requirements. Based on the available sources of liquidity, we expect to meet our funding needs in the short term (next 12 months) and long term (beyond 12 months). We are forecasting lower operating cash flows in 2024 compared with 2023.

We operate in multiple industries, which have unique funding requirements. The equipment operations are capital intensive. Historically, these operations have been subject to seasonal variations in financing requirements for inventories and receivables from dealers.

The financial services operations rely on their ability to raise substantial amounts of funds to finance their receivable and lease portfolios.

Key metrics are provided in the following table:

April 28

October 29

April 30

2024

2023

2023

Cash, cash equivalents, and marketable securities

$

6,647

$

8,404

$

6,123

Trade accounts and notes receivable – net

8,880

7,739

9,971

Ratio to prior 12 month’s net sales

17%

14%

18%

Inventories

8,443

8,160

9,713

Ratio to prior 12 month’s cost of sales

24%

22%

25%

Unused credit lines

2,787

841

785

Financial Services:

Ratio of interest-bearing debt to stockholder’s equity

8.7 to 1

8.4 to 1

8.0 to 1

In the first half of 2024, we invested $177 in U.S. dollar denominated bonds issued by the central bank of Argentina. The bonds are recorded in “Marketable securities,” classified as “International debt securities.” These bonds can be held until maturity or sold in a secondary market outside of Argentina to settle intercompany debt (see Note 17).

The increase in unused credit lines in 2024 compared to both prior periods relates to a decrease in commercial paper outstanding.

31

We are forecasting lower operating cash flows in 2024 compared to 2023 driven by a decrease in net income adjusted for non-cash provisions and a reduction in accrued expenses.

There have been no material changes to the contractual obligations and other cash requirements identified in our most recently filed Annual Report on Form 10-K.

Cash Flows

Six Months Ended

April 28, 2024

April 30, 2023

Net cash provided by (used for) operating activities

$

944

$

(147)

Net cash used for investing activities

(1,670)

(1,494)

Net cash provided by (used for) financing activities

(1,162)

2,017

Effect of exchange rate changes on cash, cash equivalents, and restricted cash

(5)

70

Net increase (decrease) in cash, cash equivalents, and restricted cash

$

(1,893)

$

446

Cash inflows from consolidated operating activities in the first six months of 2024 were $944. This resulted mainly from net income adjusted for non-cash provisions, partially offset by a working capital change. Included in the working capital change was a cash outflow of $1,300 from accounts payable and accrued expenses due to a higher profit sharing payout in the first quarter of 2024 based on strong fiscal year 2023 results, lower accrued expenses related to dealer sales discounts, and less trade payables consistent with our forecasted decrease in production. Cash outflows from investing activities were $1,670 in the first six months of this year. The primary drivers were purchases of property and equipment and growth in the retail customer receivable portfolio and equipment on operating leases. Cash outflows from financing activities were $1,162 in the first six months of 2024, as cash returned to shareholders was partially offset by higher external borrowings. Cash returned to shareholders was $3,218 in the first six months of 2024. Cash, cash equivalents, and restricted cash decreased $1,893 during the first six months of 2024.

Key Metrics and Balance Sheet Changes

Trade Accounts and Notes Receivable. Trade accounts and notes receivable arise from sales of goods to customers. Trade receivables increased $1,141 during the first six months of 2024, primarily due to a seasonal increase. These receivables decreased $1,091, compared to a year ago, due to lower sales volumes. The percentage of total worldwide trade receivables outstanding for periods exceeding 12 months was 2 percent at April 28, 2024, 1 percent at October 29, 2023, and 1 percent at April 30, 2023.

Financing Receivables and Equipment on Operating Leases. Financing receivables and equipment on operating leases consist of retail notes originated in connection with financing of new and used equipment, operating leases, revolving charge accounts, sales-type and direct financing leases, and wholesale notes. Financing receivables and equipment on operating leases increased $1,580 during the first six months of 2024 and increased $8,368 in the past 12 months due to higher dealer inventory levels and elevated sales of new and used retail inventory. Total acquisition volumes of financing receivables and equipment on operating leases were 16 percent higher in the first six months of 2024, compared with the same period last year, as volumes of wholesale notes, retail notes, financing leases, and operating leases were higher, while revolving charge accounts were flat compared to April 30, 2023.

Inventories. Inventories increased by $283 during the first six months of 2024, primarily due to a seasonal increase. Inventories decreased by $1,270 compared to a year ago due to lower forecasted shipment volumes. A majority of these inventories are valued on the last-in, first out (LIFO) method.

Property and Equipment. Property and equipment cash expenditures in the first six months of 2024 were $719 compared with $584 in the same period last year. Capital expenditures in 2024 are estimated to be approximately $1,900.

Accounts Payable and Accrued Expenses. Accounts payable and accrued expenses decreased by $1,521 in the first six months of 2024, primarily due to a decrease in accrued expenses associated with dealer sales discounts and employee benefits, and decreased accounts payable associated with trade payables. Accounts payable and accrued expenses decreased $107 compared to a year ago due to a decrease in accounts payable associated with trade payables, partially offset by an increase in accrued expenses associated with derivative liabilities, extended warranty liabilities, and accrued interest.

Borrowings. Total external borrowings increased by $2,226 in the first six months of 2024 and increased $7,538 compared to a year ago, generally corresponding with the level of the receivable and lease portfolios, as well as other working capital requirements.

32

John Deere Capital Corporation (Capital Corporation), a U.S. financial services subsidiary, has a revolving warehouse facility to utilize bank conduit facilities to securitize retail notes (see Note 9). The facility was renewed in November 2023 with an expiration in November 2024 and with an increase in the total capacity or “financing limit” from $1,500 to $2,000. At April 28, 2024, $1,434 of securitization borrowings were outstanding under the facility. At the end of the contractual revolving period, unless the banks and Capital Corporation agree to renew, Capital Corporation would liquidate the secured borrowings over time as payments on the retail notes are collected.

In the first six months of 2024, the financial services operations issued $1,880 and retired $1,900 of retail note securitization borrowings, which are presented in “Net proceeds in short-term borrowings (original maturities three months or less).”

Lines of Credit. We also have access to bank lines of credit with various banks throughout the world. Worldwide lines of credit totaled $10,934 at April 28, 2024, $2,787 of which were unused. For the purpose of computing unused credit lines, commercial paper and short-term bank borrowings were considered to constitute utilization. Included in the total credit lines at April 28, 2024 was a 364-day credit facility agreement of $5,000 expiring in the second quarter of 2025. In addition, total credit lines included long-term credit facility agreements of $2,750 expiring in the second quarter of 2028 and $2,750 expiring in the second quarter of 2029. These credit agreements require Capital Corporation and other parts of our business to maintain certain performance metrics and liquidity targets. All requirements in the credit agreements have been met during the periods included in the financial statements.

Debt Ratings. To access public debt capital markets, we rely on credit rating agencies to assign short-term and long-term credit ratings to our debt securities as an indicator of credit quality for fixed income investors. A security rating is not a recommendation by the rating agency to buy, sell, or hold our securities. A credit rating agency may change or withdraw ratings based on its assessment of our current and future ability to meet interest and principal repayment obligations. Each agency’s rating should be evaluated independently of any other rating. Lower credit ratings generally result in higher borrowing costs, including costs of derivative transactions, and reduced access to debt capital markets. The senior long-term and short-term debt ratings and outlook currently assigned to unsecured company securities by the rating agencies engaged by us are as follows:


Senior


Long-Term

Short-Term

Outlook


Fitch Ratings

A+

F1

Stable

Moody’s Investors Service, Inc.


A1


Prime-1


Stable

Standard & Poor’s


A


A-1


Stable

FORWARD-LOOKING STATEMENTS

Certain statements contained herein, including in the section entitled “Overview” relating to future events, expectations, and trends constitute “forward-looking statements” as defined in the Private Securities Litigation Reform Act of 1995 and involve factors that are subject to change, assumptions, risks, and uncertainties that could cause actual results to differ materially. Some of these risks and uncertainties could affect all lines of our operations generally while others could more heavily affect a particular line of business.

Forward-looking statements are based on currently available information and current assumptions, expectations, and projections about future events and should not be relied upon. Except as required by law, we expressly disclaim any obligation to update or revise our forward-looking statements. Many factors, risks, and uncertainties could cause actual results to differ materially from these forward-looking statements. Among these factors are risks related to:

changes in and compliance with U.S., foreign, and international laws, regulations, and policies relating to trade, economic sanctions, data privacy, spending, taxing, banking, monetary, environmental (including climate change and engine emissions), and farming policies;
political, economic, and social instability of the geographies in which we operate, including the ongoing war between Russia and Ukraine and the conflict in the Middle East;
adverse macroeconomic conditions, including unemployment, inflation, rising interest rates, changes in consumer practices due to slower economic growth, and regional or global liquidity constraints;
worldwide demand for food and different forms of renewable energy;
the ability to execute business strategies, including our Smart Industrial Operating Model, Leap Ambitions, and mergers and acquisitions;
the ability to understand and meet customers’ changing expectations and demand for John Deere products and solutions;
accurately forecasting customer demand for products and services and adequately managing inventory;
the ability to integrate new technology, including automation and machine learning, and deliver precision technology and solutions to customers;

33

changes to governmental communications channels (radio frequency technology);
the ability to adapt in highly competitive markets;
dealer practices and their ability to manage distribution of John Deere products and support and service precision technology solutions;
changes in climate patterns, unfavorable weather events, and natural disasters;
governmental and other actions designed to address climate change in connection with a transition to a lower-carbon economy;
higher interest rates and currency fluctuations which could adversely affect the U.S. dollar, customer confidence, access to capital, and demand for John Deere products and solutions;
availability and price of raw materials, components, and whole goods;
delays or disruptions in our supply chain;
the failure of our equipment to perform as expected, which could result in warranty claims, post-sales repairs or recalls, product liability litigation, and regulatory investigations;
the ability to attract, develop, engage, and retain qualified personnel;
security breaches, cybersecurity attacks, technology failures, and other disruptions to John Deere information technology infrastructure and products;
loss of or challenges to intellectual property rights;
legislation introduced or enacted that could affect our business model and intellectual property, such as right to repair or right to modify legislation;
investigations, claims, lawsuits, or other legal proceedings;
events that damage our reputation or brand;
the agricultural business cycle, which can be unpredictable and is affected by factors such as world grain stocks, available farm acres, acreage planted, soil conditions, harvest yields, prices for commodities and livestock, input costs, and availability of transport for crops; and
housing starts and supply, real estate and housing prices, levels of public and non-residential construction, and infrastructure investment.

Further information concerning us and our businesses, including factors that could materially affect our financial results, is included in our other filings with the SEC (including, but not limited to, the factors discussed in Item 1A. “Risk Factors” of our most recent Annual Report on Form 10-K and this Quarterly Report on Form 10-Q). There also may be other factors that we cannot anticipate or that are not described herein because we do not currently perceive them to be material.

SUPPLEMENTAL CONSOLIDATING DATA

The supplemental consolidating data presented on the subsequent pages is presented for informational purposes. Equipment operations represents the enterprise without financial services. Equipment operations includes production and precision agriculture operations, small agriculture and turf operations, construction and forestry operations, and other corporate assets, liabilities, revenues, and expenses not reflected within financial services. Transactions between the equipment operations and financial services have been eliminated to arrive at the consolidated financial statements.

Equipment operations and financial services participate in different industries. Equipment operations primarily generate earnings and cash flows by manufacturing and selling equipment, service parts, and technology solutions to dealers and retail customers. Financial services finances sales and leases by dealers of new and used equipment that is largely manufactured by equipment operations. Those earnings and cash flows generally are the difference between the finance income received from customer payments less interest expense, and depreciation on equipment subject to an operating lease. The two businesses are capitalized differently and have separate performance metrics. The supplemental consolidating data is also used by management due to these differences.


34


DEERE & COMPANY

SUPPLEMENTAL CONSOLIDATING DATA

STATEMENTS OF INCOME

For the Three Months Ended April 28, 2024 and April 30, 2023

Unaudited

EQUIPMENT

FINANCIAL

OPERATIONS

SERVICES

ELIMINATIONS

CONSOLIDATED


2024

2023

2024

2023

2024

2023

2024

2023


Net Sales and Revenues


Net sales

$

13,610

$

16,079

$

13,610

$

16,079

Finance and interest income

129


121

$

1,496

$

1,206

$

(238)

$

(248)

1,387

1,079

1

Other income

198


185

92


91

(52)


(47)

238


229

2, 3

Total

13,937


16,385

1,588


1,297

(290)


(295)

15,235


17,387

Costs and Expenses

Cost of sales

9,164


10,737

(7)


(7)

9,157

10,730

4

Research and development expenses

565


547

565

547

Selling, administrative and general expenses

1,007


935

260


397

(2)


(2)

1,265


1,330

4

Interest expense

114


103

780


540

(58)


(74)

836


569

1

Interest compensation to Financial Services

180


174

(180)


(174)

1

Other operating expenses

1


85

337


316

(43)


(38)

295


363

3, 5

Total

11,031


12,581

1,377


1,253

(290)


(295)

12,118


13,539

Income before Income Taxes

2,906


3,804

211


44


3,117


3,848

Provision for income taxes

700


974

51


17


751


991

Income after Income Taxes

2,206


2,830

160


27


2,366


2,857

Equity in income of unconsolidated affiliates


1

2


1

2

2

Net Income

2,206


2,831

162


28


2,368


2,859

Less: Net loss attributable to noncontrolling interests

(2)


(1)

(2)

(1)

Net Income Attributable to Deere & Company

$

2,208

$

2,832

$

162

$

28

$

2,370

$

2,860


1 Elimination of intercompany interest income and expense.

2 Elimination of equipment operations’ margin from inventory transferred to equipment on operating leases.

3 Elimination of income and expenses between equipment operations and financial services related to intercompany guarantees of investments in certain international markets and intercompany service revenues and expenses.

4 Elimination of intercompany service fees.

5 Elimination of financial services’ lease depreciation expense related to inventory transferred to equipment on operating leases.

35


DEERE & COMPANY

SUPPLEMENTAL CONSOLIDATING DATA (Continued)

STATEMENTS OF INCOME

For the Six Months Ended April 28, 2024 and April 30, 2023

Unaudited

EQUIPMENT

FINANCIAL

OPERATIONS

SERVICES

ELIMINATIONS

CONSOLIDATED


2024

2023

2024

2023

2024

2023

2024

2023


Net Sales and Revenues


Net sales

$

24,097

$

27,481

$

24,097

$

27,481

Finance and interest income

285


234

$

2,929

$

2,274

$

(468)

$

(435)

2,746

2,073

1

Other income

487


417

211


268

(121)


(201)

577


484

2, 3

Total

24,869


28,132

3,140


2,542

(589)


(636)

27,420


30,038

Costs and Expenses

Cost of sales

16,371


18,675

(14)


(12)

16,357

18,663

4

Research and development expenses

1,098


1,043

1,098

1,043

Selling, administrative and general expenses

1,882


1,719

453


569

(5)


(5)

2,330


2,283

4

Interest expense

223


204

1,542


983

(127)


(138)

1,638


1,049

1

Interest compensation to Financial Services

341


297

(341)


(297)

1

Other operating expenses

91


137

675


707

(102)


(184)

664


660

3, 5

Total

20,006


22,075

2,670


2,259

(589)


(636)

22,087


23,698

Income before Income Taxes

4,863


6,057

470


283


5,333


6,340

Provision for income taxes

1,117


1,455

103


73


1,220


1,528

Income after Income Taxes

3,746


4,602

367


210


4,113


4,812

Equity in income of unconsolidated affiliates


1

3


2

3

3

Net Income

3,746


4,603

370


212


4,116


4,815

Less: Net loss attributable to noncontrolling interests

(5)


(4)


(5)

(4)

Net Income Attributable to Deere & Company

$

3,751

$

4,607

$

370

$

212

$

4,121

$

4,819


1 Elimination of intercompany interest income and expense.

2 Elimination of equipment operations’ margin from inventory transferred to equipment on operating leases.

3 Elimination of income and expenses between equipment operations and financial services related to intercompany guarantees of investments in certain international markets and intercompany service revenues and expenses.

4 Elimination of intercompany service fees.

5 Elimination of financial services’ lease depreciation expense related to inventory transferred to equipment on operating leases.

36


DEERE & COMPANY

SUPPLEMENTAL CONSOLIDATING DATA (Continued)

CONDENSED BALANCE SHEETS

Unaudited

EQUIPMENT

FINANCIAL

OPERATIONS

SERVICES

ELIMINATIONS

CONSOLIDATED

Apr 28

Oct 29

Apr 30

Apr 28

Oct 29

Apr 30

Apr 28

Oct 29

Apr 30

Apr 28

Oct 29

Apr 30

2024

2023

2023

2024

2023

2023

2024

2023

2023

2024

2023

2023

Assets


Cash and cash equivalents

$

3,800

$

5,720

$

3,587

$

1,753

$

1,738

$

1,680

$

5,553

$

7,458

$

5,267

Marketable securities

148


104


14

946


842


842


1,094


946


856

Receivables from Financial Services

4,480


4,516


5,899

$

(4,480)

$

(4,516)

$

(5,899)

6

Trade accounts and notes receivable – net

1,320


1,320


1,562

10,263


8,687


10,422

(2,703)


(2,268)


(2,013)

8,880


7,739


9,971

7

Financing receivables – net

80


64


54

45,198


43,609


38,900


45,278


43,673


38,954

Financing receivables securitized – net

1

7,262


7,335


5,658


7,262


7,335


5,659

Other receivables

1,822


1,813


2,201

760


869


481

(47)


(59)


(89)

2,535


2,623


2,593

7

Equipment on operating leases – net

6,965


6,917


6,524


6,965


6,917


6,524

Inventories

8,443


8,160


9,713

8,443

8,160

9,713

Property and equipment – net

6,999


6,843


6,254

35


36


34


7,034


6,879


6,288

Goodwill

3,936


3,900


3,963

3,936

3,900

3,963

Other intangible assets – net

1,064


1,133


1,222


1,064


1,133


1,222

Retirement benefits

2,980


2,936


3,450

77


72


69

(1)


(1)


3,056


3,007


3,519

8

Deferred income taxes

2,210


2,133


1,355

71


68


59

(345)


(387)


(106)

1,936


1,814


1,308

9

Other assets

2,105


1,948


1,961

504


559


564

(17)


(4)


(15)

2,592


2,503


2,510

Total Assets

$

39,387

$

40,590

$

41,236

$

73,834

$

70,732

$

65,233

$

(7,593)

$

(7,235)

$

(8,122)

$

105,628

$

104,087

$

98,347

Liabilities and Stockholders’ Equity

Liabilities

Short-term borrowings

$

1,055

$

1,230

$

1,755

$

16,644

$

16,709

$

15,354

$

17,699

$

17,939

$

17,109

Short-term securitization borrowings

6,976


6,995


5,379


6,976


6,995


5,379

Payables to Equipment Operations


4,480


4,516


5,899

$

(4,480)

$

(4,516)

$

(5,899)


6

Accounts payable and accrued expenses

13,771


14,862


13,759

3,605


3,599


3,074

(2,767)


(2,331)


(2,117)

14,609


16,130


14,716

7

Deferred income taxes

421


452


402

415


455


215

(345)


(387)


(106)

491


520


511

9

Long-term borrowings

6,575


7,210


7,310

34,387


31,267


28,301


40,962


38,477


35,611

Retirement benefits and other liabilities

1,995


2,032


2,410

111


109


110

(1)


(1)


2,105


2,140


2,520

8

Total liabilities

23,817

25,786

25,636

66,618

63,650

58,332

(7,593)

(7,235)

(8,122)

82,842

82,201

75,846

Commitments and contingencies (Note 16)

Redeemable noncontrolling interest

98

97

102

98

97

102

Stockholders’ Equity

Total Deere & Company stockholders’ equity

22,684


21,785


22,395

7,216

7,082

6,901

(7,216)

(7,082)

(6,901)

22,684

21,785

22,395

10

Noncontrolling interests

4


4


4

4

4

4

Financial Services’ equity

(7,216)


(7,082)


(6,901)

7,216

7,082

6,901

10

Adjusted total stockholders’ equity

15,472


14,707


15,498

7,216


7,082


6,901


22,688


21,789


22,399

Total Liabilities and Stockholders’ Equity

$

39,387

$

40,590

$

41,236

$

73,834

$

70,732

$

65,233

$

(7,593)

$

(7,235)

$

(8,122)

$

105,628

$

104,087

$

98,347


6 Elimination of receivables / payables between equipment operations and financial services.

7 Primarily reclassification of sales incentive accruals on receivables sold to financial services.

8 Reclassification of net pension assets / liabilities.

9 Reclassification of deferred tax assets / liabilities in the same taxing jurisdictions.

10 Elimination of financial services’ equity.

37


DEERE & COMPANY

SUPPLEMENTAL CONSOLIDATING DATA (Continued)

STATEMENTS OF CASH FLOWS

For the Six Months Ended April 28, 2024 and April 30, 2023

Unaudited

EQUIPMENT

FINANCIAL

OPERATIONS

SERVICES

ELIMINATIONS

CONSOLIDATED

2024

2023

2024

2023

2024

2023

2024

2023

Cash Flows from Operating Activities


Net income

$

3,746

$

4,603

$

370

$

212

$

4,116

$

4,815

Adjustments to reconcile net income to net cash provided by (used for) operating activities:

Provision (credit) for credit losses


10


4


121


(93)


131


(89)

Provision for depreciation and amortization


608


565


509


500

$

(72)

$

(70)


1,045


995

11

Other non-cash adjustments (Note 21)


173


173

Share-based compensation expense

104

54

104

54

12

Distributed earnings of Financial Services


247


12


(247)


(12)


13

Credit for deferred income taxes


(74)


(304)


(46)


(73)


(120)


(377)

Changes in assets and liabilities:

Receivables related to sales


(58)


(255)

(2,411)

(4,152)

(2,469)

(4,407)

14, 16

Inventories


(300)


(910)

(109)

(72)

(409)

(982)

15

Accounts payable and accrued expenses


(1,012)


161


147


243


(435)


(717)


(1,300)


(313)

16

Accrued income taxes payable/receivable


(20)


(97)


(9)


1


(29)


(96)

Retirement benefits


(205)


(67)


(3)


(1)


(208)


(68)

Other


89


54


65


103


(71)


(9)


83


148

11, 12, 15

Net cash provided by (used for) operating activities


3,031


3,766


1,154


1,065


(3,241)


(4,978)


944


(147)

Cash Flows from Investing Activities

Collections of receivables (excluding receivables related to sales)


14,175


13,169


(472)


(576)


13,703


12,593

14

Proceeds from maturities and sales of marketable securities


58


62


142


36


200


98

Proceeds from sales of equipment on operating leases


1,011


993


1,011


993

Cost of receivables acquired (excluding receivables related to sales)


(14,238)


(13,584)


147


133


(14,091)


(13,451)

14

Purchases of marketable securities

(226)


(21)


(206)


(167)


(432)


(188)

Purchases of property and equipment


(718)


(583)


(1)


(1)


(719)


(584)

Cost of equipment on operating leases acquired


(1,516)


(1,327)


147


98


(1,369)


(1,229)

15

Decrease (increase) in investment in Financial Services

10

(799)


(10)


799


17

Increase in trade and wholesale receivables


(3,171)


(5,310)


3,171


5,310


14

Collateral on derivatives – net

96

367

96

367

Other


(68)


(119)


(2)


25


1


1


(69)


(93)

Net cash used for investing activities


(944)


(1,460)


(3,710)


(5,799)


2,984


5,765


(1,670)


(1,494)

Cash Flows from Financing Activities

Net proceeds (payments) in short-term borrowings (original maturities three months or less)


189


(225)


(131)


4,217


58


3,992

Change in intercompany receivables/payables


31


932


(31)


(932)


Proceeds from borrowings issued (original maturities greater than three months)


34


41


10,155


4,827


10,189


4,868

Payments of borrowings (original maturities greater than three months)


(1,012)


(47)


(7,127)


(3,520)


(8,139)


(3,567)

Repurchases of common stock


(2,422)


(2,546)

(2,422)

(2,546)

Capital investment from Equipment Operations


(10)

799

10

(799)

17

Dividends paid


(796)


(697)


(247)

(12)


247

12


(796)

(697)

13

Other


(27)


(5)


(25)


(28)


(52)


(33)

Net cash provided by (used for) financing activities


(4,003)


(2,547)


2,584


5,351


257


(787)


(1,162)


2,017

Effect of Exchange Rate Changes on Cash, Cash Equivalents, and Restricted Cash


62


(5)


8


(5)


70

Net Increase (Decrease) in Cash, Cash Equivalents, and Restricted Cash


(1,916)


(179)


23


625


(1,893)


446

Cash, Cash Equivalents, and Restricted Cash at Beginning of Period


5,755


3,781


1,865


1,160


7,620


4,941

Cash, Cash Equivalents, and Restricted Cash at End of Period

$

3,839

$

3,602

$

1,888

$

1,785

$

5,727

$

5,387

Components of Cash, Cash Equivalents, and Restricted Cash

Cash and cash equivalents

$

3,800

$

3,587

$

1,753

$

1,680

$

5,553

$

5,267

Restricted cash (Other assets)

39

15

135

105

174

120

Total Cash, Cash Equivalents, and Restricted Cash

$

3,839

$

3,602

$

1,888

$

1,785

$

5,727

$

5,387

11 Elimination of depreciation on leases related to inventory transferred to equipment on operating leases.

12 Reclassification of share-based compensation expense.

13 Elimination of dividends from financial services to the equipment operations, which are included in the equipment operations’ operating activities.

14 Primarily reclassification of receivables related to the sale of equipment.

15 Reclassification of direct lease agreements with retail customers.

16 Reclassification of sales incentive accruals on receivables sold to financial services.

17 Elimination of change in investment from equipment operations to financial services.

38

Item 3.QUANTITATIVE AND QUALITATIVE DISCLOSURES ABOUT MARKET RISK

See our most recently filed Annual Report on Form 10-K (Part II, Item 7A). There have been no material changes in this information.

Item 4.CONTROLS AND PROCEDURES

Our principal executive officer and principal financial officer have concluded that our disclosure controls and procedures (as defined in Rules 13a-15(e) and 15d-15(e) of the Securities Exchange Act of 1934, as amended (the Exchange Act)) were effective as of April 28, 2024, based on the evaluation of these controls and procedures required by Rule 13a-15(b) or 15d-15(b) of the Exchange Act. During the second quarter of 2024, there were no changes that have materially affected or are reasonably likely to materially affect our internal control over financial reporting.

PART II.  OTHER INFORMATION

Item 1.Legal Proceedings

We are subject to various unresolved legal actions which arise in the normal course of our business, the most prevalent of which relate to product liability (including asbestos-related liability), retail credit, employment, patent, trademark, and antitrust matters. We believe the reasonably possible range of losses for these unresolved legal actions would not have a material effect on our consolidated financial statements.

Item 1A.Risk Factors

See our most recently filed Annual Report on Form 10-K (Part I, Item 1A). There have been no material changes in this information. The risks described in the Annual Report on Form 10-K, and the “Forward-Looking Statements” in this report, are not the only risks we face. Additional risks and uncertainties may also materially affect our business, financial condition, or operating results. One should not consider the risk factors to be a complete discussion of risks, uncertainties, and assumptions.

Item 2.Unregistered Sales of Equity Securities and Use of Proceeds

Issuer Purchases of Equity Securities

Purchases of our common stock during the second quarter of 2024 were as follows:


Total Number of


Shares Purchased as

Maximum Number of


Total Number of

Part of Publicly

Shares that May Yet Be


Shares

Announced Plans or

Purchased under the


Purchased

Average Price

Programs (1)

Plans or Programs (1)


Period

(thousands)

Per Share

(thousands)

(millions)


Jan 29 to Feb 25

1,049


$

383.61

1,049

28.6

Feb 26 to Mar 24

1,330

374.48

1,330

27.3

Mar 25 to Apr 28

505

404.58

505

26.8

Total

2,884

2,884

(1)We have a share repurchase plan that was announced in December 2022 to purchase up to $18.0 billion of shares of our common stock. The maximum number of shares that may yet be purchased under this plan was 26.8 million based on the closing price of our common stock on the New York Stock Exchange as of the end of the second quarter of 2024 of $393.33 per share. At the end of the second quarter of 2024, $10.5 billion of common stock remained to be purchased under this plan.

39

Sales of Unregistered Securities

During the second quarter of 2024, we issued 4,500 deferred stock units under the Deere & Company Nonemployee Director Stock Ownership Plan (“NEDSOP”) to our non-employee directors for their service on our Board of Directors. The deferred stock units convert to shares of common stock on a one-for-one basis following a termination of service as described in the plan. Deferred stock units and shares of common stock issued under the NEDSOP are exempt from registration pursuant to Section 4(a)(2) of the Securities Act of 1933, as amended, and Rule 506 of the SEC’s Regulation D thereunder.

During the second quarter of 2024, we distributed 4,399 shares of common stock to a participant account under the 2012 and 2022 NEDSOP.

Item 3.Defaults Upon Senior Securities

None.

Item 4.Mine Safety Disclosures

Not applicable.

Item 5.Other Information

Director and Executive Officer Trading Arrangements

On February 26, 2024, Cory J. Reed, President, Worldwide Agriculture & Turf Division, Production and Precision Ag, Sales & Marketing Regions of the Americas and Australia adopted a trading plan intended to satisfy the affirmative defense of Rule 10b5-1(c) under the Exchange Act. The plan covers the exercise of 13,370 employee stock options and the related sale of such shares. The plan expires on December 24, 2024.

On March 5, 2024, Rajesh Kalathur, President, John Deere Financial, and Chief Information Officer adopted a trading plan intended to satisfy the affirmative defense of Rule 10b5-1(c) under the Exchange Act. The plan covers the exercise of 24,580 employee stock options and the related sale of such shares. The plan expires on August 29, 2025.

40

Item 6.Exhibits

Certain instruments relating to long-term borrowings constituting less than 10 percent of the registrant’s total assets are not filed as exhibits herewith pursuant to Item 601(b)(4)(iii)(A) of Regulation S-K. The registrant will furnish copies of such instruments to the Commission upon request of the Commission.

3.1

Certificate of Incorporation (Exhibit 3.1 to Form 10-Q of registrant for the quarter ended July 28, 2019, Securities and Exchange Commission File Number 1-4121*)

3.2

Bylaws, as amended (Exhibit 3.2 to Form 10-Q of registrant for the quarter ended July 30, 2023, Securities and Exchange Commission File Number 1-4121*)

10.1

364-Day Credit Agreement, dated March 25, 2024, among the registrant, John Deere Capital Corporation, John Deere Bank S.A., various financial institutions, JPMorgan Chase Bank, N.A., as Administrative Agent, Bank of America, N.A. and Citibank, N.A., as Co-Syndication Agents, and J.P. Morgan Securities LLC, as Sustainability Structuring Agent

10.2

2028 Credit Agreement, dated March 25, 2024, among the registrant, John Deere Capital Corporation, John Deere Bank S.A., various financial institutions, JPMorgan Chase Bank, N.A., as Administrative Agent, Bank of America, N.A. and Citibank, N.A., as Co-Syndication Agents, and J.P. Morgan Securities LLC, as Sustainability Structuring Agent

10.3

2029 Credit Agreement, dated March 25, 2024, among the registrant, John Deere Capital Corporation, John Deere Bank S.A., various financial institutions, JPMorgan Chase Bank, N.A., as Administrative Agent, Bank of America, N.A. and Citibank, N.A., as Co-Syndication Agents, and J.P. Morgan Securities LLC, as Sustainability Structuring Agent

31.1

Rule 13a-14(a)/15d-14(a) Certification

31.2

Rule 13a-14(a)/15d-14(a) Certification

32

Section 1350 Certifications (furnished herewith)

101.INS

Inline XBRL Instance Document (the instance document does not appear in the Interactive Data File because its XBRL tags are embedded within the Inline XBRL document)

101.SCH

Inline XBRL Taxonomy Extension Schema Document

101.CAL

Inline XBRL Taxonomy Extension Calculation Linkbase Document

101.DEF

Inline XBRL Taxonomy Extension Definition Linkbase Document

101.LAB

Inline XBRL Taxonomy Extension Label Linkbase Document

101.PRE

Inline XBRL Taxonomy Extension Presentation Linkbase Document

104

Cover Page Interactive Data File (formatted as Inline XBRL and contained in Exhibit 101)

*Incorporated by reference.

41

SIGNATURES


Pursuant to the requirements of the Securities Exchange Act of 1934, the registrant has duly caused this report to be signed on its behalf by the undersigned thereunto duly authorized.

DEERE & COMPANY

Date:

May 30, 2024

By:

/s/ Joshua A. Jepsen

Joshua A. Jepsen
Senior Vice President and Chief Financial Officer

(Principal Financial Officer and

Principal Accounting Officer)

42