REGISTRATION STATEMENT PURSUANT TO SECTION 12(b) OR (g) OF THE SECURITIES EXCHANGE ACT OF 1934 |
ANNUAL REPORT PURSUANT TO SECTION 13 OR 15(d) OF THE SECURITIES EXCHANGE ACT OF 1934 |
TRANSITION REPORT PURSUANT TO SECTION 13 OR 15(d) OF THE SECURITIES EXCHANGE ACT OF 1934 |
SHELL COMPANY REPORT PURSUANT TO SECTION 13 OR 15(d) OF THE SECURITIES EXCHANGE ACT OF 1934 |
Title of each class |
Trading Symbol(s) |
Name of each exchange on which registered | ||
Accelerated filer ☐ | Non-accelerated filer ☐ | |||
Emerging growth company |
U.S. GAAP ☐ |
by the International Accounting Standards Board ☒ |
Other ☐ |
TABLE OF CONTENTS
WNS (HOLDINGS) LIMITED
Ex-2.3 Description of securities registered under Section 12 of the Securities Exchange Act of 1934, as amended
Ex 4.4 Form of the Third Amended and Restated WNS (Holdings) Limited 2016 Incentive Award Plan — incorporated by reference to Exhibit 99.1 of WNS (Holdings) Limited’s Report on Form 6-K (File No. 001-32945), as furnished to the Commission on July 16, 2021
Ex 4.9 Lease Deed dated December 16, 2020 between WNS Global Services Private Limited and DLF Assets Private Limited with respect to the lease of office premises on the 10th floor of Block 10 at DLF IT Park.
Ex 4.10 Leave and License Agreement dated Feb 15, 2021 between Godrej and Boyce Manufacturing Company Limited and WNS Global Services Private Limited with respect to the lease of the office premises with an aggregate area of 84,429 square feet at plant 10.
Ex 4.11 Leave and License Agreement dated Feb 15, 2021 between Godrej and Boyce Manufacturing Company Limited and WNS Global Services Private Limited with respect to the lease of the office premises with an aggregate area of 1,08,000 square feet at plant 5.
Ex 4.12 Leave and License Agreement dated Feb 15, 2021 between Godrej and Boyce Manufacturing Company Limited and WNS Global Services Private Limited with respect to the lease of the office premises with an aggregate area of 84,934 square feet at plant
Ex-8.1 List of subsidiaries of WNS (Holdings) Limited
Ex-12.1 Certification by the Chief Executive Officer to 17 CFR 240, 15d-14(a), as adopted pursuant to Section 302 of the Sarbanes-Oxley Act of 2002
Ex-12.2 Certification by the Chief Financial Officer to 17 CFR 240, 15d-14(a), as adopted pursuant to Section 302 of the Sarbanes-Oxley Act of 2002
Ex-13.1 Certification by the Chief Executive Officer to 18 U.S.C. Section 1350, as adopted pursuant to Section 906 of the Sarbanes-Oxley Act of 2002
Ex-13.2 Certification by the Chief Financial Officer to 18 U.S.C. Section 1350, as adopted pursuant to Section 906 of the Sarbanes-Oxley Act of 2002
Ex-15.1 Consent of Grant Thornton Bharat LLP, independent registered public accounting firm
Ex-19.1 Insider Trading Policy
Ex-97.1 Policy for Recovery of Erroneously Awarded Compensation
1
CONVENTIONS USED IN THIS ANNUAL REPORT
In this annual report, references to “US” are to the United States of America, its territories and its possessions. References to “UK” are to the United Kingdom. References to “EU” are to the European Union. References to “India” are to the Republic of India. References to “China” are to the People’s Republic of China. References to “South Africa” are to the Republic of South Africa. References to “$” or “dollars” or “US dollars” are to the legal currency of the US, references to “ ₹ ” or “Indian rupees” are to the legal currency of India, references to “pound sterling” or “£” are to the legal currency of the UK, references to “pence” are to the legal currency of Jersey, Channel Islands, references to “Euro” are to the legal currency of the European Monetary Union, references to “South African rand” or “R” or “ZAR” are to the legal currency of South Africa, references to “A$” or “AUD” or “Australian dollars” are to the legal currency of Australia, references to “CHF” or “Swiss Franc” are to the legal currency of Switzerland, references to “RMB” are to the legal currency of China, references to “LKR” or “Sri Lankan rupees” are to the legal currency of Sri Lanka, references to “PHP” or “Philippine Peso” are to the legal currency of the Philippines and references to “NZD” or “New Zealand Dollar” are to the legal currency of New Zealand. Our consolidated financial statements are presented in US dollars. Our consolidated financial statements included in this annual report are prepared in accordance with the International Financial Reporting Standards and its interpretations (“IFRS”), as issued by the International Accounting Standards Board (“IASB”). Unless otherwise indicated, references to “GAAP” in this annual report are to IFRS, as issued by the IASB.
References to a particular “fiscal” year are to our fiscal year ended March 31 of that calendar year. Any discrepancies in any table between totals and sums of the amount listed are due to rounding. Any amount stated to be $0.0 million represents an amount less than $5,000.
In this annual report, unless otherwise specified or the context requires, the term “WNS” refers to WNS (Holdings) Limited, a public company incorporated under the laws of Jersey, Channel Islands, and the terms “our company,” “we,” “our” and “us” refer to WNS (Holdings) Limited and its subsidiaries.
In this annual report, references to “SEC” or “Commission” are to the United States Securities and Exchange Commission.
We also refer in various places within this annual report to “revenue less repair payments,” which is a non-GAAP financial measure that is calculated as (a) revenue less (b) in our auto claims business, payments to repair centers for “fault” repair cases where we act as the principal in our dealings with the third party repair centers and our clients. This non-GAAP financial information is not meant to be considered in isolation or as a substitute for our financial results prepared in accordance with GAAP.
We refer to information regarding the business process management (“BPM”) industry, our company and our competitors from market research reports, analyst reports and other publicly available sources. Although we believe that this information is reliable, we have not independently verified the accuracy and completeness of the information. We caution you not to place undue reliance on this data. BPM services are also sometimes referred to as business process outsourcing (“BPO”) services.
2
SPECIAL NOTE REGARDING FORWARD-LOOKING STATEMENTS
This annual report contains “forward-looking statements” that are based on our current expectations, assumptions, estimates and projections about our company and our industry. The forward-looking statements are subject to various risks and uncertainties. Generally, these forward-looking statements can be identified by the use of forward-looking terminology such as “anticipate,” “believe,” “estimate,” “expect,” “intend,” “will,” “project,” “seek,” “should” and similar expressions. Those statements include, among other things, the discussions of our business strategy and expectations concerning our market position, future operations, margins, profitability, liquidity and capital resources, tax assessment orders and future capital expenditures. We caution you that reliance on any forward-looking statement inherently involves risks and uncertainties, and that although we believe that the assumptions on which our forward-looking statements are based are reasonable, any of those assumptions could prove to be inaccurate, and, as a result, the forward-looking statements based on those assumptions could be materially incorrect. These risks and uncertainties include but are not limited to:
• | worldwide economic and business conditions; |
• | our dependence on a limited number of clients in a limited number of industries; |
• | currency fluctuations among the Indian rupee, the pound sterling, the US dollar, the Australian dollar, the Euro, the South African rand and the Philippine peso; |
• | political or economic instability in the jurisdictions where we have operations; |
• | regulatory, legislative and judicial developments; |
• | increasing competition in the BPM industry; |
• | technological innovation; |
• | our liability arising from cybersecurity attacks, fraud or unauthorized disclosure of sensitive or confidential client and customer data; |
• | telecommunications or technology disruptions; |
• | our ability to attract and retain clients; |
• | negative public reaction in the US or the UK to offshore outsourcing; |
• | our ability to collect our receivables from, or bill our unbilled services to, our clients; |
• | our ability to expand our business or effectively manage growth; |
• | our ability to hire and retain enough sufficiently trained employees to support our operations; |
• | the effects of our different pricing strategies or those of our competitors; |
• | our ability to successfully consummate, integrate and achieve accretive benefits from our strategic acquisitions, and to successfully grow our revenue and expand our service offerings and market share; |
• | future regulatory actions and conditions in our operating areas; |
• | our ability to manage the impact of climate change on our business; |
• | volatility of our share price; |
• | the possibility of a resurgence of coronavirus disease 2019 (“COVID-19”) pandemic and related impact on our and our clients’ business, financial condition, results of operations and cash flows; and |
• | our ability to transition to reporting on US domestic issuer forms and filing financial statements under US GAAP. |
These and other factors are more fully discussed in “Part I — Item 3. Key Information — D. Risk Factors,” “Part I — Item 5. Operating and Financial Review and Prospects” and elsewhere in this annual report. In light of these and other uncertainties, you should not conclude that we will necessarily achieve any plans, objectives or projected financial results referred to in any of the forward-looking statements. Except as required by law, we do not undertake to release revisions of any of these forward-looking statements to reflect future events or circumstances.
3
PART I
ITEM 1. IDENTITY OF DIRECTORS, SENIOR MANAGEMENT AND ADVISERS
Not applicable.
ITEM 2. OFFER STATISTICS AND EXPECTED TIMETABLE
Not applicable.
ITEM 3. KEY INFORMATION
A. [Reserved]
B. Capitalization and Indebtedness
Not applicable.
C. Reason for the Offer and the Use of Proceeds
Not applicable.
4
D. Risk Factors
This annual report contains forward-looking statements that involve risks and uncertainties. Our actual results could differ materially from those anticipated in these forward-looking statements as a result of a number of factors, including those described in the following risk factors and elsewhere in this annual report. If any of the following risks actually occur, our business, financial condition, results of operations and cash flows could suffer and the trading price of our ordinary shares could decline.
Risks Related to Our Business
The global economic and geo-political conditions have been and continue to be challenging and have had, and may continue to have, an adverse effect on the financial markets and the economy in general, which has had, and may continue to have, a material adverse effect on our business, clients, employees, financial performance, results of operations and cash flows and the prices of our ordinary shares.
As we have operations in 13 countries and service clients across multiple geographic regions, our business, financial performance and results of operations depend significantly on worldwide macroeconomic and geo-political conditions. Recent economic conditions and geo-political developments have been and continue to be challenging for global economies and could materially and adversely affect our business and financial performance.
Economic factors, such as recessionary economic cycles, inflation, rising interest rates, fluctuations in foreign exchange rates, monetary tightening and volatility in the financial markets, have impacted, and may continue to impact, our business, financial condition and results of operations. The current global economic slowdown and the possibility of continued turbulence or uncertainty in the European, US, Asian and international financial markets and economies have adversely affected, and may continue to adversely affect, our and our clients’ liquidity and financial condition. Relatively high levels of inflation in the various geographies where we operate have resulted in increased supply costs, which in turn have impacted pricing and consumer demand. Although key policy rates across most of the sovereign Central Banks (CBs) have peaked, the gradual decline in inflation level but still relatively higher than the CB’s targeted level has derailed the cut in policy rate. The higher interest rates, coupled with tighter credit markets and relatively wider credit spreads, may increase our cost of borrowing and cause credit to become more limited, which could have a material adverse effect on not only on our financial condition, liquidity and cash flows, but also on our clients’ ability to use credit to purchase our services or to make timely payments to us. In addition, as a result of high debt levels, a number of countries have required and may continue to require additional financial support, sovereign credit ratings have declined and may continue to decline, and there may be default on the sovereign debt obligations of certain countries. Uncertainties remain regarding future central bank and other economic policies in the US and EU. Such uncertain macroeconomic conditions may further lead to increased volatility in the currency and financial markets globally. For example, the recent appreciation of the US dollar may have an unpredictable impact on our company in a number of ways, including the conversion of our operating results into our reporting currency, the US dollar. For further information, see “ Currency fluctuations among the Indian rupee, the pound sterling, the US dollar, the Australian dollar, the Euro, the South African rand and the Philippine peso could have a material adverse effect on our results of operations.” In addition, volatility in the financial markets could have a material impact on the price of our ordinary shares. We cannot predict the trajectory of the recent economic slowdown or any subsequent economic recovery. If adverse macroeconomic conditions continue for a prolonged period of time or even worsen, our business, financial condition and results of operations will be adversely affected.
Government policies or objectives pursued by countries in which we do business could potentially impact the demand for our services in certain countries. Changes in trade policies, increases in tariffs, the imposition of retaliatory tariffs, including those implemented by the United States, China and Europe and legislation requiring greater oversight of supply chains, may have a material adverse effect on global economic conditions and the stability of global financial markets and may reduce international trade.
Geopolitical crises, such as war, political instability and terrorist attacks, could disrupt our operations. The prolonged conflict between Russia and Ukraine and the recent conflict between Israel and Hamas have led and could lead to significant market and other disruptions, including significant volatility in commodity prices, supply of energy resources, instability in financial markets, supply chain interruptions, political and social instability, changes in consumer or purchaser preferences as well as increase in cyberattacks and espionage. We have operations in Poland and Romania, which border Ukraine and have been materially and adversely affected by inflation, particularly increases in energy and food prices, resulting from disrupted supplies from Russia and Ukraine. In addition, as a result of the ongoing military conflict, there has been a growing number of migrants in Poland and Romania. Such an influx of migrants could further exacerbate inflation in these two countries, thereby resulting in an upward pressure on wages, which could have a material adverse effect on our operations in these two countries. The length, impact and outcome of the ongoing military conflict in Ukraine are highly unpredictable. If the conflict continues or extends beyond Ukraine, it would continue to have a significant impact on the global economy and our operations in Poland and Romania.
Additionally, major political events, including the UK’s withdrawal from the EU in January 2020, commonly referred to as “Brexit,” has also created uncertainty for businesses such as ours that operate in these markets. While the UK and the EU have ratified a trade and cooperation agreement to govern their relationship after Brexit, the agreement merely sets forth a framework in many respects and requires additional bilateral negotiations between the UK and the EU as both parties continue to work on the rules for implementation. Significant political and economic uncertainty remains about how the precise terms of the relationship between the parties will differ from the terms before withdrawal. Such terms could adversely affect the economic conditions in affected markets as well as the stability of the global financial markets, which in turn have had and may continue to have a material adverse effect on global economic conditions and financial markets, and may significantly reduce global market liquidity, restrict the ability of key market participants to operate in certain financial markets or restrict our access to capital. 24.2% of our revenues and 21.9% of our revenue less repair payments (non-GAAP) in fiscal 2024 and 25.4% of our revenues and 21.4% of our revenue less repair payments (non-GAAP) in fiscal 2023 were denominated in pound sterling. The extent and duration of the decline in the value of the pound sterling to the US dollar and other currencies is unknown at this time. A long-term reduction in the value of the pound sterling as a result of Brexit or otherwise could adversely impact our earnings growth rate and profitability. Although we believe that our hedging program is effective, there is no assurance that it will protect us against fluctuations in foreign currency exchange rates.
5
A few major clients account for a significant portion of our revenue and any loss of business from these clients could reduce our revenue and significantly harm our business.
We have derived and believe that we will continue to derive in the near term a significant portion of our revenue from a limited number of large clients. In fiscal 2024 and 2023, our five largest clients accounted for 20.9% and 23.8% of our revenue and 21.6% and 25.0% of our revenue less repair payments (non-GAAP), respectively. In fiscal 2024 and 2023, our three largest clients accounted for 13.4% and 15.7% of our revenue and 13.8% and 16.6% of our revenue less repair payments (non-GAAP), respectively. In fiscal 2024, our largest client individually accounted for 4.9% and 5.1% of our revenue and revenue less repair payments (non-GAAP), respectively, as compared to 6.5% and 6.8% in fiscal 2023, respectively. Any loss of business from any major client could reduce our revenue and significantly harm our business.
For example, one of our top five customers by revenue contribution in fiscal 2024, which is in the HCLS SBU, served a termination notice on January 31, 2024. The customer accounted for 4.1%, 6.5% and 7.3% of our revenue and 4.2%, 6.8% and 7.9% of our revenue less repair payments (non-GAAP) in fiscal 2024, fiscal 2023 and fiscal 2022, respectively. This termination is effective July 1, 2024. Although the termination did not impact our revenue in fiscal 2024, we were required to perform an impairment assessment for the intangible asset recognized in relation to this client. Based on our assessment, we recorded an impairment charge of $30.9 million to our results of operations in fiscal 2024 on the aforementioned intangible asset.
In addition, the volume of work performed for specific clients is likely to vary from year to year, particularly since we may not be the exclusive outside service provider for our clients. Thus, a major client in one year may not provide the same level of revenue in any subsequent year. For example, until fiscal 2018, Aviva Global Services (Management Services) Private Limited (“Aviva MS”) was our largest client and revenue from Aviva MS decreased from $54.5 million in fiscal 2017 to $51.9 million in fiscal 2018 to $50.1 million in fiscal 2019 and increased to $53.3 million in fiscal 2020. This decline in revenue of fiscal 2018 and 2019 was partially attributable in part to revised pricing terms and in part to a reduction of services due to automation performed by Aviva MS and the automation of certain services by WNS. We have derived, and we expect to continue to derive for the foreseeable future, a significant portion of our revenue from Aviva MS. Under our master services agreement with Aviva MS, Aviva MS is permitted to terminate the agreement without cause with 180 days’ notice upon payment of a termination fee. The loss of some or all of the business of any large client could have a material adverse effect on our business, results of operations, financial condition and cash flows. A number of factors other than our performance could cause the loss of or reduction in business or revenue from a client, and these factors are not predictable. For example, a client may demand price reductions, change its outsourcing strategy or move work in-house. A client may also be acquired by a company with a different outsourcing strategy that favors switching to another BPM service provider or returning work in-house.
6
Our revenue is highly dependent on clients concentrated in a few industries, as well as clients located primarily in the US, the UK, Europe and Australia. Economic slowdowns or factors that affect these industries or the economic environment in the US, the UK, Europe or Australia could reduce our revenue and seriously harm our business.
A substantial portion of our clients are concentrated in the insurance industry, healthcare industry and the travel and leisure industry. In fiscal 2024 and 2023, 27.3% and 26.8% of our revenue, respectively, and 25.1% and 22.9% of our revenue less repair payments (non-GAAP), respectively, was derived from clients in the insurance industry. During the same periods, clients in the travel and leisure industry contributed 16.1% and 16.9% of our revenue, respectively, and 16.6% and 17.9% of our revenue less repair payments (non-GAAP), respectively and clients in the healthcare industry contributed 13.4% and 15.7% of our revenue, respectively, and 13.8% and 16.6% of our revenue less repair payments (non-GAAP), respectively. Our business and growth largely depend on continued demand for our services from clients in these industries and other industries that we may target in the future, as well as on trends in these industries to outsource business processes.
The current global macroeconomic and geo-political conditions have affected, and may continue to affect, both the industries in which our clients are concentrated and the geographies in which we do business. For more information, see “— The global economic and geo-political conditions have been and continue to be challenging and have had, and may continue to have, an adverse effect on the financial markets and the economy in general, which has had, and may continue to have, a material adverse effect on our business, clients, employees, financial performance, results of operations and cash flows and the prices of our ordinary shares.” Certain of our targeted industries are especially vulnerable to crises in the financial and credit markets and potential economic downturns. Our results of operations depend on, among other things, our ability to maintain and increase our sales volume with existing clients and to attract new clients. Any future global economic uncertainty, as a result of any global pandemic / epidemic, rising inflation, high interest rates or otherwise, may affect, the demand for our services across industries from our clients, depending on the ability of each client to cope with the effects of these developments, as well as the nature of each client’s industries, products and services. A downturn in any of our targeted industries, a slowdown or reversal of the trend to offshore business process outsourcing in any of these industries or the introduction of regulation which restricts or discourages companies from outsourcing could result in a decrease in the demand for our services and adversely affect our results of operations. For instance, the ongoing military conflict between Russia and Ukraine, especially in the event of further escalation beyond the borders of Ukraine and potential cascading effects of the sanctions on Russia, and the conflict between Israel and Hamas could have a material adverse effect on global trade and travel. Our business has been, and we expect it will continue to be, impacted across industry verticals due to the Russia-Ukraine conflict.
In addition, any further weakening of or continuing uncertainty in worldwide economic and business conditions could result in a few of our clients reducing or postponing their outsourced business requirements. Additionally, our revenue is highly dependent on the economic environments in the US, the UK, Europe and Australia. In fiscal 2024 and 2023, 47.1% and 49.2% of our revenue, respectively, and 48.5% and 51.8% of our revenue less repair payments (non-GAAP), respectively, were derived from clients located in the US. During the same periods, 28.3% and 28.7% of our revenue, respectively, and 26.2% and 24.9% of our revenue less repair payments (non-GAAP), respectively, were derived from clients located in the UK, 8.3% and 7.1% of our revenue, respectively, and 8.5% and 7.4% of our revenue less repair payments (non-GAAP), respectively, were derived from clients located in Europe (excluding the UK), and 6.5% and 6.1% of our revenue, respectively, and 6.7% and 6.4% of our revenue less repair payments (non-GAAP), respectively, were derived from clients located in Australia. Any further weakening of or continuing uncertainty in the US, UK, European or Australian economy will likely have a further adverse impact on our revenue.
Other developments may also lead to a decline in the demand for our services in our targeted industries. Significant changes in the financial services industry or any of the other industries on which we focus, or a consolidation in any of these industries or acquisitions, particularly involving our clients, may decrease the potential number of buyers of our services and have an adverse impact on our profitability. Any significant reduction in or the elimination of the use of the services we provide within any of these industries would result in reduced revenue and harm our business. Our clients may experience rapid changes in their prospects, substantial price competition and pressure on their profitability. Although such pressures can encourage outsourcing as a cost reduction measure, they may also result in increasing pressure on us from clients in these key industries to lower our prices which could negatively affect our business, results of operations, financial condition and cash flows.
7
Currency fluctuations among the Indian rupee, the pound sterling, the US dollar, the Australian dollar, the Euro, the South African rand and the Philippine peso could have a material adverse effect on our results of operations.
Although substantially all of our revenue is denominated in US dollars, pound sterling, and to a lesser extent, Euro, Australian dollars, and South African rand, a significant portion of our expenses (other than payments to repair centers, which are primarily denominated in pound sterling) are incurred and paid in Indian rupees and, to a lesser extent, in South African rand and Philippine peso. Therefore, a weakening of the rate of exchange for the pound sterling, the US dollar, the Australian dollar or Euro against the Indian rupee or, to a lesser extent, a weakening of the pound sterling against the South African rand or the Philippine peso would adversely affect our results. Furthermore, we report our financial results in US dollars and our results of operations would be adversely affected if the pound sterling, Euro or the Australian dollar depreciates against the US dollar, or if the Indian rupee or, to a lesser extent, the South African rand or the Philippine peso appreciates against the US dollar.
Fluctuations between the Indian rupee, the pound sterling, the Australian dollar, the Euro, the South African rand or the Philippine peso, on the one hand, and the US dollar, on the other hand, expose us to translation risk when transactions denominated in such currencies are translated to US dollars, our reporting currency. The exchange rates between each of the Indian rupee, the pound sterling, the Australian dollar, the Euro, the South African rand or the Philippine peso, on the one hand, and the US dollar, on the other hand, have changed substantially in recent years and may fluctuate substantially in the future.
In addition, the military conflict between Russia and Ukraine may have substantial impact on the global economy and may result in unpredictable fluctuations in foreign currency exchange rates, and in particular, may negatively impact the pound sterling, the Euro and other currencies in which our revenue is denominated. The withdrawal of the UK from the EU in January 2020 has created significant political and economic uncertainty regarding the trading relationship between the UK and the EU.
The average Indian rupee to US dollar exchange rate was approximately ₹82.77 per $1.00 in fiscal 2024, which represented a depreciation of the Indian rupee by an average of 3.0% as compared with the average exchange rate of approximately ₹80.33 per $1.00 in fiscal 2023, which in turn represented a depreciation of the Indian rupee by an average of 7.3% as compared with the average exchange rate of approximately ₹74.49 per $1.00 in fiscal 2022.
The average pound sterling to US dollar exchange rate was approximately £0.80 per $1.00 in fiscal 2024, which represented a appreciation of the pound sterling by an average of 4.2% as compared with the average exchange rate of approximately £0.83 per $1.00 in fiscal 2023, which in turn represented an depreciation of the pound sterling by an average of 11.8% as compared with the average exchange rate of approximately £0.73 per $1.00 in fiscal 2022.
The average Australian dollar to US dollar exchange rate was approximately A$1.52 per $1.00 in fiscal 2024, which represented a depreciation of the Australian dollar by an average of 4.0% as compared with the average exchange rate of approximately A$1.46 per $1.00 in fiscal 2023, which in turn represented an depreciation of the Australian dollar by an average of 7.3% as compared with the average exchange rate of approximately A$1.35 per $1.00 in fiscal 2022.
The average Euro to US dollar exchange rate was approximately €0.92 per $1.00 in fiscal 2024, which represented a appreciation of the Euro by an average of 4.1% as compared with the average exchange rate of approximately €0.96 per $1.00 in fiscal 2023, which in turn represented a depreciation of the Euro by an average of 10.4% as compared with the average exchange rate of approximately €$0.86 per $1.00 in fiscal 2022.
The average South African rand to US dollar exchange rate was approximately R18.73 per $1.00 in fiscal 2024, which represented a depreciation of the South African rand by an average of 10.3% as compared with the average exchange rate of approximately R16.98 per $1.00 in fiscal 2023, which in turn represented an depreciation of the South African rand by an average of 14.4% as compared with the average exchange rate of approximately R14.85 per $1.00 in fiscal 2022.
The average Philippine peso to US dollar exchange rate was approximately PHP 55.90 per $1.00 in fiscal 2024, which represented a depreciation of the Philippine peso by an average of 1.0% as compared with the average exchange rate of approximately PHP 55.32 per $1.00 in fiscal 2023, which in turn represented a depreciation of the Philippine peso by an average of 10.5% as compared with the average exchange rate of approximately PHP50.07 per $1.00 in fiscal 2022.
Our results of operations would be adversely affected if the Indian rupee appreciates significantly against the US dollar or if the pound sterling or the Australian dollar depreciates against the US dollar or, to a lesser extent, if the South African rand or the Philippine peso appreciates significantly against the US dollar.
For example, the depreciation of the Indian rupee, the Philippine peso and the South African rand and the appreciation of the pound sterling and the Euro against the US dollar in fiscal 2024 positively impacted our results of operations whereas the depreciation of the Australian dollar against the US dollar negatively impacted our results of operations.
The depreciation of the Indian rupee, the Philippine peso and the South African rand against the US dollar in fiscal 2023 positively impacted our results of operations whereas the depreciation of the pound sterling and the Australian dollar against the US dollar negatively impacted our results of operations during that year.
8
We hedge a portion of our foreign currency exposures using options and forward contracts. We cannot assure you that our hedging strategy will be successful or will mitigate our exposure to currency risk.
The international nature of our business exposes us to several risks, such as unexpected changes in the regulatory requirements and governmental policy changes of multiple jurisdictions.
We have operations in Canada, China, Costa Rica, India, Malaysia, the Philippines, Poland, Romania, South Africa, Sri Lanka, Turkey, the UK and the US, and we service clients across Asia, Europe, South Africa, Australia and North America. Our corporate structure also spans multiple jurisdictions, with our parent holding company incorporated in Jersey, Channel Islands, and intermediate and operating subsidiaries (including branch offices) incorporated in Australia, Canada, China, Costa Rica, France, India, Mauritius, the Netherlands, the Philippines, Romania, South Africa, Singapore, Sri Lanka, Spain, Turkey, the United Arab Emirates, the UK and the US. As a result, we are exposed to risks typically associated with conducting business internationally, many of which are beyond our control. These risks include:
• | legal uncertainty owing to the overlap of different legal regimes, and problems in asserting contractual or other rights across international borders; |
• | potentially adverse tax consequences, such as scrutiny of transfer pricing arrangements by authorities in the countries in which we operate; |
• | potential tariffs and other trade barriers; |
• | unexpected changes in legal regimes and regulatory requirements; and |
• | policy changes due to changes in government. |
During the fourth quarter of fiscal 2020, Brexit had a negative impact on the insurance industry and applied downward pressure on the expected future performance of the WNS Auto Claims business, due to contract renegotiations and loss of certain clients. These factors, together with the highly uncertain operating environment in the UK, have negatively impacted and caused us to significantly reduce our financial projections and estimates of the WNS Auto Claims business from our previous estimates. Accordingly, we performed an impairment review of the goodwill associated with the companies we had acquired for our auto claims business and recorded an impairment charge of $4.1 million to our results of operations in fiscal 2020 for the remaining goodwill balance of our auto claims business.
The occurrence of other changes in legal regimes or regulatory requirements, or any other events associated with the risks of conducting business internationally, could have a material adverse effect on our results of operations and financial condition.
9
Our global operations expose us to numerous and sometimes conflicting legal and regulatory requirements. Failure to adhere to the laws and regulations that govern our business or our clients’ businesses that we are required to comply with in performing our services could harm our business.
We have operations in 13 countries and our corporate structure spans multiple jurisdictions. Further, we service clients across multiple geographic regions and multiple industries. We are required to comply with numerous, and sometimes conflicting and uncertain, laws and regulations including on matters relating to import/export controls, trade restrictions, taxation, immigration, internal disclosure and control obligations, securities regulation, anti-competition, data privacy and protection, anti-corruption, and employment and labor relations. In addition, we are required to obtain and maintain permits and licenses for the conduct of our business in various jurisdictions. Our clients’ business operations are also subject to numerous regulations in the jurisdiction in which they operate or that are applicable to their industry, and our clients may contractually require that we perform our services in compliance with regulations applicable to them or in a manner that will enable them to comply with such regulations. For example, regulations to which our and our clients’ business operations are subject include the Gramm-Leach-Bliley Act, the Health Insurance Portability and Accountability Act, the Health Information Technology for Economic and Clinical Health Act and the California Consumer Privacy Act in the US, the Financial Services Act in the UK and the General Data Protection Regulation in the EU. Countries around the world, including those where we have business operations and where we service customers for our clients, have adopted or have proposed to adopt in the near future, comprehensive privacy and personal data protection laws, including the Protection of Personal Information Act (POPI) in South Africa and the upcoming Personal Data Protection Bill (PDPB) in India. EU regulators have also adopted revised standard contractual clauses that add requirements for transferring EU personal data to other jurisdictions, which may increase compliance and operational costs and legal risks and liabilities of that data transfer mechanism. In addition, our subsidiary, HealthHelp, administers programs offered by the Centers for Medicare & Medicaid Services, a United States federal agency that administers Medicare and Medicaid. Regulatory changes may result in our exiting certain parts of our business.
On account of the global nature of our and our clients’ operations, compliance with diverse legal and regulatory requirements is difficult, time-consuming and requires significant resources. Further, the extent of development of legal systems varies across the countries in which we operate and local laws may not be adequately developed or be able to provide us clear guidance to sufficiently protect our rights. Specifically, in many countries including those in which we operate and/or seek to expand to, the practices of local businesses may not be in accordance with international business standards and could violate anti-corruption laws and regulations, including the UK Bribery Act 2010 and the US Foreign Corrupt Practices Act 1977. Our employees, subcontractors, agents, business partners, the companies we acquire and their employees, subcontractors and agents, and other third parties with which we associate, could act in a manner which violates policies or procedures intended to ensure compliance with laws and regulations, including applicable anti-corruption laws or regulations.
Violations of such laws or regulations by us, our employees or any of these third parties could subject us to criminal or civil enforcement actions (whether or not we participated or were aware of the actions leading to the violations), including fines or penalties, breach of contract damages, disgorgement of profits and suspension or disqualification from work, any of which could materially and adversely affect our business, including our results of operations and our reputation. If we are unable to maintain our licenses, permits or other qualifications necessary to provide our services, we may not be able to provide services to existing clients or be able to attract new clients and could lose revenue, which could have a material adverse effect on our business.
10
We face competition from onshore and offshore BPM companies and from information technology companies that also offer BPM services. Our clients may also choose to run their business processes themselves, either in their home countries or through captive units located offshore.
The market for outsourcing services is very competitive and we expect competition to intensify and increase from a number of sources. We believe that the principal competitive factors in our markets are price, service quality, sales and marketing skills, business process transformation capabilities and industry expertise. We face significant competition from our clients’ own in-house groups including, in some cases, in-house departments operating offshore or captive units. Clients who currently outsource a significant proportion of their business processes or information technology services to vendors in India may, for various reasons, including diversifying geographic risk, seek to reduce their dependence on any one country. We also face competition from onshore and offshore BPM and information technology services companies. In addition, the trend toward offshore outsourcing, international expansion by foreign and domestic competitors and continuing technological changes will result in new and different competitors entering our markets. The COVID-19 pandemic further hastened the development and adoption of such technological changes that may accelerate the pace of disintermediation, which may impact the services that the BPM industry currently provides.
These competitors may include entrants from the communications, software and data networking industries or entrants in geographic locations with lower costs than those in which we operate. Technological changes include the development of complex automated systems for the processing of transactions that are formerly labor intensive, which may reduce or replace the need for outsourcing such transaction processing.
Some of these existing and future competitors have greater financial, human and other resources, longer operating histories, greater technological expertise, more recognizable brand names and more established relationships in the industries that we currently serve or may serve in the future. In addition, some of our competitors may enter into strategic or commercial relationships among themselves or with larger, more established companies in order to increase their ability to address client needs, or enter into similar arrangements with potential clients. Increased competition, our inability to compete successfully against competitors, pricing pressures or loss of market share could result in reduced operating margins which could harm our business, results of operations, financial condition and cash flows.
Changes in technology could lead to changes in our clients’ businesses as well as their requirements for business process services, which may adversely impact our business and results of operations.
Proliferation of accessible technology, such as smartphones and internet, has had an impact on the manner in which customers and businesses interact with each other. Companies are increasingly adopting social media platforms, online self-help portals and mobile applications for communicating with and servicing their customers rather than utilizing BPM companies such as ourselves to manage these interactions. Our clients also continue to invest in technology by upgrading their platforms and application capabilities towards increased automation of transactions. Advances in software, such as artificial intelligence, machine learning, robotic process automation and voice recognition, have the potential to reduce dependency on human processing transactions. Such developments and other innovations, such as autonomous vehicles, have the potential to significantly change the way our clients’ businesses operate and may reduce their dependency on BPM companies, including our company, for managing their business processes. We are therefore subject to a risk of disintermediation on account of such changes in technology, which could impact our future growth prospects and may require continued investments in our business.
Additionally, in recent years, as a result of a number of factors, including changing client preferences, an increase in data and AI services and economic pressures that can cause delays or reductions in client purchasing decisions, our clients have increasingly engaged us on a short-cycle basis. Increased short-cycle engagements make business forecasting more complex given that they are generally for services that are more discretionary and non-recurring than our traditional services. Our contracts for short-cycle engagements typically permit our clients to terminate the agreement with shorter notice than is required under our longer-term contracts. Our failure to properly manage these shorter-cycle engagements could adversely affect our business, growth strategy and results of operations.
If we cause disruptions to our clients’ businesses, provide inadequate service or are in breach of our representations or obligations, our clients may have claims for substantial damages against us. Our insurance coverage may be inadequate to cover these claims and, as a result, our profits may be substantially reduced.
Most of our contracts with clients contain service level and performance requirements, including requirements relating to the quality of our services and the timing and quality of responses to the client’s customer inquiries. In some cases, the quality of services that we provide is measured by quality assurance ratings and surveys which are based in part on the results of direct monitoring by our clients of interactions between our employees and our clients’ customers. Failure to consistently meet service level requirements of a client or errors made by our associates or the software and/or platforms we use in the course of delivering services to our clients could disrupt the client’s business and result in a reduction in revenue or a claim for substantial damages against us. For example, some of our agreements stipulate standards of service that, if not met by us, will require us to pay penalties to our clients or result in lower payment to us. Failure to meet these service level requirements could result in the payment of significant penalties by us to our clients which in turn could have an adverse effect on our business, results of operations, financial condition and cash flows. In addition, in connection with acquiring new business from a client or entering into client contracts, our employees may make various representations, including representations relating to the quality of our services, abilities of our associates and our project management techniques. A failure or inability to meet a contractual requirement or our representations could seriously damage our reputation and affect our ability to attract new business or result in a claim for substantial damages against us.
11
Our dependence on our offshore delivery centers requires us to maintain active data and voice communications between our main delivery centers in Canada, China, Costa Rica, India, Malaysia, the Philippines, Poland, Romania, South Africa, Sri Lanka, Turkey, the UK and the US, our international technology hubs in the UK and the US and our clients’ offices. Although we maintain redundant facilities and communications links, disruptions could result from, among other things, technical and electricity breakdowns, computer glitches and viruses and adverse weather conditions. For instance, we depend on a continuous supply of electricity to operate our IT infrastructure. As a result of the COVID-19 pandemic, we have adopted a “hybrid” model, whereby a significant portion of our employees are working from home. While we have implemented multiple levels of electrical redundancies at our operating premises to mitigate against the risk of power shortage, such measures may not be available at our employees’ homes. Several countries where we operate from could face power shortage in the future, which may disrupt our operations, including for employees working from home, and slow down the expansion of our operations in these countries. For instance:
• | South Africa has been facing widespread rolling power blackouts, with the current period of rolling blackouts taking place since March 2021, due to breakdowns in multiple power stations resulting in planned and unplanned power outages. |
• | Sri Lanka was unable to import sufficient oil required for electricity generation due to a foreign exchange crisis since 2021 and experienced nationwide power cuts in fiscal 2023. |
• | Poland and Romania had suffered disruption of gas and oil supplies from Russia since early 2022 as a result of the ongoing conflict between Ukraine and Russia. This had led to shortage of electricity generation as well as increased energy costs in the countries. |
• | India faced temporary power shortages from October to November 2021 as a result of shortages of coal used to generate electricity. |
Any significant failure of our equipment or systems, or any major disruption to basic infrastructure like power and telecommunications in the locations in which we operate, could impede our ability to provide services to our clients, have a negative impact on our reputation, cause us to lose clients, reduce our revenue and harm our business.
We depend on human resources to process transactions for our clients. Disruptive incidents, including man-made events such as military conflicts, civil strikes and shutdowns, may impact the ability of our employees to commute to and from our operating premises. Non-natural disasters, whether unintentional (such as those caused by accidents) or intentional (such as those caused by terrorist attacks), may also disrupt our operations. While we have implemented business continuity plans for clients where we have contractually agreed to do so, we may not always be able to provide services to our clients for the duration of such incidents.
Although under most of our contracts with our clients, our liability for breach of our obligations is limited to actual damages suffered by the client and capped at a portion of the fees paid or payable to us under the relevant contract, our liability for breach of our obligations under certain of our contracts is unlimited. With respect to those of our contracts that contain limitations on liability, such limitations may be unenforceable or otherwise may not protect us from liability for damages. In addition, certain liabilities, such as claims of third parties for which we may be required to indemnify our clients, are generally not limited under those agreements. Further, although we have professional indemnity insurance coverage, the coverage may not continue to be available on reasonable terms or in sufficient amounts to cover one or more large claims and our insurers may disclaim coverage as to any future claims. The successful assertion of one or more large claims against us that exceed available insurance coverage, or changes in our insurance policies (including premium increases or the imposition of large deductible or co-insurance requirements), could have a material adverse effect on our business, reputation, results of operations, financial condition and cash flows.
We are liable to our clients for damages caused by unauthorized disclosure of sensitive or confidential information, whether through a breach or circumvention of our or our clients’ computer systems and processes, through our employees or otherwise. Further, cybersecurity and data privacy considerations could impact our business.
We are typically required to manage, utilize and store sensitive or confidential client data in connection with the services we provide. Under the terms of our client contracts, we are required to keep such information strictly confidential. Our client contracts do not include any limitation on our liability to them with respect to breaches of our obligation to maintain confidentiality of the information we receive from them. Although we seek to implement measures to protect sensitive and confidential client data, there can be no assurance that we would be able to prevent breaches of security. Further, some of our projects require us to conduct business functions and computer operations using our clients’ systems over which we do not have control and which may not be compliant with industry security standards. In addition, some of the client designed processes that we are contractually required to follow for delivering services to them and which we are unable to unilaterally change, could be designed in a manner that allows for control weaknesses to exist and be exploited. Any vulnerability in a client’s system or client designed process, if exploited, could result in breaches of security or unauthorized transactions and result in a claim for substantial damages against us. Although we have implemented appropriate policies, procedures and infrastructure to reduce the possibility of physical, logical and personnel security breaches, along with appropriate audit oversight for verifying continued operating effectiveness of the same through internal audits and external SSAE18 / ISAE3402, ISO27001 and PCI-DSS reviews, such measures can never completely eliminate the risk of cybersecurity attacks. Additionally, remote-working solutions deployed since the COVID-19 pandemic could potentially result in heightened information technology security and data protection risks on account of services being delivered in a physically unsupervised environment. If any person, including any of our employees, penetrates our or our clients’ network security or otherwise mismanages or misappropriates sensitive or confidential client data, we could be subject to significant liability and lawsuits from our clients or their customers for breaching contractual confidentiality provisions or privacy laws.
12
The threat of cyberattacks has increased and evolved in recent years, with companies across the world, including us, having experienced a significant increase in attempted malicious attacks. To date, although there has not been a cybersecurity attack that has had a material adverse effect on our operations, there can be no assurance that there will be no material adverse effect in the future. Rapid advancements and changes to the technological landscape may require us to make significant further investments in the domain of cybersecurity in order to protect our and our clients’ data and infrastructure. In addition, such advancements coupled with the rise in the sophisticated nature of cyber threats and attacks make it possible that certain threats or vulnerabilities may not be detected in time to prevent an attack on our or our clients’ business. On account of the interconnected nature of our business, there is an interdependency between our clients, business partners and our business to implement appropriate cybersecurity controls in order to mitigate cybersecurity risk. A failure of cybersecurity controls at our client or business partners could therefore result in a breach at our company.
While we have insurance coverage for mismanagement or misappropriation of such information by our employees, that coverage may not continue to be available on reasonable terms or in sufficient amounts to cover one or more large claims against us, and our insurers may disclaim coverage as to any future claims. Penetration of the network security of our or our clients’ data centers or computer systems or unauthorized use or disclosure of sensitive or confidential client data, whether through breach of our or our clients’ computer systems, systems failure, loss or theft of assets containing confidential information or otherwise, could also have a negative impact on our reputation which would harm our business.
We also cannot be certain that advances in criminal capabilities (including cyber-attacks or cyber intrusions over the internet, malware, computer viruses and the like), discovery of new vulnerabilities or attempts to exploit existing vulnerabilities in our or our clients’ or business partners’ systems, other data thefts, physical system or network break-ins or inappropriate access, or other developments will not compromise or breach the technology protecting our or our client’s or business partners’ computer systems and networks that access and store sensitive information. Cyber threats, such as phishing and trojans, could intrude into our or our clients’ or business partners’ network to steal data or to seek sensitive information. Any intrusion into our network or our clients’ or business partners’ network (to the extent attributed to us or perceived to be attributed to us) that results in any breach of security could cause damage to our reputation and adversely impact our business and financial results. A significant failure in security measures could have a material adverse effect on our business, reputation, results of operations and financial condition.
13
Our business could be materially and adversely affected if we do not protect our intellectual property or if our services are found to infringe on the intellectual property of others.
Our success depends in part on certain methodologies, practices, tools and technical expertise we utilize in designing, developing, implementing and maintaining applications and other proprietary intellectual property rights. In order to protect our rights in such intellectual properties, we rely upon a combination of nondisclosure and other contractual arrangements as well as trade secret, copyright and trademark laws. We also generally enter into confidentiality agreements with our employees, consultants, clients and potential clients, and limit access to and distribution of our proprietary information to the extent required for our business purpose.
India is a member of the Berne Convention, an international treaty for the protection of literary and artistic works, and has agreed to recognize protections of such rights conferred under the laws of other foreign countries, including the laws of the United States. There can be no assurance that the laws, rules, regulations and treaties in effect in the United States, India and the other jurisdictions in which we operate and the contractual and other protective measures we take, are adequate to protect us from misappropriation or unauthorized use of our intellectual property, or that such laws will not change. We may not be able to detect unauthorized use and take appropriate steps to enforce our rights, and any such steps may not be successful. Infringement by others of our intellectual property, including the costs of enforcing our intellectual property rights, may have a material adverse effect on our business, results of operations and financial condition.
Our clients may provide us with access to, and require us to use, third party software in connection with our delivery of services to them. Our client contracts generally require our clients to indemnify us for any infringement of intellectual property rights or licenses to third party software when our clients provide such access to us. If the indemnities under our client contracts are inadequate to cover the damages and losses, we suffer due to infringement of third party intellectual property rights or licenses to third party software to which we were given access, our business and results of operations could be adversely affected. We are also generally required by our client contracts to indemnify our clients for any breaches of intellectual property rights by our services. Although we believe that we are not infringing on the intellectual property rights of others, claims may nonetheless be asserted against us in the future, whether or not they are successful The costs of defending any such claims could be significant, and any successful claim may require us to modify, discontinue or rename any of our services. Any such changes may have a material adverse effect on our business, results of operations and financial condition.
Our clients may terminate contracts before completion or choose not to renew contracts, which could adversely affect our business and reduce our revenue.
The terms of our client contracts typically range from three to five years. Many of our client contracts can be terminated by our clients with or without cause, with three to six months’ notice and, in most cases, without penalty. The termination of a substantial percentage of these contracts could adversely affect our business and reduce our revenue. Contracts that will expire on or before March 31, 2025 (including work orders/statement of works that will expire on or before March 31, 2025) represented approximately 11.0% of our revenue and 11.3% of our revenue less repair payments (non-GAAP) from our clients in fiscal 2023. Failure to meet contractual requirements could result in cancellation or non-renewal of a contract. Some of our contracts may be terminated by the client if certain of our key personnel working on the client project leave our employment and we are unable to find suitable replacements. In addition, a contract termination or significant reduction in work assigned to us by a major client could cause us to experience a higher than expected number of unassigned employees, which would increase our cost of revenue as a percentage of revenue until we are able to reduce or reallocate our headcount. We may not be able to replace any client that elects to terminate or not renew its contract with us, which would adversely affect our business and revenue. Further, we may face difficulties in providing end-to-end business solutions or delivering complex, large or unique projects for our clients that could cause clients to terminate or not renew their contracts with us, which in turn could harm our business and our reputation.
For example, one of our top five customers by revenue contribution in fiscal 2024, which is in the HCLS SBU, served a termination notice on January 31, 2024. The customer accounted for 4.1%, 6.5% and 7.3% of our revenue and 4.2%, 6.8% and 7.9% of our revenue less repair payments (non-GAAP) in fiscal 2024, fiscal 2023 and fiscal 2022, respectively. This termination is effective July 1, 2024. Although the termination did not impact our revenue in fiscal 2024, we were required to perform an impairment assessment for the intangible asset recognized in relation to this client. Based on our assessment, we recorded an impairment charge of $30.9 million to our results of operations in fiscal 2024 on the aforementioned intangible asset.
For more information, see “— A few major clients account for a significant portion of our revenue and any loss of business from these clients could reduce our revenue and significantly harm our business.”
14
Some of our client contracts contain provisions which, if triggered, could result in lower future revenue and have an adverse effect on our business.
In many of our client contracts, we agree to include certain provisions which provide for downward revision of our prices under certain circumstances. For example, certain contracts allow a client in certain limited circumstances to request a benchmark study comparing our pricing and performance with that of an agreed list of other service providers for comparable services. Based on the results of the study and depending on the reasons for any unfavorable variance, we may be required to make improvements in the service we provide or to reduce the pricing for services to be performed under the remaining term of the contract. Some of our contracts also provide that, during the term of the contract and for a certain period thereafter ranging from six to 12 months, we may not provide similar services to certain or any of their competitors using the same personnel. These restrictions may hamper our ability to compete for and provide services to other clients in the same industry, which may result in lower future revenue and profitability.
Some of our contracts specify that if a change in control of our company occurs during the term of the contract, the client has the right to terminate the contract. These provisions may result in our contracts being terminated if there is such a change in control, resulting in a potential loss of revenue.
Fraud on account of circumvention of controls within our or our clients’ computer systems and processes could adversely impact our business.
Our business is dependent on the secure and reliable operation of controls within our and our clients’ information systems and processes, whether operated or executed by our clients themselves or by us in connection with our provision of services to them. Although we take adequate measures to safeguard against system-related and other fraud, there can be no assurance that we would be able to prevent fraud or even detect them on a timely basis, particularly where it relates to our clients’ information systems which are not managed by us. For example, we have identified incidences where our employees have allegedly exploited weaknesses in information systems as well as processes in order to record fraudulent transactions. Additionally, the physically unsupervised nature of remote-working solutions adopted since the COVID-19 pandemic could potentially expose us to potential instances of fraud. We are generally required to indemnify our clients from third party claims arising out of such fraudulent transactions and our client contracts generally do not include any limitation on our liability to our clients’ losses arising from fraudulent activities by our employees. Our expansion into new markets may create additional challenges with respect to managing the risk of fraud due to the increased geographical dispersion and use of intermediaries. Accordingly, we may have significant liability arising from fraudulent transactions which may materially affect our business and financial results. Although we have professional indemnity insurance coverage for losses arising from fraudulent activities by our employees, that coverage may not continue to be available on reasonable terms or in sufficient amounts to cover one or more large claims against us, and our insurers may also disclaim coverage as to any future claims. We may also suffer reputational harm as a result of fraud committed by our employees, or by our perceived inability to properly manage fraud related risks, which could in turn lead to enhanced regulatory oversight and scrutiny.
15
Our business may not develop in ways that we currently anticipate due to negative public reaction to offshore outsourcing, proposed legislation or otherwise.
We have based our strategy of future growth on certain assumptions regarding our industry, services, and future demand in the market for such services. However, the trend to outsource business processes may not continue and could reverse. In addition, we cannot accurately predict the impact that any potential global pandemic/ epidemic, any related resurgence and other macroeconomic and geo-political developments might have on our clients’ outsourcing demands and efforts, which might be lower in the future, as some of our clients might decide to refrain from offshore outsourcing due to the pressures, they may face from increased unemployment in the regions in which they operate.
The issue of domestic companies outsourcing services to organizations operating in other countries is a topic of political discussion in the United States, as well as in Europe, the Asia Pacific and other regions in which we have clients. Some countries and special interest groups have expressed concerns about a perceived association between offshore outsourcing and the loss of jobs in the domestic economy. It is possible that there could be a change in the existing laws that would restrict or require disclosure of offshore outsourcing or impose new standards that have the effect of restricting the use of certain visas in the foreign outsourcing context. The measures that have been enacted to date are generally directed at restricting the ability of government agencies to outsource work to offshore business service providers. These measures have not had a significant effect on our business because governmental agencies are not a focus of our operations. However, some legislative proposals would, for example, require contact centers to disclose their geographic locations, require notice to individuals whose personal information is disclosed to non-US affiliates or subcontractors, require disclosures of companies’ foreign outsourcing practices, or restrict US private sector companies that have federal government contracts, federal grants or guaranteed loan programs from outsourcing their services to offshore service providers. Potential changes in tax laws may also increase the overall costs of outsourcing or affect the balance of offshore and onshore business services. Such changes could have an adverse impact on the economics of outsourcing for private companies in the US, which could in turn have an adverse impact on our business with US clients.
Such concerns have also led the UK and other EU jurisdictions to enact regulations which allow employees who are dismissed as a result of transfer of services, which may include outsourcing to non-UK or EU companies, to seek compensation either from the company from which they were dismissed or from the company to which the work was transferred. This could discourage EU companies from outsourcing work offshore and/or could result in increased operating costs for us. In addition, there has been publicity about the negative experiences, such as theft and misappropriation of sensitive client data, of various companies that use offshore outsourcing, particularly in India.
Current or prospective clients may elect to perform such services themselves or may be discouraged from transferring these services from onshore to offshore providers to avoid negative perceptions that may be associated with using an offshore provider. Any slowdown or reversal of existing industry trends towards offshore outsourcing would seriously harm our ability to compete effectively with competitors that operate out of facilities located in the UK or the US.
Adverse changes to our relationships with the companies with whom we have an alliance or in the business of the companies with whom we have an alliance could adversely affect our results of operations.
We have alliances with companies whose capabilities complement our own. For example, some of our services and solutions are based on technology, software or platforms provided by these companies. The priorities and objectives of these companies with whom we have an alliance may differ from ours. As most of our alliance relationships are non-exclusive, these companies with whom we have an alliance are not prohibited from competing with us or forming closer or preferred arrangements with our competitors. One or more of these companies with whom we have an alliance may be acquired by a competitor, or may merge with each other, either of which could reduce our access over time to the technology, software or platforms provided by those companies. In addition, these companies with whom we have an alliance could experience reduced demand for their technology, software or platforms, including, for example, in response to changes in technology, which could lessen related demand for our services and solutions. If we do not obtain the expected benefits from our alliance relationships for any reason, we may be less competitive and our ability to offer attractive solutions to our clients may be negatively affected, which could have an adverse effect on our results of operations.
16
If we are unable to collect our receivables from, or bill our unbilled services to, our clients, our results of operations and cash flows could be adversely affected.
Our business depends on our ability to successfully obtain payment from our clients for work performed. We evaluate the financial condition of our clients and usually bill and collect on relatively short cycles. We maintain allowances, using the expected credit loss model, against receivables and unbilled services. Actual losses on client balances could differ from those that we currently anticipate and, as a result, we might need to adjust our allowances. We might not accurately assess the creditworthiness of our clients. Macroeconomic conditions, such as any domestic or global credit crisis, disruption of the global financial system, inflation and rising interest rates, have resulted and may continue to result in financial difficulties for our clients, including, but not limited to, limited access to the credit markets, insolvency or bankruptcy and, as a result, have caused and may continue to cause, clients to delay payments to us, request modifications to their payment arrangements that could increase our receivables balance, or default on their payment obligations to us. Timely collection of client balances also depends on our ability to complete our contractual commitments and bill and collect our contracted revenues. If we are unable to meet our contractual requirements, we might experience delays in collection of and/or be unable to collect our client balances, and if this occurs, our results of operations and cash flows could be adversely affected. In addition, if we experience an increase in the time to bill and collect for our services, our cash flows could be adversely affected.
We may face difficulties as we expand our operations to establish delivery centers in onshore locations and offshore in countries in which we have limited or no prior operating experience.
In fiscal 2022, we added a new facility in Hyderabad, India and in fiscal 2023, we added a new facility each in Indore and Jaipur, India and as part of our acquisition of Vuram Technology Solutions Private Limited and its subsidiaries (“Vuram”), we acquired facilities in Trichy, India, and Ontario, Canada, and started our operations in Kuala Lumpur, Malaysia. We did not have any prior experience of operations in the any of these locations. We intend to continue to expand our global footprint in order to maintain an appropriate cost structure and meet our clients’ delivery needs. We plan to establish additional delivery centers in the Asia Pacific, North and Latin America and Europe, which may involve expanding into countries other than those in which we currently operate. Our expansion plans may also involve expanding into less developed countries, which may have less political, social or economic stability and less developed infrastructure and legal systems. As we expand our business into new countries, we may encounter regulatory, personnel, technological and other difficulties that increase our expenses or delay our ability to start up our operations or become profitable in such countries. This may affect our relationships with our clients and could have an adverse effect on our business, results of operations, financial condition and cash flows.
We may be unable to effectively manage our growth and maintain effective internal controls, which could have a material adverse effect on our operations, results of operations and financial condition.
We were founded in April 1996, and we have experienced growth and significantly expanded our operations. For example, over the last five fiscal years, our employees have increased to 60,125 as at March 31, 2024 from 39,898 as at March 31, 2019 and the number of delivery centers have increased from 59 to 65 centers between fiscal 2019 to fiscal 2024. We have delivery centers across 13 countries in Canada, China, Costa Rica, India, Malaysia, the Philippines, Poland, Romania, South Africa, Sri Lanka, Turkey, the UK, and the US. We intend to further expand our global delivery capability, and we are exploring plans to do so in the Asia Pacific, North America and Europe.
We have also completed numerous acquisitions. In July 2022, we completed the acquisition of Vuram, a hyper automation services company that specializes in low-code enterprise automation and provides custom, scalable BPM solutions including industry-specific solutions for the banking/financial services, insurance, and healthcare verticals. In October 2022, we entered into a business transfer agreement with a large insurance company, under which we acquired certain assets, including a customer contract and operational process manuals, and assumed the employment agreements of the associated work force. In December 2022, we completed the acquisition of The Smart Cube Limited and its subsidiaries (“The Smart Cube”), which provides digitally led market intelligence and analytics solutions in four key areas including procurement and supply chain, commercial sales and marketing, digital and analytics, and strategy and investment research. In the same month, we also completed the acquisition of OptiBuy sp. z o.o. and its subsidiaries (“OptiBuy”), which helps clients leverage the capabilities of leading third-party procurement and supply chain platforms and provides consulting, optimization, outsourcing, and training services and implementation solutions to their clients. For more information about more recent acquisitions, see “— We may not succeed in identifying suitable acquisition targets or integrating any acquired business into our operations, which could have a material adverse effect on our business, results of operations, financial condition and cash flows.”
17
This growth places significant demands on our management and operational resources. In order to manage growth effectively, we must implement and improve operational systems, procedures and internal controls on a timely basis. If we fail to implement these systems, procedures and controls on a timely basis, we may not be able to service our clients’ needs, hire and retain new employees, pursue new business, complete future acquisitions or operate our business effectively. Failure to effectively transfer new client business to our delivery centers, properly budget transfer costs or accurately estimate operational costs associated with new contracts could result in delays in executing client contracts, trigger service level penalties or cause our profit margins not to meet our expectations or our historical profit margins. As a result of any of these potential problems associated with expansion, our business, results of operations, financial condition and cash flows could be materially and adversely affected.
We are subject to various risks relating to human capital management.
We face risks with respect to the management of human capital resources. If not managed properly, these risks could compromise our future success and harm our business. These risks are discussed in detail below.
Our executive and senior management team and other key team members in our business units are critical to our continued success and the loss of such personnel could harm our business.
Our future success substantially depends on the performance of the members of our executive and senior management team and other key team members in each of our business units. These personnel possess technical and business capabilities including domain expertise that are difficult to replace. There is intense competition for experienced senior management and personnel with technical and industry expertise in the BPM industry, and we may not be able to retain our key personnel due to various reasons, including the compensation philosophy followed by our company as described in “Part I — Item 6. Directors, Senior Management and Employees — Compensation” . Although we have entered into employment contracts with our executive officers, certain terms of those agreements may not be enforceable and in any event these agreements do not ensure the continued service of these executive officers. In the event of a loss of any key personnel, there is no assurance that we will be able to find suitable replacements for our key personnel within a reasonable time. The loss of key members of our senior management or other key team members, particularly to competitors, could have a material adverse effect on our business, results of operations, financial condition and cash flows.
We may fail to attract and retain enough sufficiently trained employees to support our operations, as competition for highly skilled personnel is significant and we experience significant employee attrition. These factors could have a material adverse effect on our business, results of operations, financial condition and cash flows.
The BPM industry relies on large numbers of skilled employees, and our success depends to a significant extent on our ability to attract, hire, train and retain qualified employees. The BPM industry, including our company, experiences high employee attrition. As companies, including our company, transition from a “work from home” model to a return to the office, we may face higher levels of attrition if employees are unwilling to return to pre-COVID working schedules. In addition, client mandates that restrict our delivery of services remotely could also adversely affect our ability to attract talents in the future. During fiscal 2024, 2023 and 2022, the attrition rate for our employees who have completed six months of employment with us was 31%, 39% and 36%, respectively. Our attrition rate may increase or fluctuate in the future. There is significant competition in the jurisdictions where our operation centers are located, including India, the Philippines, Romania, South Africa and Sri Lanka, for professionals with the skills necessary to perform the services we offer to our clients. Increased competition for these professionals, in the BPM industry or otherwise, could have an adverse effect on us. A significant increase in the attrition rate among employees with specialized skills could decrease our operating efficiency and productivity and could lead to a decline in demand for our services.
In addition, our ability to maintain and renew existing engagements and obtain new business will depend largely on our ability to attract, train and retain personnel with skills that enable us to keep pace with growing demands for outsourcing, evolving industry standards and changing client preferences. Our failure either to attract, train and retain personnel with the qualifications necessary to fulfill the needs of our existing and future clients or to assimilate new employees successfully could have a material adverse effect on our business, results of operations, financial condition and cash flows.
Our success in attracting talent depends on our ability to foster a culture of diversity, equity and inclusion at our workplace. We are focused on promoting a range of matters to help foster our workplace culture, including diversity, equal opportunities, non-discrimination, inclusion and employee health and safety. We have adopted policies to promote compliance with laws and regulations as well as to foster a respectful workplace for all employees. Any failure in adhering to these policies could harm our reputation and result in negative publicity, thereby negatively affecting our ability to attract and retain talent.
Employee strikes and other labor-related disruptions may adversely affect our operations.
Our business depends on a large number of employees executing client operations. Strikes or labor disputes with our employees at our delivery centers may adversely affect our ability to conduct business. Our employees are not unionized, although they may in the future form unions. We cannot assure you that there will not be any strike, lock out or material labor dispute in the future. Work interruptions or stoppages could have a material adverse effect on our business, results of operations, financial condition and cash flows.
18
Our loan agreements impose operating and financial restrictions on us and our subsidiaries.
We have incurred indebtedness in connection with our acquisitions and general corporate purposes. As at March 31, 2024, we had total indebtedness of $179.2 million in secured bank loans. See “Part I — Item 5. Operating and Financial Review and Prospects — Liquidity and Capital Resources.” Generally, our loan agreements contain a number of covenants and other provisions that, among other things, may impose operating and financial restrictions on us and our subsidiaries. These restrictions could put a strain on our financial position. For example:
• | they may increase our vulnerability to general adverse economic and industry conditions; |
• | they may require us to dedicate a substantial portion of our cash flow from operations to payments on our loans, thereby reducing the availability of our cash flow to fund capital expenditure, working capital and other general corporate purposes; |
• | they may require us to seek lenders’ consent prior to paying dividends on our ordinary shares; |
• | they may limit our ability to incur additional borrowings or raise additional financing through equity or debt instruments; and |
• | they may impose certain financial covenants on us that we may not be able to meet, which may cause the lenders to accelerate the repayment of the remaining loan outstanding. |
Further, the restrictions that may be contained in our loan agreements may limit our ability to plan for or react to market conditions, meet capital needs or make acquisitions or otherwise restrict our activities or business plans. Our ability to comply with the covenants of our loan agreements may be affected by events beyond our control, and any material deviations from our forecasts could require us to seek waivers or amendments of covenants or alternative sources of financing or to reduce expenditures. We cannot assure you that such waivers, amendments or alternative financing could be obtained, or if obtained, would be on terms acceptable to us.
To fund our capital expenditures, service indebtedness and fund other potential liquidity requirements, we will require a significant amount of cash. Our ability to generate cash depends on many factors beyond our control and we may need to access the credit market to meet our liquidity requirements.
Our ability to fund planned capital expenditures and to make payments on outstanding loans will depend on our ability to generate cash in the future. This, to a large extent, is subject to general economic, financial, competitive, legislative, regulatory and other factors that are beyond our control. Furthermore, given the recent global economic slowdown and continued uncertainty over global economic conditions, including on account of the Russia-Ukraine military conflict, there can be no assurance that our business activity will be maintained at our expected level to generate the anticipated cash flows from operations, or that our credit facilities will be available or sufficient. If the current global economic slowdown and uncertainties continue, we may experience a decrease in demand for our services, resulting in our cash flows from operations being lower than anticipated. This may in turn result in our need to obtain financing, which may not be available to us on favorable terms or at all.
If we cannot fund our capital expenditures, service indebtedness or fund our other potential liquidity requirements, we may have to take actions such as seeking additional financing or reducing or delaying capital expenditures, strategic acquisitions and investments. We cannot assure you that any such actions, if necessary, could be undertaken on commercially reasonable terms or at all.
19
Wage increases may prevent us from sustaining our competitive advantage and may reduce our profit margin.
Salaries and related benefits of our operations staff and other employees in countries where we have delivery centers, in particular India, are among our most significant costs. Wage costs in India have historically been significantly lower than wage costs in the US and Europe for comparably skilled professionals, which has been one of our competitive advantages. However, rapid economic growth in India, increased demand for BPM outsourcing to India, increased competition for skilled employees in India, and regulatory developments resulting in wage increases in India, may reduce this competitive advantage. For example, the Code on Wages 2019, Industrial Relations Code 2020, Social Security Code 2020 and Occupational Safety, Health & Working Condition Code 2020 received assent from the President of India on September 28, 2020. However, the rules for these Acts have not yet been published and the effective date from which these changes are applicable is yet to be notified. Accordingly, while we are unable to determine with certainty the financial impact due to these changes, it is possible that our wage costs in India may increase as a result of these changes when they become effective. In addition, if the US dollar or the pound sterling declines in value against the Indian rupee, wages in the US or the UK will further decrease relative to wages in India, which may further reduce our competitive advantage. We may need to increase our levels of employee compensation more rapidly than in the past to remain competitive in attracting the quantity and quality of employees that our business requires. Wage increases may reduce our profit margins and have a material adverse effect on our financial condition and cash flows.
Our operating results may differ from period to period, which may make it difficult for us to prepare accurate internal financial forecasts and respond in a timely manner to offset such period to period fluctuations.
Our operating results may differ significantly from period to period due to factors such as client losses, variations in the volume of business from clients resulting from changes in our clients’ operations, the business decisions of our clients regarding the use of our services, delays or difficulties in expanding our operational facilities and infrastructure, changes to our pricing structure or that of our competitors, inaccurate estimates of resources and time required to complete ongoing projects, currency fluctuations and seasonal changes in the operations of our clients. For example, our clients in the travel and leisure industry experience seasonal changes in their operations in connection with the US summer holiday season, as well as episodic factors such as adverse weather conditions. Transaction volumes have been, and continue to be, impacted by market conditions affecting the travel industry, including natural disasters, outbreak of infectious diseases (such as the COVID-19 pandemic, which led to a significant fall in air travel volumes, especially during fiscal 2021 and fiscal 2022), or other serious public health concerns, military conflict and terrorist attacks. In addition, our contracts do not generally commit our clients to provide us with a specific volume of business.
20
In addition, the long sales cycle for our services, which typically ranges from three to 12 months, and the internal budget and approval processes of our prospective clients make it difficult to predict the timing of new client engagements. Commencement of work and ramping up of volume of work with certain new and existing clients have in the past been slower than we had expected and may in the future be slower than we expect. Revenue is recognized upon actual provision of services and when the criteria for recognition are achieved. Accordingly, the financial benefit of gaining a new client may not be realized immediately due to delays in the implementation of our services. These factors may make it difficult for us to prepare accurate internal financial forecasts or replace anticipated revenue that we do not receive as a result of those delays. Due to the above factors, it is possible that in some future quarters our operating results may be significantly below the expectations of the public market, analysts and investors.
If our pricing structures do not accurately anticipate the cost and complexity of performing our work, our profitability may be negatively affected.
The terms of our client contracts typically range from three to five years. In many of our contracts, we commit to long-term pricing with our clients, and we negotiate pricing terms with our clients utilizing a range of pricing structures and conditions. Depending on the particular contract, these include input-based pricing (such as full-time equivalent-based pricing arrangements), fixed-price arrangements, output-based pricing (such as transaction-based pricing), outcome-based pricing, and contracts with features of all these pricing models. Our pricing is highly dependent on our internal forecasts and predictions about our projects and the marketplace, which are largely based on limited data and could turn out to be inaccurate. If we do not accurately estimate the costs and timing for completing projects, our contracts could prove unprofitable for us or yield lower profit margins than anticipated. Some of our client contracts do not allow us to terminate the contracts except in the case of non-payment by our client. If any contract turns out to be economically non-viable for us, we may still be liable to continue to provide services under the contract.
We intend to continue focusing on increasing our service offerings that are based on non-linear pricing models (such as fixed-price and outcome-based pricing models) that allow us to price our services based on the value we deliver to our clients rather than the headcount deployed to deliver the services to them. Non-linear revenues may be subject to short-term pressure on margins as initiatives in developing the products and services take time to deliver. The risk of entering into non-linear pricing arrangements is that if we fail to properly estimate the appropriate pricing for a project, we may incur lower profits or losses as a result of being unable to execute projects with the amount of labor we expected or at a margin sufficient to recover our initial investments in our solutions. While non-linear pricing models are expected to result in higher revenue productivity per employee and improved margins, they also mean that we continue to bear the risk of cost overruns, wage inflation, fluctuations in currency exchange rates and failure to achieve clients’ business objectives in connection with these projects.
Our profit margin, and therefore our profitability, are largely a function of our asset utilization and the rates we are able to recover for our services. During fiscal 2024, 2023, and 2022, we incurred significant expenditures to increase our number of seats by establishing additional delivery centers or expanding production capacities in our existing delivery centers. If we are not able to maintain the pricing for our services or an appropriate seat utilization rate, without corresponding cost reductions, our profitability will suffer. The rates we are able to recover for our services are affected by a number of factors, including our clients’ perceptions of our ability to add value through our services, competition, introduction of new services or products by us or our competitors, our ability to accurately estimate, attain and sustain revenue from client contracts, margins and cash flows over increasingly longer contract periods and general economic and political conditions. Our profitability is also a function of our ability to control our costs and improve our efficiency. As we increase the number of our employees and execute our strategies for growth, we may not be able to manage the significantly larger and more geographically diverse workforce that may result, which could adversely affect our ability to control our costs or improve our efficiency. Further, because there is no certainty that our business will ramp-up at the rate that we anticipate, we may incur expenses for the increased capacity for a significant period of time without a corresponding growth in our revenue. Commencement of work and ramping up of volume of work with certain new and existing clients have in the past been slower than we had expected and may in the future be slower than we expect. If our revenue does not grow at our expected rate, we may not be able to maintain or improve our profitability. The COVID-19 pandemic led to, and any future resurgence may lead to, increased costs in relation to the implementation of measures to safeguard our employees’ health and safety and client operations, such as enhanced sanitization measures at our office premises, laptop rental costs for employees working remotely, telecommunications costs for mobile broadband devices, additional software licenses and logistics costs for the movement of equipment and we may need to pay higher costs for compensation, rental, accommodation and other fixed costs as a result of disruptions caused by any future resurgence of the virus.
21
We have in the past and may in the future enter into subcontracting arrangements for the delivery of services. For example, in China, in addition to delivering services from our own delivery center, we used to deliver services through a subcontractor’s delivery center. We could face greater risk when pricing our outsourcing contracts, as our outsourcing projects typically entail the coordination of operations and workforces with our subcontractor, and utilizing workforces with different skill sets and competencies. Furthermore, when outsourcing work we assume responsibility for our subcontractors’ performance. Our pricing, cost and profit margin estimates on outsourced work may include anticipated long-term cost savings from transformational and other initiatives that we expect to achieve and sustain over the life of the outsourcing contract. There is a risk that we will underprice our contracts, fail to accurately estimate the costs of performing the work or fail to accurately assess the risks associated with potential contracts. In particular, any increased or unexpected costs, delays or failures to achieve anticipated cost savings, or unexpected risks we encounter in connection with the performance of this work, including those caused by factors outside our control, could make these contracts less or even not profitable , which could have an adverse effect on our profit margin.
We may not succeed in identifying suitable acquisition targets or integrating any acquired business into our operations, which could have a material adverse effect on our business, results of operations, financial condition and cash flows.
Our growth strategy involves gaining new clients and expanding our service offerings, both organically and through strategic acquisitions. It is possible that in the future, we may not succeed in identifying suitable acquisition targets available for sale or investments on reasonable terms, have access to the capital required to finance potential acquisitions or investments, or be able to consummate any acquisition or investments. Future acquisitions or joint ventures may also result in the incurrence of indebtedness or the issuance of additional equity securities, which may present difficulties in financing the acquisition or joint venture on attractive terms. The inability to identify suitable acquisition targets or investments or the inability to complete such transactions may affect our competitiveness and our growth prospects.
Historically, we have expanded some of our service offerings and gained new clients through strategic acquisitions. For example, in December 2022, we completed the acquisition of The Smart Cube, which provides digitally led market intelligence and analytics solutions in four key areas including procurement and supply chain, commercial sales and marketing, digital and analytics, and strategy and investment research. In the same month, we also completed the acquisition of OptiBuy, which helps clients leverage the capabilities of leading third-party procurement and supply chain platforms and also provides consulting, optimization, outsourcing, and training services and implementation solutions to their clients. In October 2022, we entered into a business transfer agreement with a large insurance company, under which we acquired certain assets, including a customer contract and operational process manuals, and the associated work force have joined our company. In July 2022, we completed the acquisition of Vuram, a hyper automation services company that specializes in low-code enterprise automation and provides custom, scalable BPM solutions including industry-specific solutions for the banking/financial services, insurance, and healthcare verticals. The lack of profitability of any of our acquisitions or joint ventures could have a material adverse effect on our operating results.
In addition, our management may not be able to successfully integrate any acquired business into our operations or benefit from any joint ventures that we enter into, and any acquisition we do complete or any joint venture we do enter into may not result in long-term benefits to us. For instance, if we acquire a company, we could experience difficulties in assimilating that company’s personnel, operations, technology and software, or the key personnel of the acquired company may decide not to work for us. There is no assurance that these acquisitions will be profitable for us. Further, we face the risk that the legal regime or regulatory requirements imposed on any business that we acquire may change following our acquisition and such changes may adversely affect our ability to achieve the expected accretive benefits from the acquisition, which could in turn require us to recognize an impairment of goodwill associated with the acquired business. For more information see “—The international nature of our business exposes us to several risks, such as unexpected changes in the regulatory requirements and governmental policy changes of multiple jurisdictions.”
We also face risks arising from acquisitions of businesses reliant upon a small number of key clients. The value of such acquisitions may decline in the event that their key clients decide not to renew their contracts, or decrease their volume of business or the prices paid for services.
Further, we may receive claims or demands by the sellers of the entities acquired by us on the indemnities that we have provided to them for losses or damages arising from any breach of contract by us. Conversely, while we may be able to claim against the sellers on their indemnities to us for breach of contract or breach of the representations and warranties given by the sellers in respect of the entities acquired by us, there can be no assurance that our claims will succeed, or if they do, that we will be able to successfully enforce our claims against the sellers at a reasonable cost. Acquisitions and joint ventures also typically involve a number of other risks, including diversion of management’s attention, legal liabilities and the need to amortize acquired intangible assets, any of which could have a material adverse effect on our business, results of operations, financial condition and cash flows.
22
Goodwill, intangible or other assets that we carry on our balance sheet could give rise to significant impairment charges in the future.
As at March 31, 2024, we had goodwill and intangible assets of $480.7 million, which primarily resulted from our acquisitions of Vuram, The Smart Cube, OptiBuy, business transfers from a large insurance company, as well as our acquisitions of HealthHelp, Denali and Value Edge. Under IFRS, we are required to review our goodwill, intangibles or other assets for impairment when events or changes in circumstances indicate the carrying value may not be recoverable. In addition, goodwill, intangible or other assets with indefinite lives are required to be tested for impairment at least annually. During the fourth quarter of fiscal 2020, Brexit had a negative impact on the insurance industry and applied downward pressure on the expected future performance of the WNS Auto Claims business, due to contract renegotiations and loss of certain clients. These factors, together with the highly uncertain operating environment in the UK, have negatively impacted and caused us to significantly reduce our financial projections and estimates of the WNS Auto Claims business from our previous estimate. Accordingly, we performed an impairment review of the goodwill associated with the companies we had acquired for our auto claims business and recorded an impairment charge of $4.1 million to our results of operations in fiscal 2020 for the remaining goodwill balance of our auto claims business.
For example, one of our top five customers by revenue contribution in fiscal 2024, which was in the HCLS SBU, served a termination notice on January 31, 2024. The termination is effective July 1, 2024. Although the termination did not impact the revenue of fiscal 2024, we were required to perform an impairment assessment for the intangible asset recognized in relation to this client. Based on our assessment, we recorded an impairment charge of $30.9 million to our results of operations in fiscal 2024 on the aforementioned intangible asset.
See also “—The international nature of our business exposes us to several risks, such as unexpected changes in the regulatory requirements and governmental policy changes of multiple jurisdictions.” We may be required to record further impairment charges to our goodwill and intangible assets associated with other acquisitions in the future. For example, if the research and analytics industry experiences a significant decline in business and we determine that we will not be able to achieve the cash flows that we had expected from our recent acquisitions, we may have to record an impairment of all or a portion of the goodwill or intangible assets relating to those acquisitions. Any further impairment to our goodwill or intangible assets may have a significant adverse impact on our results of operations.
We are incorporated in Jersey, Channel Islands under the Companies (Jersey) Law 1991 (the ”1991 Law”). If the tax benefits enjoyed by our company are withdrawn or changed, we may be liable for higher tax, thereby reducing our profitability.
As a company incorporated in Jersey, Channel Islands, we are currently subject to Jersey income tax at a rate of 0%. Although we continue to enjoy the benefits of the Jersey business tax regime, if Jersey tax laws change or the tax benefits we enjoy are otherwise withdrawn or changed, we may become liable for higher tax, thereby reducing our profitability.
If we fail to maintain an effective system of internal control over financial reporting, we may not be able to accurately report our financial results or prevent or detect fraud. As a result, current and potential investors could lose confidence in our financial reporting, which could harm our business and have an adverse effect on the price of our ordinary shares.
Effective internal control over financial reporting is necessary for us to provide reliable financial reports. The effective internal controls together with adequate disclosure controls and procedures are designed to prevent or detect fraud. Deficiencies in our internal controls may adversely affect our management’s ability to record, process, summarize, and report financial data on a timely basis. As a public company, we are required by Section 404 of the Sarbanes-Oxley Act of 2002 to include a report of management’s assessment on our internal control over financial reporting and an independent auditor’s attestation report on our internal control over financial reporting in our annual reports on Form 20-F.
If material weaknesses are identified in our internal controls over financial reporting, we could be required to implement remedial measures. If we fail to maintain effective disclosure controls and procedures or internal control over financial reporting, we could lose investor confidence in the accuracy and completeness of our financial reports, which could have a material adverse effect on the price of our ordinary shares.
23
Risks Related to Key Delivery Locations
A substantial portion of our assets and operations are located in India and we are subject to regulatory, economic, social and political uncertainties in India.
Our primary operating subsidiary, WNS Global Services Private Limited (“WNS Global”), is incorporated in India, and a substantial portion of our assets and employees are located in India. The Government of India, however, has exercised and continues to exercise significant influence over many aspects of the Indian economy. The Government of India has provided significant tax incentives and relaxed certain regulatory restrictions in order to encourage foreign investment in specified sectors of the economy, including the BPM industry. Those programs that have benefited us include tax holidays, liberalized import and export duties and preferential rules on foreign investment and repatriation. We cannot assure you that such liberalization policies will continue. The Government of India may also enact new tax legislation or amend the existing legislation that could impact the way we are taxed in the future. For more information, see “—Tax legislation and the results of actions by taxing authorities may have an adverse effect on our operations and our overall tax rate.” Other legislation passed by the Government of India may also impact our business. For example, the Code on Wages 2019, Industrial Relations Code 2020, Social Security Code 2020 and Occupational Safety, Health & Working Condition Code 2020 received assent from the President of India on September 28, 2020. However, the rules for these Acts have not yet been published and the effective date from which these changes are applicable is yet to be notified. Accordingly, while we are unable to determine with certainty the financial impact due to these changes, it is possible that our wage costs in India may increase as a result of these changes when they become effective. Our financial performance and the market price of our ordinary shares may be adversely affected by changes in inflation, exchange rates and controls, interest rates, Government of India policies (including taxation regulations and policies), social stability or other political, economic or diplomatic developments affecting India in the future.
India has witnessed communal clashes in the past. Although such clashes in India have, in the recent past, been sporadic and have been contained within reasonably short periods of time, any such civil disturbance in the future could result in disruptions in transportation or communication networks, as well as have adverse implications for general economic conditions in India. Such events could have a material adverse effect on our business, the value of our ordinary shares and your investment in our ordinary shares.
Our business in South Africa is evaluated for compliance with the South African government’s Broad-Based Black Economic Empowerment (“BBBEE”) legislation. Failure to maintain a minimum BBBEE rating would result in a loss of certain government grants, and may also result in us losing certain business opportunities or clients imposing contractual penalties on us.
Our business in South Africa is evaluated for compliance with the South African government’s BBBEE legislation against a BBBEE scorecard, which has different levels based on various criteria. South African government grants are available to businesses that meet specified conditions, including achieving a specified minimum BBBEE rating. A level one BBBEE rating has the most rigorous criteria. Additionally, many South African companies require their service providers to maintain a minimum BBBEE rating, and many of our South African client contracts contain clauses that allow our clients to terminate their contracts with us or impose specified penalties on us if we do not maintain a minimum BBBEE rating.
We conduct our domestic business in South Africa (serving clients based in South Africa) through our South Africa subsidiary, WNS South Africa (Pty) Ltd, and our international business in South Africa (serving clients based outside South Africa) through our South Africa subsidiary, WNS Global Services SA (Pty) Limited. During fiscal 2020, pursuant to the requirements of the South African government’s BBBEE Codes of Good Practice, the WNS B-BBEE Staff Share Trust subscribed to one participating preference share issued by WNS Global Services SA (Pty) Ltd, which entitles it to 45.56% of voting rights in WNS South Africa (Pty) Ltd. In fiscal 2022, the voting rights were increased to 48.84% to help ensure WNS South Africa (Pty) Ltd maintains the same level of rating. On April 19, 2024, WNS Global Services SA (Pty) Limited redeemed the one participating preference share on account of unwinding of Scheme B of WNS B-BBEE Staff Share Trust. We are currently working on a new ownership structure to ensure continued compliance with the requirements of the BBBEE legislation.
We achieved a level one rating in respect of WNS South Africa (Pty) Ltd in May 2023, which is valid until May 2024 and achieved a level seven rating in respect of WNS Global Services SA (Pty) Limited in June 2023 which is valid until June 2024. The BBBEE verification audit for WNS Global Services SA (Pty) Ltd is in process and the new rating is expected to be received by the end of May 2024. To help us achieve the requisite BBBEE rating for WNS Global Services SA (Pty) Limited, we have implemented a program that includes divesting some of our interests in such subsidiary to address the requirement relating to the percentage of ownership of an entity by “black people” (as defined under the applicable legislation).
With the achievement of a level seven rating in respect of WNS Global Services SA (Pty) Limited and a level one rating in respect of WNS South Africa (Pty) Ltd, we currently continue to meet the minimum BBBEE rating required under our contracts with South African clients and be eligible for government grants associated with our domestic and international business.
However, there is no assurance that we will maintain our existing BBBEE rating with respect to WNS Global Services SA (Pty) Limited or WNS South Africa (Pty) Ltd in our next or future annual BBBEE verification audits or thereafter. If we fail to maintain or achieve the required minimum BBBEE ratings, we will cease to be eligible for government grants, will be disqualified from bidding for certain business, and certain of our clients may terminate their contracts with us or impose penalties on us. These outcomes would have an adverse effect on our business, results of operations, financial condition and cash flows.
24
Our facilities are at risk of damage by natural disasters.
Our operational facilities and communication hubs may be damaged in natural disasters such as earthquakes, floods, heavy rains, tsunamis and cyclones. For example, Durban, South Africa was affected by severe flooding in April 2022. Although our clients experienced minimal disruptions during the flood due to the business continuity planning and infrastructure resiliency measures we have implemented with a view to minimizing the impact of natural disasters on our business, such measures may be rendered less effective in other circumstances. In addition, we have operational facilities and communication hubs located in regions which are considered to be particularly vulnerable to natural disasters, such as the Philippines and Houston in the United States, which have experienced severe natural disasters such as typhoons, hurricanes and floods. Such natural disasters may lead to disruption to information systems and telephone service for sustained periods, and such natural disasters may become more frequent or intense as a result of climate change. Damage or destruction that interrupts our provision of BPM services could damage our relationships with our clients and may cause us to incur substantial additional expenses to repair or replace damaged equipment or facilities. We may also be liable to our clients for disruption in service resulting from such damage or destruction. While we currently have property damage insurance and business interruption insurance, our insurance coverage may not be sufficient. Furthermore, we may be unable to secure such insurance coverage at premiums acceptable to us in the future or secure such insurance coverage at all. Prolonged disruption of our services as a result of natural disasters would also entitle our clients to terminate their contracts with us.
If the tax benefits and other incentives that we currently enjoy are reduced or withdrawn or not available for any other reason, our financial condition would be negatively affected.
We have benefitted from, and continue to benefit from, certain tax holidays and exemptions in various jurisdictions in which we have operations.
In fiscal 2024, 2023 and 2022, our tax holidays and exemptions in India, the Philippines and Sri Lanka impacted our effective tax rate favorably. By way of illustration, if these tax holidays and exemptions had not been available, we would have incurred approximately $10.3 million, $20.7 million and $20.9 million in additional income tax expense on our combined operations in our Special Economic Zone operations in India, the Philippines and Sri Lanka in fiscal 2024, 2023 and 2022, respectively.
We expect our tax rate in India, the Philippines and Sri Lanka to continue to impact our effective tax rate.
One of our Indian subsidiary with operating units registered under the Special Economic Zone (“SEZ’’) is eligible to claim income tax exemption with respect to profits earned from export revenue. Upon the expiration of this tax exemption, income derived by this subsidiary shall become subject to the prevailing annual tax rate of 34.95%. The Government of India enacted the India Tax Law effective April 1, 2019, which enables Indian companies to elect to be taxed at a lower income tax rate of 25.17% as compared to the current rate of 34.95%. Once a company elects into the lower income tax rate, a company may not benefit from any tax holidays associated with SEZ and certain other tax incentives and may not reverse its election. In the year ended March 2024, this subsidiary has elected to apply the lower income tax rate of 25.17%. We will continue to evaluate the application of the same tax rate for the fiscal 2024 at the time of filing corporate tax return. Our other Indian subsidiaries have elected the lower income tax rate of 25.17%. See “Part I — Item 4. Information on the Company — B. Business Overview — Regulations”.
When any of our tax holidays or exemptions expire or terminate, or if the applicable government withdraws, changes the conditions of or reduces the benefits of a tax holiday or exemption that we enjoy, our tax expense may materially increase and this increase may have a material impact on our results of operations. For example, any changes in the regulations relating to work from home arrangements may impact the tax exemption benefits available to us. The applicable tax authorities may also disallow deductions claimed by us and assess additional taxable income on us in connection with their review of our tax returns.
Tax legislation and the results of actions by taxing authorities may have an adverse effect on our operations and our overall tax rate.
The government of India, the US or other jurisdictions where we have a presence could enact new tax legislation which would have a material adverse effect on our business, results of operations and financial condition. In addition, our ability to repatriate surplus earnings from our delivery centers in a tax-efficient manner is dependent upon interpretations of local laws, possible changes in such laws and the renegotiation of existing double tax avoidance treaties. Changes to any of these may adversely affect our overall tax rate, or the cost of our services to our clients, which would have a material adverse effect on our business, results of operations and financial condition.
The UK government has revised the corporate tax rate from 19% to 25% from fiscal 2024 which has had an impact on the various current and deferred tax items recorded by the Company’s subsidiaries.
Member countries of the Organisation for Economic Co-operation and Development/G20 Inclusive Framework on Base Erosion and Profit Shifting have agreed on a two Pillar approach to address the tax challenges arising from the digitalization of the global economy. This is expected to alter the global tax landscape. Once effective, these changes may have an impact on the various current and deferred tax items recorded by the Company’s subsidiaries.
25
We are subject to transfer pricing and other tax related regulations and any determination that we have failed to comply with them could materially adversely affect our profitability.
Transfer pricing regulations to which we are subject require that any international transaction among our company and its subsidiaries, or the WNS group enterprises, be on arm’s-length terms. We believe that the international transactions among the WNS group enterprises are on arm’s-length terms. If, however, the applicable tax authorities determine that the transactions among the WNS group enterprises do not meet arm’s-length criteria, we may incur increased tax liability, including accrued interest and penalties. This would cause our tax expense to increase, possibly materially, thereby reducing our profitability and cash flows. We have signed an advance pricing agreement with the Government of India providing for the agreement on transfer pricing matters over certain transactions covered thereunder for a period of five years starting from April 2018. We have filed an application with the Government of India for the renewal of the advance pricing agreement on similar terms for another five years starting from April 2023.
We may be required to pay additional taxes in connection with audits by the tax authorities.
From time to time, we receive orders of assessment from Indian tax authorities assessing additional taxable income on us and/or our subsidiaries in connection with their review of our tax returns. We currently have orders of assessment in fiscal 2003 through fiscal 2020 pending before various appellate authorities. These orders assess additional taxable income that could in the aggregate give rise to an estimated ₹343.8 million ($4.1 million based on the exchange rate on March 31, 2024) in additional taxes, including interest of ₹49.1 million ($0.6 million based on the exchange rate on March 31, 2024).
These orders of assessment allege, among others, that the transfer prices we applied to certain of the international transactions between our Indian subsidiaries and our other wholly-owned subsidiaries were not on arm’s-length terms, disallow a tax holiday benefit claimed by us, deny the set-off of brought forward business losses and unabsorbed depreciation and disallow certain expenses claimed as tax deductible by our Indian subsidiaries, as the case may be. As at March 31, 2024 we have provided a tax reserve of ₹774.3 million ($9.3 million based on the exchange rate on March 31, 2024) primarily on account of the Indian tax authorities’ denying the set off of brought forward business losses and unabsorbed depreciation. We have appealed against these orders of assessment before higher appellate authorities. For more details on these assessments, See “Part I — Item 5. Operating and Financial Review and Prospects — Tax Assessment Orders.”
In addition, we currently have orders of assessment pertaining to similar issues that have been decided in our favor by appellate authorities, vacating tax demands of ₹6,907.0 million ($82.8 million based on the exchange rate on March 31, 2024) in additional taxes, including interest of ₹2,457.1 million ($29.5 million based on the exchange rate on March 31, 2024). The income tax authorities have filed or may file appeals against these orders at higher appellate authorities.
In case of disputes, the Indian tax authorities may require us to deposit with them all or a portion of the disputed amounts pending resolution of the matters on appeal. Any amount paid by us as deposits will be refunded to us with interest if we succeed in our appeals. We have deposited ₹904.1 million ($10.8 million based on the exchange rate on March 31, 2024) of the disputed amount with the tax authorities and may be required to deposit the remaining portion of the disputed amount with the tax authorities pending final resolution of the respective matters.
As at March 31, 2024, corporate tax returns for fiscal 2021 and thereafter remain subject to examination by tax authorities in India.
After consultation with our Indian tax advisors and based on the facts of these cases, certain legal opinions from counsel, the nature of the tax authorities’ disallowances and the orders from appellate authorities deciding similar issues in our favor in respect of assessment orders for earlier fiscal years, we believe these orders are unlikely to be sustained at the higher appellate authorities and we intend to dispute the orders of assessment.
In addition, the Company currently has orders of assessment outstanding for various years pertaining to pre-acquisition period of Smart Cube India Private Limited acquired in fiscal 2023, which assess additional taxable income that could in the aggregate give rise to an estimated ₹63.2 million ($0.8 million based on the exchange rate on March 31, 2024) in additional taxes, including interest of ₹31.1million ($0.4 million based on the exchange rate on March 31, 2024). These orders of assessment disallow tax holiday benefit claimed by Smart Cube India Private Limited. Smart Cube India Private Limited has appealed against these orders of assessment before higher appellate authorities.
We have received orders of assessment from the value-added tax (“VAT”), service tax and goods and services tax (“GST”) authorities, demanding payment of ₹244.1 million ($2.9 million based on the exchange rate on March 31, 2024) towards VAT, service tax and GST for the period April 1, 2014 to March 31, 2020. The tax authorities have rejected input tax credit on certain types of input services. Based on consultations with our tax advisors, we believe these orders of assessments will more likely than not be vacated in our favor by the higher appellate authorities and we intend to dispute the order of assessments.
26
In 2016, we also received an assessment order from the Sri Lankan Tax Authority, demanding payment of LKR 25.2 million ($0.1 million based on the exchange rate on March 31, 2024) in connection with the review of our tax return for fiscal year 2012. The assessment order challenges the tax exemption that we have claimed for export business. We have filed an appeal against the assessment order with the Sri Lankan Tax Appeal Commission in this regard. Based on consultations with our tax advisors, we believe this order of assessment will more likely than not be vacated in our favor by the higher appellate authorities and we intend to dispute the order of assessment.
No assurance can be given, however, that we will prevail in our tax disputes. If we do not prevail, payment of additional taxes, interest and penalties may adversely affect our results of operations, financial condition and cash flows. There can also be no assurance that we will not receive similar or additional orders of assessment in the future.
Terrorist attacks, civil unrest and other acts of violence in any of the countries in which we operate or their neighboring countries could adversely affect our operations, resulting in a loss of client confidence and materially adversely affecting our business, results of operations, financial condition and cash flows.
Terrorist attacks and other acts of violence or war in any of the countries in which we operate or their neighboring countries may adversely affect worldwide financial markets and could potentially lead to economic recession, which could adversely affect our business, results of operations, financial condition and cash flows. For example, South Asia has, from time to time, experienced instances of terrorism, civil unrest and hostilities in and among neighboring countries, including Sri Lanka, India and Pakistan. In February 2022, a military conflict arose between Russia and Ukraine, and we have operations in Poland and Romania, which border Ukraine. While the conflict has not presently spread beyond Ukraine, any escalation of the military conflict in the future may directly impact our operations in Poland and Romania. In April 2019, several churches and hotels in Sri Lanka, including premises within one kilometer of one of our delivery centers, were targeted in a series of coordinated terrorist bombings. In previous years, military confrontations between India and Pakistan have occurred in the region of Kashmir and along the India/Pakistan border. There have also been incidents in and near India, such as the bombings of the Taj Mahal Hotel and Oberoi Hotel in Mumbai in 2008, a terrorist attack on the Parliament of India, troop mobilizations along the India/Pakistan border and an aggravated geopolitical situation in the region. Such military activity or terrorist attacks in the future could disrupt our operations or influence the Indian economy by disrupting communications and making travel more difficult. Resulting political tensions could create a greater perception that investments in Indian companies involve a high degree of risk. Such political tensions could similarly create a perception that there is a risk of disruption of services provided by India-based companies, which could have a material adverse effect on the market for our services. Furthermore, if India were to become engaged in armed hostilities, particularly hostilities that were protracted or involved the threat or use of nuclear weapons, we might not be able to continue our operations.
Increasing scrutiny of, and attention to, environmental, social and governance matters may adversely affect our business operations, clients, profitability and may further expose us to reputational risks and legal liability.
Increasingly, in addition to financial results, companies are being judged by performance on a variety of environmental, social and governance (ESG) matters, which can contribute to the long-term sustainability of a company’s performance. Expectations regarding voluntary ESG initiatives and disclosures may result in increased costs (including but not limited to increased costs related to compliance, stakeholder engagement, contracting and insurance), changes in demand for certain products, enhanced compliance or disclosure obligations, or other adverse impacts to our business, financial condition, or results of operations.
While we may at times engage in voluntary initiatives (such as voluntary disclosures, certifications, or goals, among others) to improve the ESG profile of our company or to respond to stakeholder expectations, such initiatives may be costly and may not have the desired effect. Expectations around company’s management of ESG matters continues to evolve rapidly, in many instances due to factors that are out of our control. For example, although WNS has developed a long-term Scope 1 and 2 net zero and interim reduction goal (pending validation by the Science Based Targets Initiative) we may ultimately be unable to complete this or other initiatives or targets, either on the timelines initially announced or at all, due to technological, cost, or other constraints, which may be within or outside of our control. Moreover, actions or statements that we may take based on expectations, assumptions, or third-party information that we currently believe to be reasonable may subsequently be determined to be erroneous or be subject to misinterpretation. Our inability to successfully perform or perceived failures on ESG matters and to meet societal expectations may negatively affect our reputation or relation with the stakeholders (e.g., investors, clients, and employees).
Certain market participants, including major institutional investors and capital providers, use third-party benchmarks, ratings and scores to assess companies’ ESG profiles in making investment or voting decisions. There currently are many third-party providers of ESG benchmarks, ratings and scores, and the number of such providers has increased in recent years. WNS has limited control and limited visibility over what data such providers choose to use, and no control and often no visibility over their various methodologies. As a result, such ratings may be materially inaccurate, incomplete or misleading. Unfavorable ESG ratings could lead to increased negative investor sentiment towards us or our industry, which could negatively impact the price of our ordinary shares as well as our access to and cost of capital. To the extent ESG matters negatively impact our reputation, it may also impede our ability to compete as effectively to attract and retain employees or clients, which may adversely impact our operations. Considering investors’ increasing focus on ESG matters, the fast pace of change of external expectations, and a range of upcoming regulations, there can be no certainty that we will manage such issues successfully, that the ESG standards we currently use to measure our performance against will remain the same, or that we will successfully meet society or investors’ expectations. This and other stakeholder expectations will likely lead to increased costs as well as scrutiny that could heighten all of the risks identified in this risk factor. Additionally, many of our clients and suppliers may be subject to similar expectations, which may augment or create additional risks, including risks that may not be known to us.
27
We are subject to a series of risks related to climate change.
We operate in many regions, countries and communities around the world where our businesses, and the activities of our clients, could be impacted by climate change and broader ESG-related issues. These issues pose both short and long-term risks to us and our clients. Climate change could expose us to financial risk either through its physical (e.g., climate or weather related events or chronic changes) or transition (e.g., changes in market conditions, capital availability, climate policy or in the regulations applicable to our industry or verticals where we operate with respect to climate change risks, etc.) effects. Physical risks may result in more frequent or intense natural disasters or chronic changes to temperature and precipitation patterns, which may result in damage to our building infrastructure and other physical assets, disrupt the continued functioning of infrastructure on which we rely (such as the transportation network and utilities in the countries where we operate), and negatively affect the morale of our employees. For more information, see “— Our facilities are at risk of damage by natural disasters.” Additionally, changes in the availability of natural resources like water in countries where we operate could directly impact our operations and our employees’ livelihood, which could impact our ability to do business and promote business continuity. While we may take various actions to mitigate our business risks associated with climate change, this may require us to incur substantial costs and may not be successful, due to, among other things, the uncertainty associated with the longer-term projections associated with managing climate risks. Increasing physical impacts of climate change, or the increasing frequency of deleterious climatic events, may also result in changes to public or investor sentiment or policymaker priorities, which may accelerate transition risks.
Such regulatory, market and other changes to respond to climate change may require us to incur increased costs or otherwise adversely impact our business, financial condition, or results of operations. In response to increasing awareness in climate change and other related socio-environmental issues, clients increasingly request for our emission performance during the RFP or bidding stage. This could translate into filtering criteria or other parameters in the clients’ process of selecting their service providers. If our performance is not managed in these areas, it may adversely impact our ability to compete and win contracts.
As countries worldwide undertake to lower greenhouse gas emissions, we may be increasingly subject to regulatory requirements, disclosure-related and otherwise. For example, several jurisdictions have adopted, or are considering adopting, greenhouse gas emissions limits or fees (sometimes referred to as “carbon taxes”). Separately, the Commission has proposed a rule that, if finalized, may require us to incur significant costs to assess and disclose on a range of climate-related data and risks. Risks resulting from potential violations or non-compliance with such laws and regulations can impact our profitability through penalties and/or by limiting our ability to operate in certain countries, adversely affect our reputation and brand, and result in increased legal risks, whether through enforcement actions or litigation, whether or not such claims have any merit. All of these risks may also impact our suppliers or clients, which may indirectly impact our business, financial condition, or results of operations.
Restrictions on entry visas may affect our ability to compete for and provide services to clients in the US and the UK, which could have a material adverse effect on future revenue.
The vast majority of our employees are Indian nationals. The ability of some of our executives to work with and meet our European and North American clients and our clients from other countries depends on the ability of our senior managers and employees to obtain the necessary visas and entry permits. In response to previous terrorist attacks and global unrest, US and European immigration authorities have sharply increased the level of scrutiny in granting visas. Immigration laws in those countries may also require us to meet certain other legal requirements as a condition to obtaining or maintaining entry visas. These restrictions have significantly lengthened the time requirements to obtain visas for our personnel, which has in the past resulted, and may continue to result, in delays in the ability of our personnel to meet with our clients. In addition, immigration laws are subject to legislative change and varying standards of application and enforcement due to political forces, economic conditions, spread of infectious diseases or other events, including terrorist attacks. We cannot predict the political or economic events that could affect immigration laws or any restrictive impact those events could have on obtaining or monitoring entry visas for our personnel. If we are unable to obtain the necessary visas for personnel who need to visit our clients’ sites or, if such visas are delayed, we may not be able to provide services to our clients or to continue to provide services on a timely basis, which could have a material adverse effect on our business, results of operations, financial condition and cash flows.
If more stringent labor laws become applicable to us, our profitability may be adversely affected.
India has stringent labor legislation that protects the interests of workers, including legislation that sets forth detailed procedures for dispute resolution and employee removal and legislation that imposes financial obligations on employers upon retrenchment. Though we are exempt from a number of these labor laws at present, there can be no assurance that such laws will not become applicable to the BPM industry in India in the future. In addition, our employees may in the future form unions. If these labor laws become applicable to our workers or if our employees unionize, it may become difficult for us to maintain flexible human resource policies, discharge employees or downsize, and our profitability may be adversely affected.
Most of our delivery centers operate on leasehold property and our inability to renew our leases on commercially acceptable terms or at all may adversely affect our results of operations.
Most of our delivery centers operate on leasehold property. Our leases are subject to renewal and we may be unable to renew such leases on commercially acceptable terms or at all. Our inability to renew our leases, or a renewal of our leases with a rental rate higher than the prevailing rate under the applicable lease prior to expiration, may have an adverse impact on our operations, including disrupting our operations or increasing our cost of operations. In addition, in the event of non-renewal of our leases, we may be unable to locate suitable replacement properties for our delivery centers or we may experience delays in relocation that could lead to a disruption in our operations. Any disruption in our operations could have an adverse effect on our results of operations.
28
Risks Related to our Shares
Substantial future sales of our ordinary shares in the public market could cause the price of our ordinary shares to fall.
Sales by us or our shareholders of a substantial number of our ordinary shares in the public market, or the perception that these sales could occur, could cause the market price of our ordinary shares to decline. These sales, or the perception that these sales could occur, also might make it more difficult for us to sell securities in the future at a time or at a price that we deem appropriate or to pay for acquisitions using our equity securities. As at March 31, 2024, we had 45,684,145 ordinary shares outstanding. In addition, as at March 31, 2024, a total of 3,832,207 ordinary shares are issuable upon the vesting of restricted share units (“RSUs”) outstanding under our 2006 Incentive Award Plan (as amended and restated, the “2006 Incentive Award Plan”) and our 2016 Incentive Award Plan (as amended and restated, the “2016 Incentive Award Plan”). The vast majority of our ordinary shares are freely transferable, except that ordinary shares owned by our affiliates may only be sold in the US if they are registered or qualify for an exemption from registration, including pursuant to Rule 144 under the Securities Act of 1933, as amended (the “Securities Act”). The remaining ordinary shares outstanding may also only be sold in the US if they are registered or qualify for an exemption from registration, including pursuant to Rule 144 under the Securities Act.
The market price for our ordinary shares may be volatile.
The market price for our ordinary shares is likely to be highly volatile and subject to wide fluctuations in response to factors including the following:
• | announcements of technological developments; |
• | regulatory developments in our target markets affecting us, our clients or our competitors; |
• | actual or anticipated fluctuations in our operating results; |
• | changes in financial estimates by securities research analysts; |
• | changes in the economic performance or market valuations of other companies engaged in BPM; |
• | addition or loss of executive officers or key employees; |
• | sales or expected sales of additional shares; |
• | loss of one or more significant clients; and |
• | a change in control, or possible change of control, of our company. |
In addition, securities markets generally and from time to time experience significant price and volume fluctuations that are not related to the operating performance of particular companies. These market fluctuations may also have a material adverse effect on the market price of our ordinary shares .
29
We may not be able to pay any dividends on our ordinary shares.
We have never declared or paid any dividends on our ordinary shares. We cannot give any assurance that we will declare dividends of any amount, at any rate or at all. Because we are a holding company, we rely principally on dividends, if any, paid by our subsidiaries to us to fund our dividend payments, if any, to our shareholders. Any limitation on the ability of our subsidiaries to pay dividends to us could have a material adverse effect on our ability to pay dividends to you.
Any future determination to pay cash dividends will be at the discretion of our Board of Directors and will be dependent upon our results of operations and cash flows, our financial position and capital requirements, general business conditions, legal, tax, regulatory and any contractual restrictions on the payment of dividends and any other factors our Board of Directors deems relevant at the time.
Subject to the provisions of the Companies (Jersey) Law 1991 (the “1991 Law”) and our Articles of Association, we may by ordinary resolution declare annual dividends to be paid to our shareholders according to their respective rights. Any dividends we may declare must not exceed the amount recommended by our Board of Directors. Our Board of Directors may also pay an interim dividend or dividends, including a dividend payable at a fixed rate, if paying an interim dividend or dividends appears to the Board to be justified. We can only declare dividends if our directors who are to authorize the distribution make a prior statement that, having made full enquiry into our affairs and prospects, they have formed the opinion that:
• | immediately following the date on which the distribution is proposed to be made, we will be able to discharge our liabilities as they fall due; and |
• | having regard to our prospects and to the intentions of our directors with respect to the management of our business and to the amount and character of the financial resources that will in their view be available to us, we will be able to continue to carry on business and we will be able to discharge our liabilities as they fall due until the expiry of the period of 12 months immediately following the date on which the distribution is proposed to be made or until we are dissolved under Article 150 of the 1991 Law, whichever first occurs. |
We qualify as a foreign private issuer and, as a result, are not subject to U.S. proxy rules.
As a foreign private issuer, we are not subject to the proxy rules of the Commission, which regulate the form and content of solicitations by US-based issuers of proxies from their shareholders. The form of notice and proxy statement that we have been using does not include all of the information that would be provided under the Commission’s proxy rules.
30
We may be classified as a passive foreign investment company, which could result in adverse US federal income tax consequences to US holders of our ordinary shares.
Based on our financial statements and relevant market and shareholder data, we believe that we should not be treated as a passive foreign investment company for US federal income tax purposes (“PFIC”) with respect to our most recently closed taxable year. However, the application of the PFIC rules is subject to uncertainty in several respects, and we cannot assure you that we will not be a PFIC for any taxable year. A non-US corporation will be a PFIC for any taxable year if either (i) at least 75% of its gross income for such year is passive income or (ii) at least 50% of the value of its assets (based on an average of the quarterly values of the assets) during such year is attributable to assets that produce passive income or are held for the production of passive income. A separate determination must be made after the close of each taxable year as to whether we were a PFIC for that year. Because the value of our assets for purposes of the PFIC test will generally be determined by reference to the market price of our ordinary shares, fluctuations in the market price of the ordinary shares may cause us to become a PFIC. In addition, changes in the composition of our income or assets may cause us to become a PFIC. If we are a PFIC for any taxable year during which a US holder (as defined in “Part I — Item 10. Additional Information — E. Taxation — US Federal Income Taxation”) holds an ordinary share, certain adverse US federal income tax consequences could apply to such US holder.
If a United States person is treated as owning at least 10% of our ordinary shares, such holder may be subject to adverse US federal income tax consequences.
If a United States person is treated as owning (directly, indirectly or constructively) at least 10% of the value or voting power of our ordinary shares , such person may be treated as a “United States shareholder” with respect to each “controlled foreign corporation” in our group (if any). Because our group includes one or more US subsidiaries, certain of our non-US subsidiaries could be treated as controlled foreign corporations regardless of whether we are or are not treated as a controlled foreign corporation (although there is currently a pending legislative proposal to limit the application of these rules). A United States shareholder of a controlled foreign corporation may be required to annually report and include in its US taxable income its pro rata share of “Subpart F income,” “global intangible low-taxed income” and investments in US property by controlled foreign corporations, whether or not we make any distributions. An individual that is a United States shareholder with respect to a controlled foreign corporation generally would not be allowed certain tax deductions or foreign tax credits that would be allowed to a United States shareholder that is a US corporation. A failure to comply with these reporting obligations may subject such holder to significant monetary penalties and may prevent the statute of limitations with respect to such holder’s US federal income tax return for the year for which reporting was due from starting. We cannot provide any assurances that we will assist investors in determining whether any of our non-US subsidiaries are treated as a controlled foreign corporation or whether such investor is treated as a United States shareholder with respect to any of such controlled foreign corporations or furnish to any United States shareholders information that may be necessary to comply with the aforementioned reporting and tax paying obligations. The IRS has provided limited guidance on situations in which investors may rely on publicly available information to comply with their reporting and taxpaying obligations with respect to certain controlled foreign corporations. A United States investor should consult its own advisors regarding the potential application of these rules to its investment in our ordinary shares.
31
Our share repurchase programs could affect the price of our ordinary shares.
In fiscal 2024, our shareholders authorized a new share repurchase program for the repurchase of up to 3,300,000 of our ADSs, each representing one ordinary share, at a price range of $10 to $180 per ADS. Pursuant to the terms of the repurchase program, our ADSs may be purchased in the open market from time to time for 42 months from October 1, 2023 to March 31, 2027. We are not obligated under the repurchase program to repurchase a specific number of ADSs, and the repurchase program may be suspended at any time at our discretion. We may fund the repurchases with internal or external sources. As at March 27, 24, we had repurchased 2,200,000 ADSs in the open market under this repurchase program, which were held as treasury shares. We cancelled such treasury shares. In March 2024, we terminated our ADS facility and exchanged outstanding ADSs for ordinary shares. Due to this termination, the remaining 1.1 million ADSs yet to be repurchased under the above share repurchase program have become unavailable for repurchase until we obtain an approval from our shareholders for repurchasing of an equivalent amount of ordinary shares. We will hold an extraordinary general meeting on May 30, 2024, at which shareholders will be requested to authorize the purchase of the remaining 1.1 million ordinary shares.
Any repurchases pursuant to our repurchase programs could affect the price of our ordinary shares and increase its volatility. The existence of a repurchase program could also cause the price of our ordinary shares to be higher than it would be in the absence of such a program and could potentially reduce the market liquidity of our ordinary shares. There can be no assurance that any repurchases will enhance shareholder value because the market price of our ordinary shares may decline below the levels at which we repurchase any ordinary shares. In addition, although our repurchase programs are intended to enhance long-term shareholder value, short-term price fluctuations in our ordinary shares could reduce the program’s effectiveness. Significant changes in the price of our ordinary shares and our ability to fund our repurchase programs with cash on hand could impact our ability to repurchase ordinary shares. The timing and amount of future repurchases is dependent on our cash flows from operations, available cash on hand and the market price of our ordinary shares. Furthermore, our programs do not obligate us to repurchase any dollar amount or number of ordinary shares and may be suspended at any time at our discretion, and any suspension or discontinuation could cause the market price of our ordinary shares to decline.
We have certain anti-takeover provisions in our Articles of Association that may discourage a change in control.
Our Articles of Association contain anti-takeover provisions that could make it more difficult for a third party to acquire us without the consent of our Board of Directors. These provisions include:
• | a classified Board of Directors with staggered three-year terms; and |
• | the ability of our Board of Directors to determine the rights, preferences and privileges of our preferred shares and to issue the preferred shares without shareholder approval, which could be exercised by our Board of Directors to increase the number of outstanding shares and prevent or delay a takeover attempt. |
These provisions could make it more difficult for a third party to acquire us, even if the third party’s offer may be considered beneficial by many shareholders. As a result, shareholders may be limited in their ability to obtain a premium for their shares.
It may be difficult for you to effect service of process and enforce legal judgments against us or our affiliates.
We are incorporated in Jersey, Channel Islands, and our primary operating subsidiary, WNS Global, is incorporated in India. A majority of our directors and senior executives are not residents of the US and the majority of our assets and the assets of those persons are located outside the US. As a result, you may have difficulties in effecting service of process within the US upon those persons or us. In addition, you may be unable to enforce judgments obtained in courts of the US against those persons outside the jurisdiction of their residence, including judgments predicated solely upon the securities laws of the US. Furthermore, shareholders of Jersey companies may not have standing to initiate a shareholders derivative action in courts of the US.
Delays or failure to complete our transition to reporting on US domestic issuer forms and filing financial statements under US GAAP may affect expected benefits.
On January 18, 2024, we announced that we were granted board approval to shift from reporting on the forms available to foreign private issuers and filing our financial statements with the SEC under IFRS to voluntarily reporting on US domestic issuer forms and filing our financial statements under US GAAP. We intend to complete this change prior to the end of our fiscal quarter ended September 30, 2024. We believe this transition is in the long-term interest of our stakeholders and will improve our ability to compete for capital, reduce share price volatility and enhance governance. However, we cannot assure you that this transition to reporting on US domestic issuer forms and filing financial statements under US GAAP will be completed within the anticipated timeframe or at all. Unforeseen difficulties or delays could arise, in which case our ability to realize the expected benefits from these actions could be affected. Furthermore, even if these actions are completed, there is no guarantee that they will yield the expected benefits.
32
ITEM 4. INFORMATION ON THE COMPANY
A. | History and Development of our Company |
WNS (Holdings) Limited was incorporated as a private liability company on February 18, 2002 under the laws of Jersey, Channel Islands, and maintains a registered office in Jersey at 22 Grenville Street, St Helier, Jersey JE4 8PX, Channel Islands. We converted from a private limited company to a public limited company on January 4, 2006 in accordance with Article 17A of the 1991 Law, when we acquired more than 30 shareholders as calculated in accordance with Article 17A of the 1991 Law. We gave notice of this to the Jersey Financial Services Commission (“JFSC”) in accordance with Article 17(3) of the 1991 Law on January 12, 2006. Our principal executive offices are located at Gate 4, Godrej & Boyce Complex, Pirojshanagar, Vikhroli (W), Mumbai 400 079, India, telephone number: (+91-22-6826-2100); Malta House, 36-38 Piccadilly, London W1J 0DP; and 515 Madison Avenue, 8th Floor, New York, NY 10022. Our website address is www.wns.com. Information contained on our website does not constitute part of this annual report. Our agent for service in the US is our subsidiary, WNS North America Inc., 515 Madison Avenue, 8th Floor, New York, NY 10022. The SEC maintains an internet site that contains reports, proxy and information statements, and other information regarding issuers that file electronically with the SEC and the address of that site is http://www.sec.gov.
We began operations as an in-house unit of British Airways in 1996 and became a business process outsourcing service provider for third parties in fiscal 2003. Warburg Pincus acquired a controlling stake in our company from British Airways in May 2002 and inducted a new senior management team.
Fiscal 2003 — 2008
We made a number of acquisitions that helped expand our service offerings. These acquisitions included:
• | Town and Country Assistance Limited (which we subsequently rebranded as WNS Assistance and which is part of WNS Auto Claims BPM), a UK-based automobile claims handling company, in fiscal 2003; |
• | the health claims management business of Greensnow Inc. in fiscal 2004; |
• | Trinity Partners Inc. (which we subsequently merged into our subsidiary, WNS North America Inc.), a provider of BPM services to financial institutions, focusing on mortgage banking, in fiscal 2006; |
• | The fare audit services business of PRG Airlines Services Limited and the financial accounting business of GHS Holdings LLC in fiscal 2007; |
• | Marketics, a provider of offshore analytics services, in fiscal 2008; and |
• | Flovate (which we subsequently renamed as WNS Workflow Technologies Limited), a company engaged in the development and maintenance of software products and solutions, in fiscal 2008. |
In July 2006, we completed our initial public offering, whereupon our ADSs became listed on the New York Stock Exchange (the “NYSE”) under the symbol “WNS.”
We invested in our infrastructure to expand our service portfolio from data-oriented processing to include complex voice and blended data/voice service capabilities, and commenced offering comprehensive processes in the travel and leisure, banking and financial services and insurance industries.
We opened facilities in a number of locations, including Gurgaon, India; Colombo, Sri Lanka; and Bucharest, Romania, thereby expanding our operating footprint across India, Sri Lanka and Romania. We also expanded our facilities in Gurgaon, Mumbai and Pune, India. In fiscal 2008, we transferred our delivery center in Sri Lanka to Aviva Global pursuant to “build-operate-transfer” contractual arrangement we had with Aviva.
We entered into a joint venture with ACS, a provider in BPM services and customer care in the Philippines, to form WNS Philippines Inc. (which became our wholly owned subsidiary following our acquisition of ACS’s shareholding in WNS Philippines Inc, in fiscal 2012)
Fiscal 2009 — Fiscal 2013
We acquired a number of companies, including:
• | Chang Limited, an auto insurance claims processing services provider in the UK, in fiscal 2009; |
• | BizAps, a provider of SAP® solutions, in fiscal 2008 to optimize the enterprise resource planning functionality for our finance and accounting processes; |
33
• | Fusion Outsourcing Services (Proprietary) Limited (“Fusion”) (which we subsequently renamed as WNS Global Services SA (Pty) Ltd), a provider of a range of management services, including contact center, customer care and business continuity services, to both South African and international clients, in fiscal 2013. |
We opened facilities in Manila, the Philippines; San Jose, Costa Rica; Vizag, India; and Gydnia, Poland; and also expanded various facilities in India, the Philippines, Costa Rica and Romania, as well as our sales office in the UK.
In February 2012, we issued new ordinary shares in the form of ADSs in a follow-on offering, at a price of $9.25 per ADS, aggregating approximately $50.0 million, to fund our growth initiatives and enhance delivery capability. At the same time, Warburg Pincus divested 6,847,500 ordinary shares in the form of ADSs. In February 2013, Warburg Pincus sold its remaining 14,519,144 ordinary shares in the form of ADSs, thereby divesting its entire stake in our company.
Fiscal 2014 — 2018
We acquired the following companies in fiscal 2017:
• | Value Edge Research Services Private Limited (“Value Edge”), a leading provider of commercial research and analytics services to clients in the pharmaceutical and biopharmaceutical industries; |
• | Denali Sourcing Services Inc. (“Denali”), a leading provider of strategic procurement BPM services; and |
• | MTS HealthHelp Inc. and its subsidiaries (“HealthHelp”), an industry leader in BPM care management. |
Fiscal 2019 — present
• | We added new facilities in Manila and Iloilo, the Philippines; Madrid, Spain; Vizag and Pune, India; and New South Wales, Australia. We also expanded our facilities in Bangalore, Gurgaon, Nashik and Pune, India; |
• | We made the following acquisitions in fiscal 2022: |
• | MOL Information Processing Services (I) Private Limited (which we subsequently renamed as WNS Information Services (India) Private Limited and which has been amalgamated with WNS Global Services Private Limited); and |
• | Business of CEPROCS S.R.L. (“CEPROCS”), a provider of global sourcing and procurement services, pursuant to which we also acquired its customer contract, skilled workforce and related assets. |
• | We acquired the following companies in fiscal 2023: |
• | Vuram, a hyper automation services company that specializes in low-code enterprise automation and provides custom, scalable BPM solutions including industry-specific solutions for the banking/financial services, insurance, and healthcare verticals; |
• | The Smart Cube, which provides digitally led market intelligence and analytics solutions in four key areas including procurement and supply chain, commercial sales and marketing, digital and analytics, and strategy and investment research; and |
• | OptiBuy, which helps clients leverage the capabilities of leading third-party procurement and supply chain platforms and provides consulting, optimization, outsourcing, and training services and implementation solutions to their clients. |
• | In fiscal 2023, we entered into a business transfer agreement with a large insurance company to acquire the contract and capabilities in the form of licensed resources including underlying operational process manuals. |
• | We terminated our ADS facility and exchanged outstanding ADSs for ordinary shares in March 2024. Following the termination of our ADS facility, our ordinary shares began trading on the NYSE under the symbol “WNS.” |
34
In April 2017, we established the WNS B-BBEE Staff Share Trust with the principal objective of creating meaningful participation of the Black employees (as defined in the applicable legislation) of our South African subsidiaries in the growth of the company. We are committed to transformation in South Africa and are implementing this structure to benefit Black People in accordance with the objectives and requirements of the Codes of Good Practice on Black Economic Empowerment as promulgated by section 9(1) of the Broad-Based Black Economic Empowerment Act No. 53 of 2003 of South Africa. Denali Sourcing Services, Inc. and WNS Global Service Inc. were each converted into a limited liability company i,e. Denali Sourcing Services LLC and WNS Global Service LLC respectively with effect from April 1, 2023. WNS GLOBAL SERVICES LISBON, UNIPESSOAL LDA was dissolved on November 29, 2023 and deregistered from the company registry on December 12, 2023. On February 12, 2024, we incorporated a branch of WNS BPM Americas LLC in Philippines. With effect from April 7, 2024, Smart Cube Consulting Service (Dalian) Co., Ltd ceased to exist upon cancellation of its business license. Our organizational structure now comprises 57 entities in 27 countries, and 12 branches in Poland, UAE, China, Singapore, France, Romania, Turkey, Ireland, Spain and Philippines. Of these 57 entities, WNS Cares Foundation, which is a wholly-owned subsidiary of WNS Global, is a not-for-profit organization registered under the Section 8 of the Indian Companies Act, 2013, India. The WNS Cares Foundation was formed for the purpose of promoting corporate social responsibilities and does not qualify as a subsidiary under IFRS 10 — Consolidated Financial Statements and hence is not considered for the purpose of preparing our consolidated financial statements.
We have our principal executive offices in Mumbai, India, London, the UK and New York the US, and we have client service offices in Sydney (Australia), Canada, Dubai (United Arab Emirates), Germany, London (UK), New York (US), Mexico, and Switzerland, and we have delivery centers in Saint John (Canada), Dalian, Guangzhou and Shanghai (China), San Jose (Costa Rica), Bangalore, Chennai, Gurgaon, Hyderabad, Indore, Jaipur, Mumbai, Nashik, Noida, Pune, Trichy, Vizag (India), Kuala Lumpur (Malaysia), Alabang, Iloilo and Manila (Philippines), Katowice, Kielce, Tri-city Gdynia, and Warszawa (Poland), Bucharest, Sibiu and Timisoara (Romania), Cape Town, Claremont, Johannesburg and Durban (South Africa), Colombo (Sri Lanka), Istanbul (Turkey), Ipswich and Manchester (the UK), and, Columbia, South Carolina, Houston, Pittsburgh and Tampa (the US).
Our capital expenditures in fiscal 2024, 2023 and 2022 amounted to $54.3 million, $45.0 million and $28.3 million, respectively. Our principal capital expenditures were incurred for the purposes of setting up new delivery centers, expanding existing delivery centers and developing new technology-enabled solutions to enable execution and management of clients’ business processes. We estimate that our expected capital expenditure in fiscal 2025 would be up to $65.0 million. The geographical distribution, timing and volume of our capital expenditures in the future will depend on new client contracts we may enter into or the expansion of our business under our existing client contracts.
As at March 31, 2024, we had commitments for capital expenditures of $8.0 million (net of advances to capital vendors) relating to the purchase of property and equipment for our delivery centers. Of this committed amount, we plan to spend approximately $3.0 million in India, approximately $1.4 million in Philippines, approximately $1.9 million in South Africa, approximately $ 1.7 million in the rest of the world. We expect to fund these estimated capital expenditures from cash generated from operating activities, existing cash and cash equivalents and the use of existing credit facilities. See “Part I — Item 5. Operating and Financial Review and Prospects — Liquidity and Capital Resources” for more information.
35
B. Business Overview
We are a global BPM company, offering an array of end-to-end industry-specific and cross-industry solutions. We combine our deep industry knowledge with technology, analytics and process expertise to co-create innovative, digitally enabled transformational solutions for our clients. As of March 31, 2024, we had 690 clients across various industries with each client generating more than $0.01 million in revenue in fiscal 2024. Our solutions and capabilities encompass intelligent automation (including robotic process automation (“RPA”), hyperautomation, artificial intelligence (“AI”) and cognitive computing), Generative AI (“Gen AI”), natural language processing and machine learning (“ML”), blockchain, Internet of Things (“IoT”), business process-as-a-service (“BPaaS”) platforms, embedded analytics and process re-engineering frameworks. Hyperautomation refers to an approach that organizations adopt to accelerate digital transformation and rapidly automate business processes. It involves the orchestrated use of technologies such as AI, RPA, ML and natural language processing.
A key element in all our transformation engagements is our ability to deliver business value through the co-creation of solutions and products with our clients and strategic partners. We seek to help our clients “transform” their businesses by identifying business and process optimization opportunities through technology-enabled solutions, improvements to their processes, global delivery capabilities, analytics and domain-led understanding of their business. This, combined with our client-centric approach, enables us to align our people, processes, technologies and delivery network with our clients’ business requirements. Our industry-aligned approach helps us provide a specialized focus on each of the sectors that we target, effectively transform and manage our clients’ business processes, and offer customized solutions and business insights designed to improve their competitive positioning. Our cross-industry solutions, common across multiple industries, include finance and accounting (including procurement), customer experience services, research and analytics (which we have branded as “WNS Triange”), consulting and transformation, human resources, technology and automation, and governance, risk and compliance services.
Effective April 1, 2023, we have restructured our major industry verticals into four strategic business units (“SBUs”), each with a dedicated Chief Business Officer (“CBO”) and digital leaders to enable them to build and deliver domain-led competencies. These SBUs comprise:
• | Travel and Leisure, Shipping and Logistics and Utilities (“TSLU”); |
• | Diversified Businesses (including manufacturing, retail and consumer packaged goods (“CPG”), media and entertainment, and telecommunication (telecom)), Hi-tech and Professional Services, and Procurement (“MRHP”); |
• | Healthcare and Life Sciences (“HCLS”); and |
• | Banking and Financial Services, Insurance (“BFSI”). |
We measure our execution of clients’ business processes against multiple performance parameters, and aim to consistently meet and exceed these parameters to maintain and expand our client relationships. We strive to build long-term client relationships, and typically sign multi-year contracts with our clients that provide us with recurring revenue. In fiscal 2024, 193 and 189 clients contributed more than $1 million to our revenue and revenue less repair payments (non-GAAP), respectively.
As at March 31, 2024, we had 60,125 employees executing business processes for our 690 clients (with each client generating more than $0.01 million in revenue in fiscal 2024).
In fiscal 2024, our revenue was $1,323.4 million, our revenue less repair payments (non-GAAP) was $1,284.3 million and our profit was $140.1 million. Our revenue less repair payments is a non-GAAP financial measure. For a discussion of our revenue less repair payments (non-GAAP) and a reconciliation of our revenue less repair payments (non-GAAP) to revenue, see “Part I — Item 5. Operating and Financial Review and Prospects — Overview.”
36
Industry Overview
The global BPM market continues to evolve in response to a disruptive business landscape as companies navigate a volatile macroeconomic environment, industry-specific business challenges, climate change and geopolitical factors. In addition, the actual and potential impacts of advanced technologies including AI and Gen AI present both risks and opportunities in terms of innovation, efficiency, transformation, and competitive positioning. While companies still look to benefit from process efficiency, cost advantage and labor arbitrage from their BPM solution providers, the continually evolving marketplace has resulted in a broader and more strategic narrative on outsourcing, with a strong focus on domain-led, technology-enabled, and innovative value creation. Customer experience, data-led insights and digital innovation are integral to business success, and enterprises expect their BPM solution providers to play a bigger and more profound role in driving transformational outcomes. We continue to increasingly see BPM solution providers leverage the power of data, advanced analytics and AI to drive intelligent transformation, operational agility, scalability and sustainability for enterprises. As companies outsource more of their complex and high-end business processes, a key consideration for them is the ability of the BPM provider to understand their unique industry and client-specific requirements, design and develop transformational plans, execute intricate, multi-layered process transitions, design a robust business continuity plan and successfully manage these processes on an ongoing basis. The increasing focus on variable cost structures and the delivery of tangible business benefits have resulted in alternative service delivery and pricing models such as transaction-based, outcome-based and subscription models.
While BPM companies continue to address business disruptions caused by digital and technological changes and evolving customer expectations, they have also placed strong focus on cybersecurity, data privacy, and business continuity. Clients now expect BPM service providers to co-architect new, resilient and flexible solutions and models that enable business safety and continuity during a wide array of adverse situations.
BPM companies are required to leverage a diversified geographical footprint and deliver continuity solutions that enable clients to maximize operational agility, scalability and sustainability. These solutions increasingly deploy technology and automation, and leverage the potential for increased adoption of “work-from-home” models.
We expect that going forward, clients will continue to strengthen their focus on reducing costs, accelerating business transformation and digital adoption, leveraging data and analytics, and adopting outcome-based pricing models. We expect that BPM providers will play a key role in helping clients across industries to create and digitize end-to-end processes. It is important for BPM companies to leverage their geographical footprint and implement robust practices that help businesses achieve maximum operational agility, scalability and sustainability. Innovative digital ways of working and extensive adoption of hybrid working models are increasingly prevalent for BPM solutions.
In such an environment, businesses are thus undertaking a rigorous and multi-faceted evaluation process when selecting a BPM provider. Based on our experience, a client typically seeks the following key attributes in a BPM provider:
• | Domain knowledge and industry-specific expertise |
• | Process expertise across horizontal service offerings |
• | “Skin in the game” approach denoting the ability to work as a true partner, absorb risks and prioritize outcomes |
• | Ability to invest in infrastructure and talent to innovate, automate, transform, provide operational expertise and drive best practices based on internal and external benchmarking |
• | Proven ability to execute a diverse range of mission-critical and often complex business processes |
• | Ability to tie service delivery, technology implementation and process automation with the client’s existing information technology (“IT”) infrastructure, negating the need for large IT overhauls |
• | Capabilities to drive improved process standardization across business units and multiple locations, demonstrating strong global delivery capabilities |
• | Comprehensive analytical capabilities to deliver actionable business insights; domain-led analytics solutions customized to industry requirements and embedded as part of the larger BPM services portfolio |
• | Ability to deliver technology-enabled services and solutions, including RPA, cognitive computing, intelligent automation, AI, Gen AI, natural language processing, IoT, industrial robotics, blockchain, cloud-based offerings and platform-based BPM |
• | Agility to build robust operational models that will swiftly and comprehensively manage disruptions and drive maximum business continuity, underpinned by an extensive geographical footprint, a seamless transition methodology, digital ways of working and a strong remote work model |
• | Strong global presence through a mix of offshore, nearshore and onshore delivery centers to access talent and capabilities, create cultural alignment, leverage language skills, and mitigate risks |
37
• | Capability to scale employees and infrastructure without a diminution in quality of service |
• | Ability to raise client’s competitive positioning by improving operating efficiency, reducing cost, enhancing the end-client experience, delivering actionable insights, and creating differentiation |
• | End-to-end solutions, which encompass “design”, “build”, and “run” |
The global BPM industry is a large and growing industry. According to the Gartner Forecast: IT Services, Worldwide, 2022-2028, 1Q24 Update, the worldwide Business Process Services (“BPS”) market comprising traditional and digital components is estimated to be at $208 billion in the year ending 2023. Gartner has estimated that the revenues for the worldwide BPS market will grow from $208 billion in 2023 to $330.46 billion in 2028 at a compounded annual growth rate of 9.7% (compounded annual growth rate calculated by Gartner).
The following chart sets forth the estimated growth in revenue generated in the Worldwide BPS market:
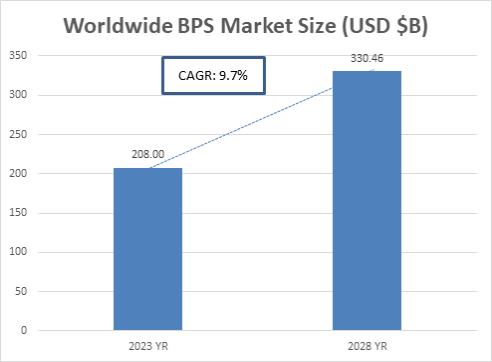
Chart / Graph created by WNS Global Services based on Gartner research.
Source: Gartner, Inc., Forecast: IT Services, Worldwide, 2022-2028, 1Q24 Update. Srujan Akurathi, Colleen Graham, Misako Sawai, Grigory Betskov, Neha Sethi, Fabio Di Capua, et al., March 22, 2024.
The Gartner content described herein (the “Gartner Content”) represent(s) research opinion or viewpoints published, as part of a syndicated subscription service, by Gartner, Inc. (“Gartner”), and are not representations of fact. Gartner Content speaks as of its original publication date (and not as of the date of this annual report), and the opinions expressed in the Gartner Content are subject to change without notice.
The industry trends continue to drive BPM providers to be more innovative, strategic and forward-looking in their approach. Against the backdrop of this changing environment, we believe that WNS, with our focused domain, digital, and data-to-insights capabilities, guiding principles of co-creation and client centricity, extensive global footprint, robust business continuity planning methodologies, and transformational and re-engineering frameworks, is well positioned to deliver business value to our clients. We offer hyperautomation and technology-enabled BPaaS solutions that are designed help companies adapt rapidly to changing business scenarios and accelerate their business transformation. Further, we offer customized engagement models that cater to each client’s scale and transformation journey. In addition to traditional pricing models based on headcount (often referred to as full-time equivalents (FTE)), we offer transaction-based, subscription-based and outcome-based pricing models to provide clients with cost flexibility and measurable business benefits.
In fiscal 2024, 28.8% of our total revenues were generated from “non-FTE” models. These “non-linear” pricing models, which de-link the relationship between headcount and revenue for BPM providers, create an incentive for the providers to improve the productivity of their employees, increase the use of technology, and enhance the overall efficiency of their operations.
38
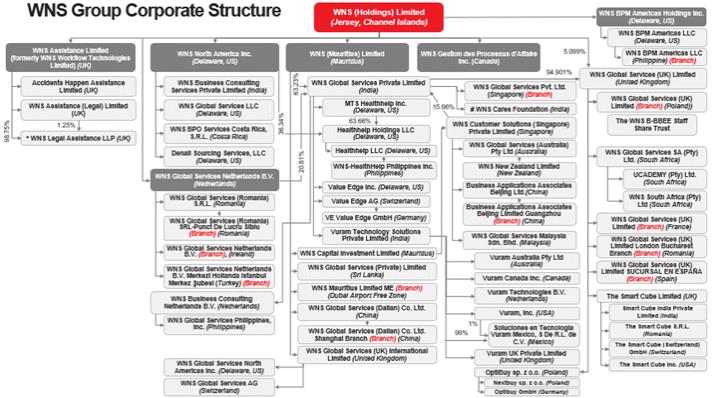
Competitive Strengths
We believe that we have the competitive strengths necessary to maintain and enhance our position as a leading global provider of BPM services.
Well-positioned for the evolving BPM market
The BPM industry, which started with the first wave of simple, labor-based outsourced processes, has now expanded to include complex business processes and higher-value services that involve consulting, process re-engineering, business and digital transformation, management of mission-critical operations, and generation of business insights to aid decision-making. We believe that our industry-specific expertise, end-to-end service offerings, digital-led transformation capabilities, technology-enabled solutions, process management skills, advanced analytics, global delivery network and customer-centric approach position us at the forefront of the evolving BPM market.
To meet the needs of a rapidly evolving and growing BPM market, we continue to develop new innovation-driven and outcome-led capabilities across domain, digital, data and analytics, customer experience, hyperautomation and new technologies. We believe that our scalable digital accelerators, products and prototypes form the foundation of our ability to provide leading-edge industry solutions and collaborate with global organizations through the course of their transformation journeys.
For instance, our WNS Co-creation Labs, currently in New York, London and Pune (India), have been designed to provide clients with an environment conducive to ideating, prototyping and testing innovations before they are taken to the market. Equipped with state-of-the-art virtual capabilities and on-site immersive spaces, our WNS Co-creation Labs seek to enable businesses to solve crucial challenges, seize new opportunities and preempt risks, and leverage new technologies including AI and Gen AI while employing agile design principles at every step. The labs have been designed to foster real-time collaboration and deliver solutions that are customized to the markets, strategies and competitive challenges of our clients.
Deep industry expertise
We have established deep expertise in the industries we target as a result of our vertical organizational structure, legacy client relationships, proprietary technology offerings, strategic acquisitions, targeted training programs and the hiring of management with specific industry knowledge. Our deep domain expertise in each of the 12 industries we serve helps us develop keen insights and transform them into leading-edge impactful business solutions with the help of technology, analytics and process rigor. We have developed methodologies, frameworks, proprietary knowledge and industry-specific technology platforms applicable to our target industries that allow us to provide industry-focused solutions and help clients compete within these industries.
We have structured our company into business units aligned with each of the industries on which we focus. This gives us strong advantages of in-depth industry knowledge and industry-specific technology platforms and solutions, which in turn enable us to approach clients in each of our target industries with an integrated effort covering sales, marketing and delivery. Effective April 1, 2023, we have adopted a new organizational structure featuring four SBUs, each headed by a CBO. Under the new structure, we have organized our company’s existing verticals into the four SBUs. We believe the new organizational structure will help drive improved outcomes for our global clients and enable our company to better drive business synergies, enhance scalability, generate operating leverage, and create organizational depth. These SBUs develop client-specific solutions, build capabilities and maintain a unified go-to-market approach and are integrally responsible for service delivery, customer satisfaction, growth and profitability.
39
We have received numerous recognitions for our industry leadership. Our awards and recognitions in fiscal 2024 and 2023 are set forth below:
Vertical-specific Recognitions
Travel and Leisure:
• | A ‘Horizons 3 — Market Leaders’ in HFS Horizons: Travel, Hospitality, and Logistics Service Providers, 2023 |
Retail and CPG:
• | A ‘Horizon 2 — Enterprise Innovator’ in HFS Horizon: CPG Retail Industry, 2023 |
Hi-tech and Professional Services:
• | A ‘Horizon 2 — Enterprise Innovator’ in HFS Horizon: Services for the Platform Economy, 2023 |
Healthcare and Life Sciences:
• | A ‘Leader’ in NelsonHall’s NEAT for Healthcare Payer Operations Transformation 2023 |
• | A ‘Major Contender’ in Everest Group‘s Revenue Cycle Management (RCM) Operations PEAK Matrix® Assessment 2023 |
• | A ‘Major Contender’ in Everest Group‘s Life Sciences Sales and Marketing Operations – Services PEAK Matrix® Assessment 2023 |
• | A ‘Major Contender’ in Everest Group‘s Healthcare Payer Operations PEAK Matrix® Assessment 2023 |
• | A ‘Major Contender’ in Everest Group‘s Clinical and Care Management Operations – Services PEAK Matrix® Assessment 2023 |
• | A ‘Major Contender’ in Everest Group‘s Life Sciences Operations – Services PEAK Matrix® Assessment 2023 |
• | An ‘Aspirant’ in Everest MedTech Operations PEAK Matrix Assessment 2023 |
• | A ‘Horizon 1 — Disruptor’ in HFS Horizon: Life Science Service Providers, 2023 |
Banking and Financial Services:
• | A ‘Star Performer’ and ‘Major Contender’ in Everest Group‘s Banking Operations — Services PEAK Matrix® Assessment 2023 |
• | A ‘Horizon 1 — Disruptor’ in HFS Horizon: HFS Horizons: The Best Service Providers for Asset and Wealth Management, 2024 |
• | A ‘Leader’ and ‘Star Performer’ in Everest Group’s Financial Crime and Compliance (FCC) Operations Services PEAK Matrix® Assessment 2024 |
Insurance:
• | A ‘Major Contender’ in Everest Group‘s Life and Annuities (L&A) Insurance BPS and Third-Party Administrator (TPA) PEAK Matrix® Assessment 2023 |
• | A ‘Leader’ and ‘Star Performer’ in Everest Group’s Property & Casualty BPS PEAK Matrix® Assessment 2023 |
• | A ‘Leader’ in Life and Retirement (L&R), Property and Casualty (P&C), and Life & Retirement Insurance TPA Quadrants in the ISG Provider LensTM Insurance BPO Services Report 2023 for North America |
• | A ‘Leader’ in Life and Retirement (L&R) and Property and Casualty (P&C) Quadrants in the ISG Provider LensTM Insurance BPO Services Report 2023 for Europe |
• | A ‘Leader’ in NelsonHall’ s P&C Operational Transformation NEAT 2024 |
40
Horizontal-specific Recognitions
Finance and Accounting:
• | A ‘Leader’ in Gartner® Magic Quadrant for Finance & Accounting BPO 2023 |
• | A ‘Leader’ in ISG Provider Lens™ Finance and Accounting (F&A) Outsourcing Services 2023 Global Report across P2P, O2C, R2R and FP&A |
• | A ‘Major Player’ in IDC MarketScape: Worldwide Finance and Accounting Business Process Services in the Cloud 2023 Vendor Assessment (doc #US50527122, April 2023) |
• | A ‘Horizon 2’ player in HFS Horizons: F&A Service Providers, 2023 |
• | A ‘Major Contender’ and ‘Star Performer’ in Everest Group‘s Finance & Accounting PEAK Matrix® Assessment 2023 |
• | A ‘Major Contender’ in Everest Group‘s Finance & Accounting for Order to Cash PEAK Matrix® Assessment 2023 |
Procurement:
• | A ‘Leader’ in ISG Provider Lens™ Global Quadrant report 2023 for Procurement BPO Services and Transformation Consulting Services |
• | A ‘Major Contender and Star Performer’ in Everest Group‘s Procurement Outsourcing (PO) Services PEAK Matrix® Assessment 2023 |
• | A ‘Leader’ in Everest Group‘s Procurement Outsourcing (PO) Services — Source to Contract - PEAK Matrix® Assessment 2023 |
• | A ‘Leader’ in NelsonHall’s Procurement Transformation NEAT 2024 |
Customer Experience Services:
• | A ‘Leader’ in ISG Provider Lens™ 2023 Global Contact Center Customer Experience Services report across Digital Operations, Hybrid Working Solutions, AI and Analytics, and Social Media for CX Services |
• | A ‘Leader’ in NelsonHall’s CX Services Transformation NEAT 2024 |
• | A “Horizon 3” player in HFS Horizons: Customer Experience Service Providers, 2024 |
Research and Analytics:
• | A ‘Major Contender’ in Everest Group’s Data and Analytics (D&A) Services PEAK Matrix® Assessment 2023 |
• | A ‘Horizon 2 — Enterprise Innovator’ in HFS Horizon: Generative Enterprise Services, 2023 |
Human Resources:
• | A ‘Major Contender’ in Everest Group’s Multi-Process Human Resources Outsourcing (MPHRO) Services PEAK Matrix® Assessment 2023 |
Intelligent Automation:
• | WNS-Vuram recognized as a ‘Leader’ in ISG Provider Lens™ Intelligent Automation Services and Solutions for the US |
41
Corporate:
• | TIME’s The World’s Best Companies 2023 |
• | Bloomberg Gender Equality Index (GEI) 2023 |
• | WNS-Vuram: Business Brilliance Awards: Employer of the Year |
• | WNS-Vuram: Named to 2023 Best Workplaces in Asia List by Great Place to Work |
• | The Smart Cube: Ranked #6 among India’s Great Mid-Size Workplaces 2023 by Great Place to Work Institute — By Great Place to Work Institute |
• | Global Diamond Business Excellence Recognition 2023 for ‘Driving the Circular Economy’ by MSME Chamber of Commerce and Industry of India |
• | Global Sourcing Association (GSA) UK Awards 2023: |
• | Business Services Project of the Year |
• | Utilities Project of the Year |
• | Confederation of Indian Industry (CII) Digital Transformation 2023 Award for Customer Experience: CII Best Practice Award in the Innovation Excellence category |
• | Six Stevie International Business Awards 2023 |
• | Customer Service Team of the Year (Silver) |
• | Education — Virtual Learning Solution (Silver) |
• | Business or Competitive Intelligence Solution (Bronze) |
• | Governance, Risk & Compliance Solution (Bronze) |
• | Platform as a Service (Bronze) |
• | Compliance Solution (Bronze) |
• | ISG Paragon Awards EMEA (Europe, the Middle East and Africa) 2023: Category: Innovation |
Technology:
• | Foundry CIO100 Awards 2023 for WNS CIO Nayan Desai: |
• | The Mobility Mavens by Samsung Award |
• | The Disruptive 100 Award |
• | CIO Power List 2023 — Nayan Desai |
• | NetApp — CNBC TV18 Innovation Award 2023 in the category ‘Excellence in Data Protection and Disaster Recovery Implementation’ |
42
Human Resources (“HR”):
• | Brandon Hall Human Capital Management Excellence Awards 2023 |
• | Best Advance in Leadership Development for Women (Silver) |
• | Best University Professional Development Program (Silver) |
• | Best Use of Social/Collaborative Learning (Silver) |
• | Best Advance in Leadership Development (Silver) |
• | Tata Institute of Social Sciences (“TISS”) LeapVault Chief Learning Officer (“CLO”) Awards 2023 |
• | Best Diversity and Inclusion Training Program — Gold |
• | Best Leadership Development Program — Gold |
• | Best Risk/Safety/Policy Compliance Training/ COBEC Trekking Adventure Program — Silver |
• | One of the Top 25 Safest Workplaces in India at the KelpHR PoSH Awards 2023 |
• | Two Stevie Awards for Great Employers 2023: |
• | Achievement in Diversity and Inclusion (Silver) |
• | Achievement in Leadership Development (Bronze) |
• | Association for Talent Development’s BEST Award in the Talent Development category 2024 |
Corporate Finance
• | WNS Finance team recognized for Excellence at the CFONEXT100 2023 Awards in the category Finance Transformation |
• | Treasury Management International (TMI) Award 2023 for Innovation and Excellence in the Best Technology Transformation category — Gold |
• | Sanjay Puria wins the Economic Times CFO 2024 Award in the category Innovation in Finance — Large Enterprise |
Sanjay Puria wins the CFO 100 Roll of Honor Award in the category Winning Edge in Digital Transformation |
Corporate Social Responsibility (“CSR”):
• | WCF wins the Social and Business Enterprise Responsible Awards (SABERA) in the category Sashaktikaran (Enablement) |
• | WCF wins the CapeBPO Awards 2023 in the category Top Community Spirit Initiative |
• | WCF wins the Mahatma Award 2023 in the category Shiksha (Education) |
• | WCF wins the CSR Times Award 2023 for WCF Reading Program |
43
End-to-end service portfolio including higher-value transformational services and technology-enabled solutions
We continue to focus our service portfolio on more complex processes and solutions, and shift away from reliance on services that are less integral to our clients’ business operations, such as commoditized voice and transactional services (telemarketing and technical helpdesks), which characterized the business process outsourcing industry in its early days. We offer an array of higher-value, judgment-based services that seek to not only reduce cost and improve operating efficiency, but also enable improved decision-making, competitive positioning and business outcomes for our clients. These include consulting and transformation services, technology-enabled offerings, advanced analytics capabilities, digital customer experience solutions, high-end finance and accounting services, and strategic sourcing through supply chains. We also provide a wide array of industry-specific solutions, which cut across traditional “horizontal” services. These solutions are designed to help clients address process efficiency requirements, provide digital capabilities, generate business insights, and improve competitive positioning within their respective industries.
We have also developed and continue to develop technology-enabled, or automated, solutions that utilize our proprietary software and licensed software in conjunction with our core BPM services. These integrated, technology-enabled solutions allow us to offer higher-value, differentiated services, which are more scalable and repeatable and create value for our clients through increased process efficiency and quality. We also collaborate with technology companies, combining their software tools, platforms and expertise with our service capabilities to deliver differentiated business solutions to the marketplace. These technologies include AI, Gen AI, ML, cognitive computing, RPA, natural language processing and hyperautomation. We believe that technology-enabled automated solutions will enable us to expand our addressable market and grow our revenue in a non-linear way by decoupling revenue growth from headcount growth.
To this end, we offer platform-enabled BPM or BPaaS that tightly integrates our domain expertise, business processes, automation, embedded analytics and cloud-based infrastructure.
Proven global delivery platform
We deliver our services from 65 delivery centers in 13 countries around the world, located in Canada, China, Costa Rica, India, the Philippines, Poland, Romania, South Africa, Malaysia, Sri Lanka, Turkey, the UK and the US. Our ability to offer services delivered from a mix of onshore, nearshore and offshore locations benefits our clients from the perspectives of access to skills and talent, cultural alignment, language capabilities, business continuity, risk mitigation, scalability, efficiency and cost effectiveness.
We believe the breadth of our delivery capability allows us to meet our clients’ needs, diversifies our workforce, provides business continuity, and allows us to access local talent pools around the world. Additionally, we have put in place a distributed workforce model that comprises an efficient blend of in-office and remote working to tap the best available talent and skills globally.
Client-centric focus
We have a client-centric engagement model that leverages our industry-specific and shared-services expertise, flexible pricing models, “client-partner” relationship approach, as well as our global delivery platform to offer business solutions designed to meet our clients’ specific needs. We work closely with our clients to understand their specific requirements and to “co-create” unique, custom solutions that are designed to enable them to better compete and create differentiation within their respective industries.
We seek to enhance our value proposition to our clients by providing them with flexible pricing models that align our objectives with those of our clients. In addition to traditional FTE-based pricing, we provide alternative pricing models such as transaction-based pricing, outcome-based pricing and subscription pricing. A sizable percentage of our revenue, being 28.8% in fiscal 2024, is derived from these “non-FTE”-based pricing models. These models enable our clients to pay only for actual work performed or tangible benefit received.
We have also adopted a client-centric sales model, which is tightly integrated with our vertical organizational structure. Strategic client accounts are assigned a dedicated “client-partner” from our team who is responsible for managing the day-to-day relationship with the client. The “client-partner” is typically a seasoned resource with deep domain experience, who often works directly in the client’s local offices. Within our company, the “client-partner” is assigned to a specific vertical, and directly manages sales resources responsible for expanding client relationships. The “client-partner” is responsible for driving business value to our clients, monitoring quality of delivery and customer satisfaction, and managing account growth and profitability.
44
Proven experience in transitioning processes and running them efficiently
Many of the business processes that clients outsource to us are core to their operations, requiring substantial program management expertise to enable the transition of work to us. A well-planned and effectively managed transition is the cornerstone of our business proposition and helps our clients outsource their operations effectively and efficiently, focus on their business priorities and implement operating models that are designed to help them achieve their business strategies.
Our transition approach is structured to help deliver business outcomes to our clients by:
• | Minimizing risk and achieving rapid transition of services; |
• | Ramping up operations with minimal disruption to existing business, metrics, customers and suppliers; |
• | Effectively managing changes brought about by transformative tools and technologies; |
• | Managing a seamless transfer of responsibilities from any incumbent service provider to us; and |
• | Continuing to engage with clients to adapt to and drive changes for a future-ready transition model by leveraging remote training. |
At its core, all aspects of the transition process are governed by EnABLE, our proprietary transition toolkit, which has been tested and evolved over 20 years. EnABLE embeds multi-level governance, visibility, transparency, flexibility and compliance across the entire transition lifecycle.
Our differentiators include:
• | Customer-centricity: Our practice of “early transition voice of customer (“VoC”)” identifies and addresses opportunities to do better at meeting clients’ objectives and success criteria. |
• | Robust governance: Our multi-level governance approach seeks to ensure that transition reviews are conducted at all levels up to executive leadership. Risks are assessed and proactive support is provided with a view to achieving clients’ objectives. |
• | Strong leadership and experience: We have a robust and mature transition methodology with a strong record in managing and delivering transitions from clients as well as from major incumbent players. |
• | Global presence: Our team of skilled transition managers operates from all our major global delivery locations. Our agile and readily deployable team is always available for clients’ needs. |
Extensive investment in human capital development
At WNS, we have created a learning organization with the objective of empowering employees with skills that will help them to constantly collaborate, co-create and outperform in a changing business landscape. This learning organization is designed to offer developmental programs to every employee band level in the organization, across business units and enabling units. It is responsible for developing organization-wide skills within focus groups, such as behavioral, domain, technical, leadership, functional as well as process-related skills. See “— Human Capital — Training and Development.”
45
Learning Academy (the “LA”): The LA not only focuses on developing initiatives and programs that aim to enable high-impact leadership and potential across all employee band levels and geographies, but also focuses on building internal capability to create a future-ready and digital-savvy workforce. The LA has over 300 unique programs for various employee band levels and behavioral skill areas that are conducted across locations based on the learning strategies defined for each team.
The learning organization comprises the following building blocks:
• | Digital Capability Building |
• | WNS Education Program: A division of the Learning Academy, WNS Education is dedicated to providing learning programs that empower employees to remain relevant amid evolving times and shifting business priorities. In addition to a variety of curriculum-based certification programs, WNS Education offers numerous upskilling opportunities through curated self-paced programs, webinar series, keynote masterclasses and panel discussions with industry experts. |
• | Immersive Learning Experience On-Demand (“GLINT”): This AI-powered learning experience platform and knowledge cloud facilitates employee journeys in the organization with learning, skilling and career mobility solutions. GLINT offers an extensive repository of digital learning materials available at all times and across all devices, facilitating the rapid development of skills and fostering a learning environment to motivate others. |
• | Empowered Learning Management System (“LMS”): This system assists users to optimize learning outcomes, streamlining training management and generating centralized learning reports. Developed in partnership with EnthrallTech, this platform is tailored to oversee structured learning programs efficiently and flexibly. It enables users to schedule training sessions, coordinate with sessions instructors and content, handle user enrollments, conduct and monitor classroom and virtual trainings, and record session attendance and feedback. |
• | Leadership Programs: These comprise unique interventions designed for leaders, from future first-level managers up to senior executive leadership. They also focus on grooming women leaders and next-generation leaders. These programs consist of quarterly calendar programs and self-paced modules, primarily focusing on Gen AI, AI, and business unit-specific interventions, aligned with the Leadership Winning DNA framework. They are available across various geographical locations through partnerships with esteemed global learning vendors such as eCornell, Duarte Inc., Wilson Learning, and Strategic Proposals. These programs consistently receive high satisfaction scores, averaging 9 out of 10 in VoC feedback. |
• | Accessible, On-demand and Personalized Learning: We aim to achieve accessible, on-demand personalized learning through platform play, which leverages an AI-driven search engine to help employees learn on the go. The learning is available on demand and is accessible across regions over commonly used smart devices. |
• | Business-aligned Learning: To ensure learning is aligned to the goals of the business units and is performance driven, the business partner arm within the Learning Academy works in consultation with the business units’ leaders to create customized learning journeys for employees. The aim is to drive focused behavioral / potential development. |
Experienced management team
We benefit from the effective leadership of a global management team with diverse backgrounds, including extensive experience in outsourcing. Members of our executive and senior management team have, on average, more than 20 years of experience in diverse industries, including in the business process and IT outsourcing sector, and in the course of their respective careers have gathered experience in developing long-standing client relationships, leveraging technology, launching practices in new geographies, developing new service offerings and successfully integrating acquisitions.
46
Business Strategy
As a leading global BPM provider, we continue to evolve and enhance our capabilities and value propositions in order to expand our addressable market and enhance our success rates. Our differentiated solutions, which are backed by strong domain and industry focus, technology and automation, and advanced analytics continue to evolve with our clients’ changing business requirements. These services include consulting and advisory, digital transformation, data and analytics, AI and Gen AI, operations excellence, organization change management, agile execution and business process management services. We have received numerous awards from industry analysts and sourcing advisors that recognize our market position as a leader in the solutions we provide, and highlight our ability to deliver strong business outcomes for our clients. We will continue to focus on growing our client base, expanding current relationships and driving results by combining our deep industry expertise with our broad range of capabilities. We continue to invest in the key areas of domain and industry expertise, digital, data and analytics, AI and Gen AI, technology and automation, customer experience, digital operations and superior talent. We are also focused on strategic acquisitions to augment and enhance our existing capabilities. We also strive to integrate and drive value from our past acquisitions.
WNS’ strategic investments are proactively focused on delivering outcomes to meet our clients changing expectations and business requirements. These include ongoing investments in domain expertise, digital transformation, AI and Gen AI, data and analytics, customer experience, digital operations and broader business services. Our differentiated capabilities, solid client relationships, and proven ability to execute positions us well to drive both immediate benefits and long-term sustainable value for our clients and stakeholders. Some examples of our investments include:
• | Increase in the breadth and depth of services and solutions offered to our clients for across digital technologies (including AI and Gen AI), business transformation, data and analytics, consulting and advisory, organization change management, risk and governance, and reliable execution; |
• | Expansion of our client engagements, market positioning and addressable market through acquisitions, new partnerships and alliances, and the broadening of our engagement with industry advisors, analysts, academic institutions and industry bodies; |
• | Creating a Gen AI-focused strategy and program that operates across all client bases and business units to ensure we are leveraging best practices, building capabilities and experience, training our teams, and creating proactive solutions focused on industry needs; |
• | Hosting and scaling co-creation sessions with clients, which doubled over the last year; Client intimacy remains a focus area moving forward as we engage with our clients around more complex business challenges and opportunities including AI and Gen AI. Client engagement, along with co-creation workshops and consulting efforts will continue to accelerate as we identify and engage our clients around new opportunities; |
• | Building internal capabilities across the company in Gen AI will continue in the current year as we leverage leading academic institutions to educate, train and upskill our people in the application and adoption of Gen AI; |
• | The development of domain-focused digital and technology assets has been successful and we will continue to expand in this area in the next year. Examples of this development include our continued investment in the WNS Malkom automation platform for shipping and logistics, and the WNS EXPIRIUS suite of offerings for customer experience management. There are many other digital and technology assets in our plans for the coming year; and |
• | Focused strategic acquisitions to acquire or accelerate expansion of targeted capabilities. |
The key elements of our growth strategy are described below.
Providing new value-added services to clients
We continue to develop and expand our capabilities and offerings to meet evolving client and market demands and capture new market opportunities, with a heightened focus on driving digital transformation through technologies including AI and Gen AI, and leveraging advanced analytics to deliver actionable insights and improved outcomes. Increasingly, enterprises expect their BPM providers to be a strategic partner and deliver sustainable, enhanced value by improving revenue growth, delivery cost and efficiency, customer satisfaction, and competitive positioning. In order to deliver these results, we continue to expand the breadth and depth of our offerings which leverage the strength of our domain expertise, digital capabilities (AI, Gen AI, hyperautomation, ML, intelligent automation, cognitive computing, RPA), advanced analytics, and global talent. The addition of new services and capabilities are delivered through our strategic investment programs, including both in-house development (organic) and acquisitions (inorganic). As the BPM market continues to evolve and mature, demand for industry-specific solutions and new, innovative pricing models will increase. By delivering a wider portfolio of higher-value services to our clients, and migrating them towards subscription, transaction, and outcome-based pricing models, we aim to expand across the value chain with our clients and thereby enhance the scale, strength and profitability of these relationships.
47
Expand our existing client relationships while continuing to add new clients
We continue to focus on growing our business by expanding the scope of services we provide for existing clients and adding new client relationships.
Our focus on expanding relationships with existing clients is driven by cross-selling new services (including finance and accounting, procurement, customer experience, hyperautomation, data and analytics, digital transformation and technology) with the goal of moving up the value chain and moving into additional lines of business and geographies in order to deliver enhanced client value. The expansion of relationships is driven by our SBUs and account managers (and “client-partners”), who have industry-specific knowledge and expertise, and are responsible for maintaining a thorough understanding of our clients’ strategies and roadmaps as well as identifying and advocating new business solutions and opportunities. The SBUs and account management teams are supported in theirs sales efforts by a dedicated team of “farmers” (see below). As a result of this strategy, we have built a strong track record of expanding the scope of our client relationships over time.
In pursuing new client opportunities, we leverage our deep industry expertise and extensive range capabilities to “co-create” solutions which combine talent, technology and analytics. We aim to craft innovative proposals with compelling business cases by thoroughly understanding and aligning with client requirements, ensuring that our scale and experience are optimally utilized for each client’s unique needs. Our co-creation approach combined with our breadth of capabilities and industry understanding give us a differentiated positioning and the ability to compete successfully and win new clients. The SBU teams are supported in their sales efforts by a dedicated team of “hunters” (see below).
Our sales force is organized into two different groups; one, known as “farmers,” is dedicated to nurturing and expanding existing client relationships, while the other, known as “hunters,” is focused on acquiring new clients. Over the past year, our operating model has evolved with the introduction of the SBU structure, empowering our business units to capitalize on economies of scale within industry groupings under the leadership of a dedicated CBO. This strategic alignment is essential for our future positioning and enables us to swiftly adapt to market disruptions. At a global level, we have implemented a cohesive strategy to enhance our industry-specific, geographic and client service capabilities, streamlining our sales activities for maximum effectiveness.
Our industry-specific, domain-focused, and specialized teams collaborate to serve existing clients and pursue new business opportunities. Our successful industry and domain-focused approach to solution differentiation and market penetration is designed to drive enhanced value for clients and growth for WNS. Our ongoing investments in client-facing initiatives, including large deal pursuits and penetration of strategic relationships, are designed to enhance these objectives.
48
Enhance awareness of the WNS brand name
Our reputation for operational excellence, domain expertise, and technology and analytics capabilities among our clients has been instrumental in attracting and retaining clients as well as talented and skilled employees. We believe that our guiding principles of co-creation and client centricity resonate favorably with clients as they are indicative of our intent to completely align with client needs and leverage synergistic collaboration (with clients and strategic partners) to drive outcomes.
We also believe that we have benefited from strong client referrals that have helped us to scale our business. We are actively driving initiatives to enhance awareness of the WNS brand in our target client and employee markets. We are further streamlining acquisition integration to execute a concerted, unified go-to-market strategy. To accomplish this, we have a dedicated global marketing team comprising experienced industry talent. We are also focusing on developing channels to increase market awareness of the WNS brand, including participation in industry events and conferences, exposure in industry publications, publication of articles and white papers, webinars and podcasts, internet and digital media, social media, and other initiatives that create enhanced visibility of the WNS brand and establish WNS’ thought leadership capabilities in the BPM industry.
We are working to improve visibility and positioning with the BPM industry analysts, sourcing advisors, general management consulting firms, and boutique outsourcing firms, who are often retained by prospective clients to provide strategic advice, act as intermediaries in the sourcing processes, develop scope specifications, and aid in the partner selection and implementation process. We are also leveraging our global partner network for joint go-to-market strategies. Since COVID-19, we have augmented our digital engagement by leveraging various platforms to further enhance our brand presence.
Expand our delivery capabilities
We currently operate from 65 delivery centers located in 13 countries around the world. As at the end of fiscal 2024, we increased our delivery capacity by 4,377 seats, or approximately 12%, as compared to the end of fiscal 2023, as a result of the addition of new delivery locations as well as expansion in some of our existing delivery locations. We intend to expand our global delivery capability, as necessary, through additional delivery centers in onshore, nearshore and offshore locations as well as through collaboration with other providers, based on client demand and market trends. Depending on talent pool availability, we plan to further expand to locations classified as tier 2 cities in India to access under-tapped talent pool and provide more flexibility to our employees. Additionally, we will continue to expand our capacity requirements as necessary, in line with client demands and through the adoption of a hybrid operating model that consists of both work-from-home and work-from-office arrangements in the medium to long term. This approach will allow us to offer our clients maximum value and flexibility and gain access to potential clients and markets that may have specific delivery requirements or constraints.
We remain focused on creating a delivery model that can provide certainty in outcomes despite business variability. Our focus remains on enhancing both our in-office and remote cybersecurity protocols and fine-tuning a new longer-term future-state hybrid model solution that will allow us to seamlessly move delivery between office and home. We have also adopted a hybrid people model with full time, temporary contract and gig workers, such as independent contractors, online platform workers, contract firm workers and on-call workers.
49
Leverage acquisitions and partnerships to expand our capabilities in attractive market segments
We believe that capability-based acquisitions are an important component of our growth strategy. Our past acquisitions, including the three completed in fiscal 2023 are representative of this approach. Our acquisitions have complemented our existing services by addressing capability gaps, expanded our addressable market opportunities and, enhanced our ability to meet the emerging needs of our clients. Key areas addressed with past acquisitions include technology and automation, data and analytics, geographic delivery capability, and specialized capabilities across both horizontal and vertical services.
Our vision going forward remains focused on augmenting internal capability development with strategic acquisitions and partnerships. For these external capabilities, we continue to pursue a strategy focused on companies that have unique and demonstrated capabilities, a high degree of business and cultural fit, and the ability to help us capitalize on strong end-market opportunities. Our acquisition track record demonstrates our ability to successfully identify, integrate, manage and develop the businesses we have acquired.
Business Process Management Service Offerings
We offer our services to clients through industry-focused business units. We are organized into the following SBUs to provide more specialized offerings in each of these industries and more effectively manage our sales, solutions, marketing and delivery processes:
• | TSLU: Travel and leisure, shipping and logistics and utilities; |
• | MRHP: Diversified businesses (including manufacturing, retail and CPG, media and entertainment, and telecommunication), hi-tech and professional services, and procurement; |
• | HCLS: Healthcare and life sciences; and |
• | BFSI: Banking and financial services. |
Effective April 1, 2023, we have adopted a new organizational structure featuring four SBUs, each headed by a CBO. Under the new organizational structure, we combine our company’s existing verticals into the four SBUs. We believe the new organizational structure will help drive improved outcomes for our global clients and enable our company to better drive business synergies, enhance scalability, generate operating leverage, and create organizational depth. These SBUs develop client-specific solutions, build capabilities, maintain a unified go-to-market approach and are integrally responsible for service delivery, customer satisfaction, growth and profitability.
In addition to industry-specific services, we offer a range of services that are common across multiple industries (which we refer to as our horizontal services), including finance and accounting (including procurement), customer experience services, research and analytics (which we have branded as “WNS Triange) and technology services. In addition, our global transformation practice offers higher-value services such as digital transformation and consulting services, which are designed to help our clients modify their business processes to enhance productivity, manage changes in the business environment, and leverage business knowledge to increase market competitiveness. We help clients drive these initiatives with technology-enabled solutions, process re-design including initiatives such as Six Sigma or Lean, and business analytics.
To achieve an in-depth understanding of our clients’ industries and the geographies in which they operate, we manage and conduct our sales processes in our four key markets — Europe, North America, Asia-Pacific and Africa. Our sales teams are led by senior professionals who focus on target industries, processes and clients. Each business unit is staffed by a dedicated team of managers and employees engaged in providing BPM client solutions. In addition, each business unit draws upon common support services from our information technology, human resources, training, corporate communications, corporate finance, risk management and legal departments, which we refer to as our corporate-enabling units.
TSLU
TSLU covers travel and leisure, shipping and logistics, and utilities.
Travel and Leisure
We deliver end-to-end services to clients across the travel and leisure industry value chain.
Our endeavor to improve our clients’ competitive positioning is underpinned by a combination of domain expertise and digital-led solutions. We co-create intelligent, automated, resilient systems, and facilitate our clients’ adoption of digitalization. Through our digital product portfolio of cloud-based, as-a-service models and application programming interface (“API”)-integrated offerings, we seek to improve customer experience, enhance operational control and efficiency, and drive revenue uplift. We also collaborate with third-party global technology solution providers in our efforts to drive innovation in our service offerings that seek to provide customized and best-of-breed digital-driven solutions to our clients.
As at March 31, 2024, we had 11,538 employees in this business unit, several hundred of whom have International Air Transport Association, Universal Federation of Travel Agents or other travel industry related certifications. In fiscal 2024 and 2023, this business unit accounted for 16.1% and 16.9% of our revenue and 16.6% and 17.9% of our revenue less repair payments (non-GAAP), respectively.
Sub-verticals / Industry Sectors. The key travel and leisure sub-vertical and industry sectors we serve include:
• | Suppliers: Airlines, cargo, hotels, cruise lines, coach companies; |
• | Travel intermediaries: Online travel agencies (“OTA”), travel management companies (“TMC”), tour operators; and |
• | Other travel segments: Airports, hospitality brands, global distribution systems (“GDS”), travel technology companies. |
50
Service Offerings. Through WNS TRAVOGUE, our portfolio of industry-specific solutions, we provide the following six key areas of services to clients in this business unit:
Travel and Leisure — Service Offerings | ||||||
TRAVXP |
TRAVOPS |
TRAVREV |
TRAVCONTROL | |||
Booking queries, general queries, change and cancellations, special service requests, helpdesk support, website assistance, guest relations, refund requests, complaint management, baggage desk, claims management, chargebacks, VoC survey support, hyper-personalized customer segmentation, campaign management, loyalty management, social media, speech and chat analytics, relocations, ticket exchanges, expense management; | Airport operations, billing and refunds, cargo operations, fare filing and distribution, flight firming, credit card transactions, rate validation and loading, revenue integrity, airline scheduling, right-to-fly, data management, learning management, service management, payroll, quality assurance, workforce management, talent management, procurement, management information system and reporting, technical helpdesk, AI, automation and robotics, passenger service systems and passenger revenue, accounting – selection and implementation, enterprise resource planning and customer relationship management (“CRM”) platforms, mobility and access, data engineering, helpdesk – fares, knowledge portal support, schedule change, rate parity low fare search, revenue assurance, ticketing, content management, bid management, including request for proposal (“RFP”) and request for information; | Direct channel enhancement, revenue operations and management, ancillary revenue maximization, inventory optimization, demand forecasting, cross-sell and upsell, commercial planning, revenue performance analytics, alliance and market share analysis, fleet and schedule optimization, route profitability, sales analytics, bookings and reservation – voice, e-mail and office sales, group bookings, payments, booking materialization, pipeline performance, product mix insights, group optimization, contract analysis, supplier / vendor analytics, pricing strategy, pricing analysis, account management and RFPs, customer insights and preferences, margin analysis and optimization, voice, e-mail, chat, click-to-call, lead management, total revenue optimization; | Revenue assurance, claim fraud analytics, fare and billing information data tapes (“BIDT”) audit, financial leakage analysis, agency debit memo review, airway bill verification, cargo rate audit, credit card reconciliation, fare and itinerary discrepancy, interline audit, invoice audit and recovery, direct operating cost management, interline payables, settlement of airlines reporting corporation/billing and settlement plan, supplier and media partner settlements, claims refund, analytics – accounts payable and reconciliation, travel and expense, vendor and tail spend, reconciliation – airline, interline, airlines reporting corporation/billing and settlement plan and “own” sales, analytics – direct operating cost variance, route profitability, special prorate agreement, travel package and product profitability, traveler segment, agency sales performance, actual and forecasting – passenger and cargo revenues, traveler revenue, revenue accounting – passenger and cargo, interline receivables, commission audit, revenue recovery and protection, loyalty program accounting, refund claims, reconciliation – airline, car, hotel, cruise, destination management companies, airline reporting corporation / bank settlement plan, “own” sales, source-to-pay activities, hotel settlements, media partner settlement, record-to-report activities, book-to-cash activities; |
51
Travel and Leisure — Service Offerings | ||
TRAVGREEN |
TRAVOPS | |
Identify steps to reduce carbon footprints in daily operations, such as route, stock keeping unit mix, fleet and fuel optimization, building management systems and vendor assessments;
Assess past performance in carbon reductions and dynamic forecasting of future impact;
Partner with greenhouse gas-reduction specialists to enable airlines achieve carbon neutrality;
Engage with responsible travel campaigns; Brand improvement initiatives; |
Value stream mapping, process consolidation and optimization, intelligent process automation design, analytics-driven process innovation, network and fleet management strategy, commercial strategy, enterprise performance management, net zero and ESG strategy, HR consulting, enterprise IT strategy, application portfolio assessment, PSS selection, new technology – AI / ML, blockchain, AR / VR, customer experience strategy design, digital marketing automation, digital asset diagnostics, loyalty strategy and advisory, revenue accounting consulting, financial performance benchmarking, financial process consulting, enterprise architecture design, big data consulting, cloud strategy, business intelligence strategy, data governance strategy; |
Technology Tools / Platforms. We utilize the following technology tools and platforms in delivering services to our clients in this business unit:
• | WNS TravelBuddy: An industry-first modular platform powered by Gen AI and automation capabilities to address different aspects of corporate travel; |
• | COMMAI: An end-to-end corporate and published commission comprehension and calculation platform, powered by Gen AI and ML, for OTAs and TMCs; |
• | WNS EXPIRIUS: A digital customer experience model that integrates human-assisted design and domain expertise with AI-driven conversational insights and consulting-led strategies; |
• | IRROPs: A Gen AI-enabled prediction module for irregular operations with event categorization, severity mapping and revenue impact analysis; |
• | Verifare Plus 3.0SM: A fare audit solution; |
• | BIDT Audit: An automated, cloud-hosted revenue integrity platform for the audit and recovery of any revenue losses resulting from non-compliance in travel agency bookings; |
• | SeatSure: Intelligent automation for seating of minors; |
• | QbaySM: A multi-GDS platform for queue management; |
• | WNS ACOSS: An end-to-end cargo solution powered by intelligent automation, advanced analytics and domain expertise; |
• | Claim fraud analytics: An automated analytics solution to identify fraudulent passenger and baggage claims; |
52
• | AnciFly: An ancillary revenue analytics engine; |
• | CFO digital cockpit: One-view analytical insights of the finance organization; |
• | WNS TRAC: A unified and comprehensive suite of technology solutions designed to enable the futuristic agenda of chief financial officers (“CFOs”); |
• | Financial Intelligence-in-a-Box (“FIAB”): This combines advanced analytics-led techniques, applications and methods designed to enable end-to-end data management and help improve control, prevent financial leakages, unlock working capital and bolster compliance; |
• | InsighTRAC: An AI-led procurement analytics platform that tracks spends and identifies savings opportunities; |
Shipping and Logistics
We are one of only a few providers of BPM solutions for the shipping and logistics market. Our strategic focus is demonstrated through our organizational structure, where we have a separate logistics vertical and approximately 6,000 dedicated logistics BPM professionals who cater to more than 24 leading logistics brands worldwide. Our client solutions span the entire shipment lifecycle, such as booking, documentation, core operations support, customer experience services, finance and accounting, customer experience services, business technology and data analytics.
We have a long-term strategic focus on developing and deploying new-age technologies, tools and platforms designed to create sustainable cost and quality advantage for our clients. We also leverage our analytics expertise in combination with industry domain knowledge and custom-built proprietary frameworks to help clients make informed decisions at the right time. We provide an array of services to our clients, such as complex data integration, cutting-edge advanced analytics, personalization and big data.
As at March 31, 2024, we had 6,357 employees working in this business unit. In fiscal 2024 and 2023, this business unit accounted for 7.6% and 7.6% of our revenue, and 7.9% and 8.0% of our revenue less repair payments (non-GAAP), respectively.
Sub-verticals / Industry Sectors. The key shipping and logistics sub-verticals and industry sectors we serve include:
• | Global air express and courier companies; |
• | Ocean shipping – Non-vessel operating common carrier, ocean liners, ports and terminals and shipping agencies; |
• | Trucking – Less-than-truckload, full truckload, truck rental and leasing, compliance, safety and accountability; companies |
• | Third-party logistics and fourth-party logistics services; |
• | Rail; and |
• | Transportation safety and compliance. |
53
Service Offerings – We provide the following key areas of services to clients in this business unit:
Shipping and Logistics — Service Offerings | ||||||
Sales and Marketing |
Customer Experience Services |
Document Processing |
Operations Support | |||
Tariff filing and maintenance, rate quotes, service contract / rate agreement creation and maintenance and actuarial services; | Customer file and debtor file administration, customer helpdesk, booking desk-phone / e-mail / electronic data interchange web, rating companies) and capital modeling, pricing and underwriting support, and catastrophe modeling; | Exports, bill of lading, processing, advance custom manifest submission, freight audit, billing and invoicing, vessel closures, imports, import data quality process / checks, arrival notifications, import general manifest filings with delivery order issuance, customers document processing, verified gross mass updating; | Vessel schedules – long-term support, vessel schedules – coastal, routing module maintenance, traffic control coordination, booking with carrier, hazardous cargo approvals, vendor management – vendor file administration, purchase order/job order creation, gate moves, ship husbanding, stowage planning, bay plan submission and distribution, inbound and outbound trans-shipment, maintenance and repairs, global stock reconciliation, container leasing validation, vessel performance reports, inventory management, chart corrections management, safety and environmental KPI monitoring onshore; | |||
Transportation Safety and |
Enterprise Shared Services |
HR and Payroll |
Sourcing and Procurement | |||
Driver logs, driver qualification, video log monitoring, and miles without hours exceptions handling, comprehensive automotive logistics and administrative services; | Accounts payable, accounts receivables, disbursement accounting, credit and collections, agency reconciliations, general ledger / bank reconciliation, cash reporting and audit / vendor reconciliation, financial management reporting, vendor helpdesk, monthly closing / quarterly / yearly closing, treasury support, agency audits, claims management; | New hire setup, employee data changes, payroll enquiries; | Strategic sourcing, category management, contract management, spending analytics, and transactional procurement; | |||
Research and Analytics |
Technology Services |
|||||
Metrics realization and analysis, network design and optimization, transport management, shipping performance management, tonnage analytics, carrier sourcing analytics, fleet analysis and maintenance, reverse logistics analytics, revenue analytics, and distribution center analytics; and | Intranet support, claims management, data hubbing, e-commerce registration, e-learning module content management, e-learning module content creation and intelligent automation services across segments; platform consulting and implementation support, consulting and transformation services (automation, business process re-engineering, digital). |
54
Technology Tools / Platforms. We utilize the following technology tools and platforms in delivering services to our clients in this business unit:
• | Malkom.AI: WNS’ proprietary intelligent digitization and shipment execution platform powered by AI/ML, RPA infused with Gen AI ; |
WNS Malkom: WNS Malkom is a proprietary platform underpinned by artificial intelligence and machine learning to re-define Less-than-Truckload (LTL) billing. The platform automates the end-to-end Bill of Lading (BoL) process, reducing any manual, repetitive and error-prone tasks;
• | DSOP: A digital SOP utility featuring functionalities for executing dynamic SOP creation and sophisticated SOP assist; |
• | WNS RPA Center of Excellence (CoE): Designed to address the diverse business automation needs. It facilitates consultancy, gap analysis and more through a customer-facing user interface that gives a holistic, 360-degree view of automation possibilities for the business; |
• | WNS Fire: A desktop app designed to enable organizations to build a top notch dispute management process by reducing resolution cycle time and maximizing customer satisfaction using real-time data and insights; |
• | WNS Bridge: Real-time 360° visibility platform and reporting station; |
• | Bolt: Micro Learning Knowledge reinforcement and dissemination tool; and |
• | GLINT – An AI-powered learning experience platform and knowledge cloud, it facilitates employee journeys in the organization with learning, skilling and career mobility solutions. GLINT offers an extensive repository of digital learning materials available at all times and across all devices, facilitating the rapid development of skills and fostering a learning environment to motivate others. |
Utilities
We are a leading utilities BPM solutions provider with domain expertise across the utilities value chain – generation, transmission, distribution and retail. Our solutions portfolio supports utility companies catering to the residential, industrial, and small and medium enterprise segments.
We are a strategic transformation provider to clients from the US, the UK, and Asia-Pacific and African regions. We offer digital-driven, technology-enabled, analytics-led and automation-infused services. We support business-to-consumer and business-to-business processes for our clients through our solutions spanning meter-to-cash (including customer acquisition and management, billing and metering, payment processing, credit and collections) and other areas within the utilities value chain, including distribution and field services. Our long-standing relationships with leading global companies have helped us develop geography- and industry-specific domain expertise and capabilities in key segments. We enable business transformation by leveraging analytics, digital platforms, tools and solutions, and automation through AI and cognitive intelligence solutions.
Our capabilities to support clients across processes in oil and gas, electricity and water suppliers include end-customer support, back-office processes, new product offerings (including prepay meters), finance and accounting outsourcing services (including procurement services), debt management and other enabling services, such as meter reading, bill printing and digital support services (including smart metering). Our Utility-in-a-Box tool offers platform integration, application integration, data integration, process integration, component integration and system integration capabilities along with document control and digitization, master data management, enterprise resource planning implementation and support, and digital meter-to-cash.
Our digital customer experience services are led by our go-to-market differentiator WNS EXPIRIUS, which is powered by our CoEs that leverage human-assisted design to integrate domain, technology and analytics to create a holistic digital experience. We have built eight modular digital solutions in the WNS EXPIRIUS suite, which enable us to offer on-demand scalable omni-channel service. Its contact strategy employs bot conversations to intelligently act on customer intent in a human-like manner, supporting major needs in billing, refunds, payment schemes and payment mode changes, home-moves, and mapping customer account information to power and utility trends. Using social media analytics and big data analytics across multiple channels, we help provide clients with a single view of the customer. Our analytics offerings include mining of structured and unstructured data, speech and text analytics, and revenue assurance analytics that includes home-move and void solutions, debt management, collections, vulnerable customer support and an analytics CoE. Our offerings in RPA, AI and ML include feasibility studies to identify processes, design and build solutions, and develop codes to automate processes for deployment in live environments. As an organization, we are also working on our oil and gas capability and building our renewable energy capability by evaluating a carbon emission model that is designed to not only help our clients but also their customers.
As at March 31, 2024, we had 5,706 employees working in this business unit. In fiscal 2024 and 2023, this business unit accounted for 5.9% and 4.9% of our revenue, and 6.1% and 5.2% of our revenue less repair payments (non-GAAP), respectively.
55
Sub-verticals / Industry Sectors. The key utilities sub-verticals and industry sectors we serve include:
• | Oil and gas; |
• | Electricity; and |
• | Water. |
Service Offerings. We provide the following key areas of services to clients in this business unit:
Utilities — Service Offerings | ||||||
Digital Meter-to-Cash Revenue Cycle |
Customer Experience Services |
RPA, AI and ML |
Research and Analytics | |||
Managing the customer lifecycle, which covers acquisition, billing, payment and withdrawal along with dispute resolution, exception handling, customer debt management, payment management for electricity, gas and water utilities across residential and business customers, all-encompassing smart and analog meters, reduction in voids and gap properties, energy efficiency and zero carbon emission; | Sales CoE encompassing customer acquisitions, retention, enhancement, cross-selling / up-selling, customer experience services — queries, correspondence, and asset management; prepay to help our clients set up a completely new offering for the customers; | Feasibility studies to identify processes, build solution design, develop codes to automate processes for deployment in live environments; | Data mining, decision-support services, revenue assurance covering smart collections, fraud analytics, bankruptcy forecasting, fraud reduction, cash flow improvement and engagement with vulnerable customers; this also has customer analytics – segmentation, lifetime value analysis, net promoter score analysis, speech analytics and text analytics; | |||
Enterprise Shared Services |
||||||
Finance and accounting, supply chain management and procurement: E-sourcing, vendor rationalization, supplier management, procurement optimization, sourcing, procure-to-pay transactions, supply chain analytics, order-to-cash transactions and record-to-report; and Human resource management: Administration support and payroll services. |
MRHP
MRHP covers diversified businesses (including manufacturing, retail and CPG, media and entertainment, telecom, hi-tech and professional services, and procurement;
Diversified Businesses (including Manufacturing, Retail and CPG, Media and Entertainment and Telecom)
We deliver comprehensive BPM solutions for diversified businesses, including manufacturing, retail and CPG, media and entertainment, and telecom. Across these industries, we have developed a suite of transformative digital and analytics solutions that are designed to optimize business performance and enhance customer experience. Our offerings include a host of platform-based and intelligent automation-driven solutions such as WNS’ FIAB designed to prevent financial leakages, unlock working capital and bolster compliance; WNS EXPIRIUS designed for enhanced customer experience and higher sales; warranty management BPaaS; supply chain planning suite and control tower; CPO TRAC (a procurement management solution to assist chief procurement officers (“CPOs”)) for digital-led procurement management; e-commerce digital merchandising and digital order management.
Our offerings also encompass advanced analytics solutions that help drive business performance, including working capital optimization, sourcing spend reduction, marketing spend optimization, merchandizing and assortment optimization supply chain risk reduction and increased customer lifetime value.
Leveraging our data and digital capabilities, we continue to build new domain focused solutions; especially in the imminent field of Generative AI. Some of these include:
1. | Co-pilot solutions for customer service associates that enable personalized conversations |
2. | Personalized campaigns that improve loyalty and revenues |
3. | Journal entry anomaly detection and classification with auto-generation of business rules and recommendations |
56
As at March 31, 2024, we had 4,199 employees in this business unit. In fiscal 2024 and 2023, this business unit accounted for 14.3% and 14.7% of our revenue and 14.8% and 15.5% of our revenue less repair payments (non-GAAP), respectively.
Manufacturing: Our manufacturing team has rich experience in delivering metrics-driven solutions and transformation programs for our manufacturing clients.
Sub-verticals / Industry Sectors. The key manufacturing sub-verticals and industry sectors we serve include:
• | Electronics manufacturers; |
• | Metal and mining companies; |
• | Optical equipment and imaging product manufacturers; |
• | Building and construction product manufacturers; |
• | Aeronautical product manufacturers; |
• | Precision engineering companies; |
• | Industrial manufacturing companies; |
• | Specialty chemicals companies; |
• | High-tech products companies; and |
• | Food processing companies. |
Service Offerings. We provide the following key areas of services to clients in this business unit:
Manufacturing – Service Offerings | ||||
Supply Chain Planning and Forecasting |
Sourcing and Procurement |
Fulfillment and Logistics | ||
Sales and operations planning, demand forecasting, supply planning, inventory management, inventory analytics; | Strategic sourcing, category management, contract management, spend analytics, transactional procurement; | Order entry and processing, order tracking, billing / invoicing, transport management, logistics optimization; | ||
Warranty and Returns Management |
Sales, Marketing and Customer Services |
Enterprise Shared Services | ||
Warranty customer operations, warranty claims management, parts / repair management, warranty financial management, returns management, customer helpdesk; | Global market opportunities, brand building, go-to market strategy, customer experience services, order management, acquisition analytics, retention analytics; and | Finance and accounting services, statutory and compliance support, customer experience services, human resource services, IT service desk, application support. |
Technology Tools / Platforms. We utilize the following technology tools and platforms in delivering services to our clients in this business unit:
• | FIAB: Financial Intelligence-in-a-Box combines advanced analytics-led techniques, applications and methods designed to enable end-to-end data management and help improve control, prevent financial leakages, unlock working capital and bolster compliance; |
• | CPO TRAC: A procurement management solution that leverages digital advancements along with predictive and functional analytics designed to transform procurement functions; |
• | Manufacturing RPA & Intelligent Automation TRAC: A suite of automation solutions that streamlines operations across the manufacturing value chain; and |
• | Warranty Management BPaaS: A platform-led offering that is designed to enable automated claims processing, improve customer satisfaction and reduce cost of warranty operations. |
Retail and Consumer Packaged Goods: Our retail and CPG solutions are designed to help our clients derive consumer behavioral insights, optimize marketing expenditures, plan their growth strategy, reduce operational costs and streamline processes through efficiency, quality and productivity improvements, and improve customer service.
Our services are supported by a research and analytics platform, WADESM, which was designed and developed to enable retail and CPG companies to access, organize and analyze data from various external sources and further use the insights gained to make informed decisions.
57
Sub-verticals / Industry Sectors. The key retail and CPG sub-verticals and industry sectors we serve include:
• | Beverage companies; |
• | Fast food chains and restaurants; |
• | Processed food suppliers; |
• | Cosmetics and healthcare companies; |
• | Apparel and footwear; |
• | General merchandize retailers; |
• | Specialty retailers; and |
• | E-commerce retailers. |
Service Offerings. We provide the following key areas of services to clients in this business unit:
Retail and Consumer Packaged Goods – Service Offerings | ||||
Strategy Solutions |
Customer Experience Services |
Supply Chain Solutions | ||
Market entry strategy, balancing portfolio investments, consumer and market insights, innovation strategies, power brand strategy, marketing spending optimization; | Omni-channel (phone, e-mail, fax, website, live chat, social media) customer experience services; | Retailer-supplier collaboration for demand-driven supply chain and retail execution management, supply intelligence, supplier performance and risk monitoring, contract management, supply chain orchestration – global trade shared services, trading partner helpdesks, logistics; | ||
Revenue Management Solutions |
Content Services |
Enterprise Shared Services | ||
Planning and execution of transaction and interaction-based campaign strategies, loyalty management, credit control and collections, market mix promotions and assortment optimization | Product catalogs, user-generated content moderation, digital content protection, web / print content, website analytics and optimization; and | Finance and accounting services, statutory and compliance support, sourcing and procurement services, human resource services, IT service desk and application support. |
Technology Tools / Platforms. We utilize the following technology tools and platforms in delivering services to our clients in this business unit:
• | WNS EXPIRIUS: A digital customer experience model that integrates human-assisted design and domain expertise with AI-driven conversational insights and consulting-led strategies; |
• | WNS Skense: A proprietary cognitive data capture and contextualization platform, that leverages Gen AI and ML technologies to extract data from complex and unstructured sources using Large Language Models (“LLM”); it presents the contextualized information in a structured, usable format; |
• | FIAB: A combination of advanced analytics-led techniques, applications and methods that are designed to enable end-to-end data management and help improve control, prevent financial leakages, unlock working capital and bolster compliance; |
• | SocioSEERTM: A social media analytics platform; and |
• | CPO TRAC: A procurement management solution that leverages digital advancements along with predictive and functional analytics designed to transform procurement functions. |
Media and Entertainment: Our media and entertainment offerings are designed to help our clients create new revenue streams, capitalize on emerging digital opportunities, attract next-generation consumers and boost margins.
Working with some of the largest media and entertainment companies in the world gives us an undisputed advantage in understanding the nuances of the business. We leverage years of industry and process experience, and a large team of digital media experts to deliver next-generation cost-effective solutions to clients in this industry.
58
Sub-verticals / Industry Sectors. The key media and entertainment sub-verticals and industry sectors we serve include:
• | Music; |
• | Publishing; |
• | Television; |
• | Radio; |
• | Filmed entertainment; |
• | Gaming and animation; |
• | Sports entertainment; and |
• | Internet and outdoor advertising firms. |
Service Offerings. We provide the following key areas of services to clients in this business unit:
Media and Entertainment – Service Offerings | ||||
Strategy Solutions |
Digital Operations and Royalty Management |
Sales, Marketing and Distribution Solutions | ||
Market entry strategy, balancing portfolio investments, consumer and market insights, innovation strategies, brand power strategy, marketing expense optimization; | Digital operations solutions to help companies successfully expand into the digital business; royalty management solutions to help clients manage rights and royalties in both new media and traditional media; piracy protection services to help companies prevent media piracy issues; | Seamless integration of traditional and digital product sales, marketing and distribution to enable clients to roll out timely innovative pricing / packaging strategies; | ||
Customer Experience Services |
Content Services |
Enterprise Shared Services | ||
Omni-channel (phone, e-mail, fax, website, live chat, social media) customer experience services; | Product catalogs, user-generated content moderation, digital content protection, web / print content, website analytics, optimization; and | Finance and accounting services, statutory and compliance support, sourcing and procurement services, human resource services, IT service desk, application support. |
Technology Tools / Platforms. We utilize the following technology tools and platforms in delivering services to our clients in this business unit:
• | SocioSEER™: A social media analytics platform; |
• | WNS EXPIRIUS: A digital customer experience model that integrates human-assisted design and domain expertise with AI-driven conversational insights and consulting-led strategies; |
• | FIAB: A combination of advanced analytics-led techniques, applications and methods that are designed to enable end-to-end data management and help improve control, prevent financial leakages, unlock working capital and bolster compliance; and |
• | CPO TRAC: A procurement management solution that leverages digital advancements along with predictive and functional analytics designed to transform procurement functions. |
Telecom: Our experience in consolidating and centralizing the functions of our telecommunications clients with built-in variable capacity to meet business requirements helps us deliver business value. WNS’ end-to-end BPM solutions are designed to enable telecom companies to transform their value chain while tackling myriad challenges.
Our solutions are underpinned by the right mix of digital, analytics, and domain and process expertise that enables our clients to achieve cost efficiencies and drive sustainable growth.
59
Service Offerings: We provide the following key areas of services to clients in this business unit:
Telecom — Service Offerings | ||||||
Customer Acquisition |
Order Provisioning and Order |
Operations and Customer |
Enterprise Shared Services | |||
Contract administration, sales order processing, service administration and data control; | New products and services, service delivery process creation, order provisioning, technical validation and support, rejected order tracking, order tracking, proactive order management, billing, data management (for example, forms and administration); | Inbound customer experience services, logging and monitoring service requests, CRM analytics, collection analytics, web correspondence, IT customer experience services (global service desk); and | Finance and accounting services, statutory and compliance support, sourcing and procurement services, human resource services, IT service desk, application support. |
Hi-Tech and Professional Services
Our hi-tech and professional services (“HPS”) business unit’s objective is to help clients gain a competitive edge and outperform in their respective industries by leveraging digital transformation and tech-enabled solutions under a consultancy-led approach. We currently cater to more than 60 clients from our key delivery centers in India, Romania, China, the Philippines and Sri Lanka.
Our HPS business unit offers an array of solutions to key sub-segments within the vertical. Our solutions are designed to address trust and safety issues, fraud operations, revenue operations, business and market intelligence, and data management, annotation and labeling. We have helped clients streamline and centralize their operations, set up global business services centers and optimize cost of operations encompassing industry-specific services along with key horizontal services such as finance and accounting, human resource management, customer interaction services, procurement, and IT and infrastructure management.
As at March 31, 2024, we had 4,606 employees in the business unit. In fiscal 2024 and 2023, this business unit accounted for 7.2% and 6.6% of our revenue, and 7.4% and 6.9% revenue less repair payments (non-GAAP), respectively.
Sub-verticals / Industry Sectors. The key HPS sub-verticals and industry sectors we serve include:
• | Internet and Social Media; |
• | Enterprise Tech and Software; |
• | Consumer Tech and Platforms; |
• | Information Processing Services Providers; |
• | Talent Advisory and Executive Search; |
• | Strategy and Consulting; and |
• | Real Estate and Investment Trust Services. |
60
Service Offerings. We provide the following key areas of services to clients in this business unit:
Hi-Tech and Professional Services — Service Offerings | ||||
Internet and Social Media AND |
Enterprise Technology and Software |
Information Processing Service | ||
Revenue operations (lead generation and scrubbing, upper funnel management, subscription management, advertisement sales, digital and print advertisement operations, campaign management, agency and partner support);
Trust and safety (transaction monitoring, vendor and customer due diligence, KYC/AML document verification), fraud investigation, business-to-business content moderation (advertisement monitoring and review, IP infringement, spam reporting, and flagging false and misleading content);
Identity, education, employment, criminal background and social media checks, corporate investigative research, enhanced due diligence, international verification checks, occupational health checks, credit history checks, motor vehicle records checks for Federal Motor Carrier Safety Administration and Department of Transportation compliance;
Annotation solutions (synthetic data management, data quality assurance, text annotation, image annotation, data annotation, video annotation, speech annotation, data extraction and machine learning solutions);
F&A, Procurement, Contact center services, Human Resource Outsourcing (“HRO”) services; |
Revenue operations (lead generation and scrubbing, upper funnel management, subscription management, advertisement sales, digital and print advertisement operations, campaign management, agency and partner support);
Trust and safety (transaction monitoring, vendor and customer due diligence, KYC/AML document verification), fraud investigation
F&A, Procurement, Contact center services, HRO services; |
Content sourcing, content creation, database creation, maintenance and update, aggregation, indexing and tagging, content copy editing and proofing, content enrichment, analysis and product creation, content review and quality assurance, design and production services for digital / print products, advertising operations and order fulfillment, analytics and CRM support;
Legal support, legal and business research, case management, document management, digital dictation transcription, pitch support, patent and trademark searches, contract management, title checking, lease management, company secretarial services, legal transcription and documentation, personal injury litigation support, property law (conveyancing); |
61
Hi-Tech and Professional Services — Service Offerings | ||||
Talent Advisory (Executive Search Firms) |
Strategy and Consulting |
Real Estate and REIT | ||
Search lifecycle support, sourcing, pre-screening, name identification, interview and offer management, pitch book support, business intelligence, industry and company research, database clean-up, update and management, document management, marketing and business development support, talent consulting, contract checks and audits; | Domain-led consulting, decision support services and BPaaS services; we undertake strategic research projects and pitch books creation for consulting firms; we provide consulting support around technology solutions, organization design and workforce, governance, risk and compliance, digital strategy, and data modernization and analytics;
Workforce Management-as-a-Service, an end-to-end workforce management framework to forecast, schedule, monitor and report across the entire organization;
Training-as-a-Service, designed to provide training support to companies in a way that aligns with their operational workflows;
Transition-as-a-Service, supporting clients through all aspects of the transition process such as risk-fit assessment and change management; and
Quality-as-a-Service, enabling clients to achieve superior business outcomes by leveraging a variety of approaches, tools and frameworks, such as process re-engineering, end-to-end process diagnostics, customer satisfaction score and root cause analysis); |
Real estate accounting, lease management, surveying and lettings support, business and financial research, real estate analytics, portfolio and fund accounting, sales and marketing support, end-to-end conveyancing process, contract management and secretarial services. |
62
HCLS
HCLS covers healthcare and life sciences
Healthcare and Life Sciences
We deliver end-to-end BPM solutions across the healthcare and life sciences value chain. We facilitate business transformation through the adoption of new-age digital solutions, data platforms and advanced analytics, business process re-engineering and RPA. Besides seeking to deliver significant cost reduction for our clients, we co-create innovative and high-impact solutions that focus on end customers with a view to enabling value creation. Our solutions are designed to help clients enhance the quality of care by driving improved compliance with clinical pathways and derive deeper insights for better decision-making through advanced analytics.
We are well-positioned in the pharmaceutical and biopharmaceutical industry with research and analytics expertise to support the product lifecycle and commercial operations. We enable our clients to engage in data-driven decision-making by leveraging our proprietary solutions such as PRECIZON (a cloud-based, natural language processing driven fully customizable competitive intelligence platform), Forecasto (a cloud-based self-serve forecasting platform for business planning cycles), GAGE (our self-serve analytics platform specifically designed for pharma), Unified Analytics Platform (a proprietary cloud-based business intelligence self-serve analytics platform), WNS Skense (a proprietary cognitive Gen AI-enabled data capture and contextualization platform), SocioSEER™ (a social media analytics platform), Therapy Area Analyzer (a proprietary therapy area knowledge repository, covering 12 disease areas and 120 indications and providing information on disease etiology, epidemiology and product analysis for 15 countries) and other technology or domain intellectual property (“IP”), which we have built with a view to delivering holistic value to our clients. We have built a strong BPaaS offering, combining domain services and a partner Pharmacovigilance (“PV”) automation solution.
We specialize in enabling the end-to-end sales and marketing value chain with an industry-led talent pool supporting key functions like sales force sizing, sales force effectiveness, market mix modeling, multi-channel marketing and attribution, and next-best-action marketing. Our analytics knowledge center comprises more than 1,200 analytics experts who leverage deep pharmaceutical domain knowledge, strong analytics capabilities and proprietary frameworks to deliver actionable business insights to leading pharmaceutical companies. Supporting our analytics team is a strong group of technical experts skilled across various data-related domains, including platform-agnostic data hosting, curation and governance, data ingestion, visualization and big data feed for advanced analytics.
We seek to create value for our healthcare payer clients, helping them deliver value-based care to their members by driving claims transformation, managing end-to-end clinical programs and delivering claims decision support by leveraging technology and domain to optimize clinical and administrative costs, improve quality and provide superior member and provider experience. For healthcare providers, we deliver clinically empowered revenue cycle management designed to improve financial performance and modernize customer experience. For third-party administrators, we seek to enable high compliance and cost savings through our innovative medical bill review solution, RADAR. Our solution modernizes workflows and leverages analytics, clinical knowledge and domain-backed technology to create an exceptional customer experience that seamlessly engages with providers, payers and patients with a view to delivering value-based care.
Further, we believe we are well-positioned to be a strategic provider, helping the healthcare industry deliver benefits management across several key specialty healthcare areas, including radiology, cardiology, oncology, sleep care, orthopedics and pain management. Our analytics-based medical-content-rules-driven platforms, Consult™ and Protus™, seek to deliver the right care to patients and reduce cost of care for our clients in the process.
As at March 31, 2024, our business unit had 5,759 employees including medical practitioners, registered nurses, pharmacists, healthcare graduates and analytics professionals. In fiscal 2024 and 2023, this business unit accounted for 13.4% and 15.7% of our revenue and 13.8% and 16.6% of our revenue less repair payments (non-GAAP), respectively.
Sub-verticals / Industry Sectors. The key healthcare and life science sub-verticals and industry sectors we serve include:
• | Durable medical equipment manufacturers; |
• | Health insurance companies; |
• | Healthcare provider practices, hospitals and diagnostic centers; |
• | Pharmaceutical, biotech and medical technology companies; and |
• | Third-party administrators. |
63
Service Offerings. We provide the following key areas of services to clients in this business unit:
Healthcare and Life Sciences — Service Offerings | ||||||||
Providers |
Payers |
Durable Medical |
Enterprise Shared Services |
Pharmaceutical and | ||||
Revenue cycle management, medical coding, bill preparation, receivables management, payment posting, debt analysis; | Claims administration, member and provider services, clinical support, Diagnosis Related Groups (DRGs), overpayment recovery, fraud detection and investigation, utilization management services (that is, optimizing payer healthcare spend on areas such as tests and procedures without compromising the patient care-quality-safety norms); | Order management, sales support and complaints, billing and submission, fulfillment support, collections, patient services, collection analytics, reporting and dashboarding, sales force effectiveness; | Finance and accounting, workflow / platforms, research and analytics (knowledge process outsourcing), technology solutions, front-end / mailroom, customer experience / helpdesk services; procurement support; and | Medical affairs, PV medical information helpdesk, scientific communication, patient and healthcare provider experience, competitive intelligence, pipeline analysis, product profiling, forecasting, key performance indicators reporting, epidemiology analysis, market opportunity assessment, social media analysis, key opinion leader research, modeling and tool building support, pricing analytics, patient data analytics, market mix model, big data platform development, data governance, and scientific content development and medical information management. |
Technology Tools / Platforms. We utilize the following technology tools and platforms in delivering services to our clients in this business unit:
• | PRECIZON: A SaaS-based, natural language processing-driven fully customizable competitive intelligence platform; |
• | SocioSEER™: A social media analytics platform; |
• | Unified Analytics Platform: A proprietary cloud-based business intelligence platform; |
• | WNS Forecasto: A cloud-based forecasting platform for business planning cycles; |
• | WNS Gage: A proprietary self-serve analytics platform, with pre-built key performance indicators (“KPIs”), designed for pharmaceutical companies; |
• | Therapy Area Analyzer: A proprietary therapy area knowledge repository; |
• | Consult™: A clinical decision support technology platform; |
• | TrackBox: A proprietary workflow management solution; and |
• | WNS Skense: A proprietary cognitive Gen AI-enabled data capture and contextualization platform, powered by AI and ML techniques, which extracts data from multiple unstructured and structured sources without the need for an input template / rule-based set-up. It presents the contextualized information in a structured, usable format. |
64
BFSI
BFSI covers banking and financial services, and insurance.
Banking and Financial Services
Our banking and financial services practice supports more than 35 leading clients, including large commercial and retail banks, wholesale and retail lenders, wealth advisors, asset managers, investment banks, private equity firms, hedge funds, financial technology (or commonly referred to as FinTech) organizations and mortgage servicing companies, with a comprehensive suite of BPM and transformation solutions.
We seek to add value to our clients’ businesses by improving customer experience, unlocking cost efficiencies and revenue opportunities, streamlining processes, and leveraging a wide range of process re-engineering, automation (robotic and non-robotic), and digital and advanced analytics (AI/ML as well as Gen AIML) solutions.
As at March 31, 2024, we had 4,641 employees working in this business unit. In fiscal 2024 and 2023, this business unit accounted for 8.1% and 6.7% of our revenue, and 8.3% and 7.1% of our revenue less repair payments (non-GAAP), respectively.
Sub-verticals/Industry Sectors – The key banking and financial services sub-verticals and industry sectors we serve include:
• | Retail and commercial banking; |
• | Mortgage and loans; |
• | Wealth and investment banking; |
• | Financial technology; |
• | Asset management; |
• | Financial advisory firms; |
• | Financial research and financial market intelligence companies; |
• | Trade finance; and |
• | Private equity and hedge funds. |
Service Offerings – We provide the following key areas of services to clients in this business unit:
Banking and Financial Services — Service Offerings | ||||||
Retail Banking |
Commercial Banking |
Capital Markets |
Mortgage | |||
On-boarding: Application processing, document review and verification, KYC and customer due diligence, underwriting, spend limit, payments checks, cards and remittance, fraud management, disputes and chargebacks, default management;
Servicing: Maintenance, account closure, amendment/liquidation of deposits, bereavement, customer support, transaction processing, complaints and disputes handling,, fraud detection and management, chargebacks, AML transaction monitoring, client screening and payment screening (sanctions);
Bancassurance: Application verification, suitability verification, payment and issuance, clawback/withdrawals, lapsed policy issuance, commission reconciliation; |
On-boarding: Application processing, KYC/ultimate beneficial owner verification, MOA partnership, auth-signatory validation, client screening and payment screening (sanctions);
Servicing: Maintenance, account closure, amendment/liquidation of CDs;
Credit Risk: Credit analysis, probability of default/loss given default, financial statement spreading, risk grading support;
Loan Closing and documentation: Due-diligence, limit setup, collateral setup, documentation, booking, funding, closing and post close review;
Operations: Collateral management, covenant monitoring, renewals, annual reviews, settlement, rollovers, billing, limit monitoring, amendments and settlements;
Cash Management: Funds transfer, Nostro/Vostro (these terms are used with reference to one bank maintaining money at another bank), reconciliation, lockbox payment processing, payroll processing, AML transaction monitoring;
Trade Finance: Letter of credit issuance; document collection, acceptance and payments, export bills negotiations, guarantees, financing, bank guarantee issuance and amendment, bill discounting, receivables, pre and post shipment finance, customer service, trade-based money laundering support; |
Front Office: Sales and marketing support, lead generation;
Client onboarding, KYC/AML screening, customer services and maintenance, account administration;
Middle Office: Portfolio management, risk and compliance, performance measurement and attribution, client reporting, regulatory reporting, trade support- confirmation and allocations, pre-matching and settlements;
Back Office: Reconciliation, fund accounting, shadow accounting, client billing, reference data management, security master and corporate actions; |
Origination: Application processing, pre-underwriting, underwriting QC, conditions management, clear-to-close reviews, closing support, pre-funding QC, post-close audit, Pre-purchase audit for retail, consumer direct loans and correspondent loans;
Servicing: Loan boarding and administration, remittances, escrow analysis, investor accounting and reporting, lien release and payoffs, customer service, credit reporting, complaints handling;
Default Management: Loss mitigation workouts, foreclosure support, borrower research, loan modification, forbearance support, early stage collections;
Secondary Market: Trailing doc follow-up, pre-purchase audit, forensic and non-forensic audit; |
65
Banking and Financial Services — Service Offerings | ||||||
Fintech |
Enterprise Shared Services |
Research and Analytics | ||||
Application processing: support/helpdesk, customer service, complaints handling, customer screening, transaction monitoring, fraud management and chargebacks, operations advisory and transformation consulting services, regulatory and compliance support, KYC and AML screening; | Finance and accounting: accounts payable, travel and expenses management, general ledger, budgeting and forecasting, financial planning and analysis, reporting, capital management support, asset liability management;
Sourcing and Procurement: Strategic sourcing, category management, contract management, spend analytics, transactional procurement; vendor management; and |
Financial research and modeling: market and industry research, macro-economic research, investment screening and thematic research, quantitative research, ESG overlays, equity research, credit research, Equity Capital Markets (ECM)/ Debt Capital Markets (DCM) research, pitchbook support, fraud analytics, model risk management. |
Technology Tools/Platforms – We utilize the following technology tools and platforms in delivering services to our clients in this business unit:
• | Unified work Orchestration Platform – An integrated workflow layer on top of existing platforms to streamline operations |
• | Card dispute management system: A cards chargebacks and disputes management solution to help banks handle card-related disputes; |
KYC customer lifecycle management – Workflow solution to address the KYC lifecycle management;
• | Mortgage-as-a-Service – Integrated solution to process mortgage origination operations leveraging a digital platform with pre-configured RPA/AI Bots; |
• | Financial researcher – Gen AI powered solutions for automating financial research tasks; |
• | TrustHall – Hyperautomation-powered solutions for contract management in the area of capital markets and beyond; |
• | ESGHall – Hyperautomation-powered solutions for managing compliance with ESG imperatives and reporting thereon; |
• | Connected compliance – Hyperautomation-powered solution for compliance tracking and reporting; |
• | Delinquency management – A loan delinquency and collections management platform; |
• | Loan management solutions – Hyperautomation-powered solution to manage retail and commercial lending; |
AI/ML and Gen AI powered solutions
Gen AI- adverse news screening – Gen AI-based solution with an un-biased summarization of search results, sentiments and relevant score;
• | KYC (ultimate beneficial owner) Accelerator – RPA-powered solution to automate KYC tasks associated with detection of ultimate beneficial owners |
• | Knowra+ – Gen AI-based agent assist solution facilitating faster resolution of queries from high net worth individuals and retail investors |
• | Gen AI Response Interface – Email extraction and summarization solution powered by Gen AI |
• | Skense Credit – An AI-based financial statement spreading tool. |
66
Insurance
Our insurance services are structured into multiple lines of business and cater to a diverse and sizeable number of clients globally. We offer industry-specific and cross-industry solutions combining our deep industry knowledge with automation, digital technology, analytics and process expertise to co-create digitally enabled transformational solutions.
Our solutions span the end-to-end insurance value chain for life, annuity and general insurers, brokers, loss adjusters, syndicates and managing general agents (“MGA”) in the Lloyd’s of London market space. Our services include new business and policy administration services, underwriting support and delegated underwriting, actuarial services, end-to-end claims management, finance and accounting, customer experience management, analytics and transformation services. Our service models provide go-to-market solutions for back-office support, customer experience services, capabilities for new product introductions and sales enablement.
Historically, our insurance vertical grew as we opened delivery centers in new geographies and expanded our digital footprint with new solutions. We have invested in co-creation labs and digital transformation practices to develop end-to-end modularized digital solutions. These solutions leverage hyperautomation, robotics, cognitive automation, advanced analytics, AI, blockchain and IoT.
Some of our recent initiatives include:
• | Setting up an office in Lloyd’s of London – a first for any BPM company |
• | Setting up an insurance service delivery center in Malaysia (in Kuala Lumpur) |
• | Enhancing the scope of our solutions by adding travel claims processes and complex actuarial services, such as IFRS17 implementation support and pricing support activities |
• | Launching our first claims subrogation product in the market – Subrogation-as-a-Service – enabling insurers to handle end-to-end subrogation |
• | Establishing licensed capabilities in P&C sales and service in North America |
• | Offering WNS InVog (Insurance-in-a-Box) – a target operating model designed to provide insurers with the combined advantage of technology platforms and BPaaS – to a diversified portfolio of clients, especially in the Lloyd’s of London market and covering a spectrum of syndicates, MGAs and brokers |
As at March 31, 2024, we had 13,074 employees working in this business unit. In fiscal 2024 and 2023, this business unit accounted for 27.3% and 26.8% of our revenue, and 25.1% and 22.9% of our revenue less repair payments (non-GAAP), respectively.
Sub-verticals / Industry Sectors. The key insurance sub-verticals and industry sectors we serve include:
• | Life insurance, pensions and annuity providers; |
• | Property and casualty insurance providers; |
• | Reinsurers; |
• | Insurance and reinsurance brokers; |
• | Loss assessors; and |
• | Lloyd’s of London market syndicates, MGAs, coverholders and brokers. |
Service Offerings. We provide the following key areas of services to clients in this business unit:
Insurance — Service Offerings | ||||||||
Operations |
Actuarial Services |
Enterprise Shared Services |
Research and Analytics |
Customer Experience | ||||
Underwriting support and delegated underwriting, supply chain, claims management, policy administration, risk and compliance, premium / billing management, mailroom operations, contract issuance/ change management, channel management and reinsurance services; | In-force model projections / reporting, financial modeling, product management and pricing, capital management, asset-liability management, reserving and claims analysis, solvency II (a regulatory framework applicable to insurance companies) and capital modeling, pricing and underwriting support, and catastrophe modeling, IFRS17 implementation support; | Finance and accounting, technology support, HR and payroll, and consulting services;
Sourcing and procurement (strategic sourcing, category management, contract management, spending analytics and transactional procurement);
Platform consulting and implementation support, consulting and transformation services (automation, business process re-engineering and digital); |
Claims analytics, subrogation and recovery analytics, fraud analytics, customer analytics, broker analytics, underwriting analytics, reserve estimation, risk selection and analytics, speech analytics, pricing analytics, data mining and management services, reporting, dashboarding and visualization, data science and predictive modeling across claims, and claims liability decision tool; and | Sales and service, customer analytics, customer inquiry management and customer information administration across multiple communication channels including chat, voice and email. |
67
Technology Tools / Platforms. We utilize the following proprietary and partnership-driven digital solutions to deliver services to our clients in this business unit:
• | WNS EXPIRIUS microservices, which include: |
• | EXPIRIUS ConverseEX – a conversational cognitive self-serve solution; |
• | EXPIRIUS CloudServEX – an omni-channel cloud Contact Center-as-a-Service offering; |
• | EXPIRIUS AssistEX – a proactive and real-time agent assistance solution with automation and a knowledge management system; |
• | EXPIRIUS TranslateEX – a real-time language translation solution; |
• | EXPIRIUS EngageEX – a workforce engagement suite; |
• | EXPIRIUS RemoteEX – user monitoring for security and compliance; |
• | EXPIRIUS ElevateEX – comprehensive customer insights and integrated Analytics-as-a-Service; and |
• | EXPIRIUS JourneyEX – a customer journey discovery and orchestration solution. |
• | Complaint Assist: A Gen AI-enabled solution for effective tracking, monitoring and management of complaints, with the objective of minimizing the risk of regulatory breaches; |
• | Straight through processing (“STP”) solution: Facilitating STP of claims from lodgment to customer fulfillment for motor and travel product lines, this Gen AI-enabled solution is deployed in partnership with: |
• | Rightindem – An orchestration engine that enables integration of different technological capabilities across the claims value chain combined with an electronic notification-of-loss feature for reporting motor and property claims in a conversational style; |
• | Formotiv – Designed to provide digital behavioral data and intent scores to enable intuitive and personalized digital experiences; |
• | Attestiv – A solution designed to authenticate digital media captured by any person or device using AI and blockchain; |
• | Inspekt Labs – A solution for damage detection using computer vision technology, eliminating the need for physical inspections; |
• | Verisk: A tool for intelligent and versatile liability assessment and first notice of loss (“FNOL”) decision-making; |
• | Digital underwriting workbench: An end-to-end workflow with rules, real-time reports, dashboards and a unified view of data, enabling enhanced controls and STP, this workbench also seeks to provide data-based insights for better decision-making in pricing and underwriting risks; |
• | HIFFI: A one-touch home insurance quote-to-buy solution; |
• | Credit hire and bodily injury solution: End-to-end simplification of credit hire and bodily injury claims with the objective of optimizing third-party spend and mitigate litigation and regulatory risks; |
• | eAdjudicator: This automates the end-to-end claims adjudication process, real-time operations and business dashboards; |
• | WNS Skense: A proprietary cognitive data capture and contextualization platform, that leverages Gen AI and ML technologies to extract data from complex and unstructured sources using LLMs; it presents the contextualized information in a structured, usable format; |
• | Messenger Connect: This allows a customer to instantly lodge a claim anytime from anywhere through a convenient messenger medium, such as WhatsApp and short message service (“SMS”); |
68
• | E-FNOL: A self-service app for registering claims and follow-ups; |
• | Underwriting Pricing Accelerator: Advanced analytics integrated with an AI-based pricing engine for commercial decisions relating to policy underwriting, including insights from cross-selling, premium calculation, profitability and probability modeling, and risk scoring; |
• | Unified Analytics Platform (“UAP”): A cloud-based, modular platform combining data management, domain analytics and proprietary pre-built industry-specific AI / ML models to deliver different analytics interventions across the claims and underwriting value chain, such as fraud detection, propensity modelling, total loss prediction, etc.; |
• | Subrogation-as-a-Service: An end-to-end subrogation technology-cum-services suite for auto and property claims that covers Gen AI-based liability evaluation, demand preparation and recovery chasing across different service lines, such as insured subrogation, uninsured motorist, medical recoveries, adverse subrogation, litigation and arbitration management; |
• | Annuity Universe: This solution offers real-time recommendations for strategic decision-making of annuities businesses through multidimensional analysis of large data from products and customers segmented by country, customer likeability, age, income and premium; |
• | Claims Lodgment Intelli-bot: An e-mail-based automation claims lodgment and adjudication solution; |
• | Device Protection Knowledge Graph: A solution for InsurTech clients to establish the relationship between multiple datasets to provide effective device protection service; and |
• | Ondo: A claims prevention solution that aims to reduce the frequency and severity of water damage claims. |
69
Horizontal Units
Finance and Accounting
Our finance and accounting services encompassing an array of end-to-end industry-specific and cross-industry solutions are powered by deep domain knowledge, data-to-insights capabilities and digital innovation. We seek to drive end-to-end finance transformation leveraging hyperautomation, AI-driven solutions like Gen AI, cognitive computing, natural language processing, ML, blockchain, IoT, BPaaS platforms, embedded analytics and process re-engineering frameworks.
As at March 31, 2024, we had 8,691 employees in this horizontal unit. In fiscal 2024 and 2023, this horizontal unit accounted for 21.5% and 23.0% of our revenue, and 22.2% and 24.3% of our revenue less repair payments (non-GAAP), respectively.
Sub-vertical / Industry Sectors. The key industry sectors we serve include:
• | Retail and CPG; |
• | Insurance; |
• | Energy and utilities; |
• | Healthcare and Life Sciences; |
• | Media and entertainment; |
• | Banking and financial services; |
• | Telecom; |
• | Manufacturing; |
• | Shipping and logistics; |
• | Travel and leisure; |
• | Hi-tech and professional services; and |
• | Other emerging industries. |
Service Offerings. We provide the following key areas of services to clients in this horizontal unit:
Finance and Accounting — Service Offerings | ||||||
Source-to-Pay |
Quote-to-Sustain |
Record-to-Report |
Decision Support | |||
Sourcing to Contract: Sourcing and supplier relationship management;
Procurement: Procurement operations;
Invoice to Pay: Document management, invoice processing and reporting, purchasing card and travel expense claims processing, payment remittances and accounts payable enquiries;
Miscellaneous activities and month-end close; |
Quote-to-Order: Customer master data, credit management and customer contract management;
Order-to-Bill: Customer order management and customer billing management;
Bill-to-Cash: Collections and dispute management, and cash application and customer deduction management;
Report-to-Sustain: Customer request and inquiries, reports and analytics dashboards, and perform revenue assurance; |
Record: Master data management, bookkeeping, cash and bank transactions, fixed assets, intercompany and general accounting;
Close and Consolidation Report: Financial reporting, statutory reporting,, regulatory reporting and taxation; |
Budgeting, forecasting, variance analysis and management reporting; Decision support analysis, financial modeling, dashboarding and analytics |
70
Finance and Accounting — Service Offerings | ||||||
Corporate Functions |
Supply Chain Finance |
Governance, Risk, Compliance and |
Industry-specific Accounting | |||
Treasury, cash management, financial planning and analysis, tax and compliance, decision support and management accounting; | Product costing, inventory accounting, manufacturing accounting, supply chain analytics and supply chain fulfillment support; | Governance consulting, risk analytics services, compliance services and audit services; and | Passenger revenue accounting, revenue audit and recovery, land commission reconciliation, claims management, loan account maintenance, royalty accounting, actuarial, fiduciary accounting, trip records, freight and fuel charges accounting, cost accounting, franchise accounting, meter reading, pre-payment billing and disbursement accounting. |
WNS CFO Advisory Services: We seek to deliver to our clients innovative transformation solutions focused on facilitating their progression along the maturity curve across process, technology and analytical interventions. Our pool of consultants seeks to help customers achieve this through varied advisory service offerings, enabling value creation for the CFO and organization. These advisory services are primarily classified into:
• |
Target Operating Model: An assessment of operating, process, technology and governance models utilizing the “Outperforming CFO Framework”, a best practices-enabled framework with toolkits for assessment and digital enablement, designed to create transformation roadmaps and enhance process optimization; |
• |
Operational Excellence: A service focusing on CoE creation and process maturity modeling, including benchmarking, business process reengineering, performance management and process mining; |
• |
Finance Modernization: An extensive landscape of proprietary and partner solutions focused on intelligent automation, hyperautomation, implementation and optimization support for bolt-on solutions, platforms, enterprise resource platforms (ERPs) and enterprise performance management rollout. The following is a list of key proprietary solutions: |
• |
WNS eClose: A workflow solution for streamlining the period-end close process; |
• |
WNS RecTRAC: A workflow solution with a checklist for automatic reconciliation tracking, processing and validation; |
• |
WNS JE TRAC: A Journal Entry Advisor hyperautomation app that is an end-to-end journal entry solution to analyze input files, prepare journals, identify anomalies in postings, track approval and post journals in the ERP; |
• |
AP TRAC: An end-to-end accounts payable invoice processing and workflow solution; |
• |
WNS TrackPoint Pro: A web-based case management tool; and |
• |
F&A TRAC: An e-forms and workflow solution that can be utilized in multiple F&A processes across source-to-pay, quote-to-sustain and record-to-report. |
71
• |
Finance Analytics: This includes FIAB, a proprietary suite of advanced analytics offerings for CFOs, to generate insights and aid in decision-making with enhanced visibility and control. The following are the primary applications under FIAB: |
• |
WNS Vizonar.ai FP&A Analyst Console: Generative AI-powered report generation application designed to generate comprehensive reports from extensive textual and numeric data, primarily comprising financial information. It generates comprehensive reports, including a complete financial dashboard overview, historical data summaries, impact analysis, news article analysis, comparative financial analysis, and interactive chatbot, saving time and resources; |
• |
Journal Entry Analytics Platform: An app based on advanced statistical models, designed to transform how controllership works; |
• |
enC@SH: Working capital enhancement through advanced AP analytics and a range of simulators for “what-if” analysis; provides a prioritized list of opportunities to enhance liquidity and bottom-line impact; |
• |
DoppelSkanner: A nimble and non-intrusive universal duplicate detection application with multiple cutting-edge features such as fuzzy matching (a technique that provides improved ability to process word-based matching queries to find matching phrases or sentences from a database), phonetic matching and user customizable strictness; |
• |
WNS Sentry: automating quality audit combining analytics, and proprietary algorithms to identify processing errors upfront to aid improvement in posting accuracy; |
• |
WNS Forecaster: advanced time series forecasting models for planning purposes; |
• |
WNS Predictor: automating predictive modeling to improve usage by non-data-scientists; and |
• | WNS Risk and Audit Analytics: A risk and audit analytics application designed to identify the right set of audit targets from accounts payable invoices and travel and expense claims using a range of intelligent statistical and forensic methods. |
• | Compliance and Control: This includes process controls framework design, Sarbanes-Oxley Act-related controls (design, testing and reporting), internal audit support and accounting standards change support (for example, for IFRS 17 implementation and US GAAP long duration targeted improvements). Our GRC program is focused on working towards streamlining, optimization and generating Intelligent insights to enhance and enrich the transformation journey for our clients. |
72
Customer Experience Services
Our digital CX services are enabled by our proprietary solution WNS EXPIRIUS, powered by Gen AI, which integrates human-assisted design and domain expertise with conversational insights and CX consulting-led strategies to create a holistic customer experience.
The EXPIRIUS model comprises eight modular solutions, or microservices, which are all focused on achieving return on investment. These solutions have been designed to meet the specific CX demands of businesses powered through consulting and CoEs, which enable us to deliver smart digital solutions around sales, fulfillment, collections, omni-channel services and more. Our global network of WNS Co-creation Labs leverages a human-centered approach to support the design and delivery of digital CX services.
As at March 31, 2024, we had 16,011 employees in this horizontal unit. In fiscal 2024 and 2023, this horizontal unit accounted for 20.2% and 19.4% of our revenue, and 20.8% and 20.4% of our revenue less repair payments (non-GAAP), respectively.
Sub-verticals / Sectors. The key industry sectors we serve include:
• |
Healthcare and life sciences; |
• |
Manufacturing; |
• |
Retail and CPG; |
• |
Shipping and logistics; |
• |
Banking and financial services; |
• |
Insurance; |
• |
Travel and leisure; |
• |
Procurement; |
• |
Utilities; and |
• |
Hi-Tech and professional services. |
Service Offerings. We provide the following key areas of services to clients in this horizontal unit:
Customer Experience Services — Service Offerings | ||||||
Customer Experience Consulting |
Centers of Excellence |
Digital Transformation |
Engagement Models | |||
Cutting-edge technology, proven methodologies and frameworks, and human-assisted solutions;
Expertise across CX initial state assessment, customer journey mapping, customer interaction analytics, omnichannel engagement and hyper-personalized solutions, customer analysis, intelligent automation; |
WNS’ industry-contextualized CoEs combine domain experts with WNS EXPIRIUS;
Four CoEs: WNS Sales CoE (A “Sales + Service” bundled offering designed to transform order-taking contact centers to revenue-generating profit centers), WNS Fulfillment CoE (designed to enable seamless, omni-channel, and unified fulfillment experiences through a digital and analytics driven approach), WNS Assisted Digital Channels CoE (leverages an integrated omni-channel contact strategy, underpinned by AI, cognitive and analytical solutions), and WNS’ Smart Collections CoE (one-stop shop solution for all challenges faced by our clients in debt management, including redefining debt strategy, consulting-driven approach towards improving collections metrics, collections analytics and performance management; |
WNS’ Digital Transformation team is designed to ideate, curate, recommend and deploy disruptive and transformative initiatives for our clients and prospects. These transformation initiatives are domain-agnostic and cover facets including CX / NPS improvement, sales and revenue uplift, digital adoption of end customers, reducing cost of operations and enriching user experience; | This offering has different contact center functions and provides them as a service to our clients, i.e., Quality-as-a-Service (“QaaS”) and WFM-as-a-Service. QaaS is an offering by which WNS provides staff augmentation to its clients by extending its robust quality management framework. WNS has extensive experience in managing the WFM practices of its clients, right from volume forecasting till managing real-time adherence. |
73
Technology Tools / Platforms. We utilize the following technology tools and platforms in delivering services to our clients in this horizontal unit:
• | WNS EXPIRIUS Framework: WNS EXPIRIUS is a unique CX solution that integrates human-assisted design and domain expertise with Gen AI-driven conversational insights and CX consulting-led strategies to create a holistic digital customer experience. We collaborate with leading enterprise platform providers, CX technology players, original equipment manufacturers, in-house technology experts and analytics specialists to co-create domain-specific solutions leveraging the right digital infrastructure. As a result, under the EXPIRIUS umbrella, we have created a toolkit of bolt-on microservices, which can be adopted by clients to complement their existing digital CX landscape and deliver business outcomes. |
• | EXPIRIUS ConverseEX enables businesses to design the right contact strategy — from messaging bots to conversational interfaces across channels — to intelligently act on customer intent in a human-like manner by leveraging AI/Gen AI capabilities; |
• | EXPIRIUS CloudServEX enables anytime, anywhere omni-channel contact center access with on-demand scalability and business continuity; |
• | EXPIRIUS AssistEX empowers contact center agents to drive meaningful interactions with customers through real-time guidance for improved brand experience. WNS has curated pointed solutions leveraging Gen AI to enable agents with the most appropriate response/resolution for a particular query, as well as be able to aptly summarize interactions; |
• | EXPIRIUS TranslateEX provides instant support across all languages on digital channels via real-time language translation, and is supported by human curation to deliver native-speaker proficiency; |
• | EXPIRIUS EngageEX leverages a compendium of best-in-class practices for operational oversight, delivered through AI-powered business performance dashboards and intelligent workforce management supporting agile delivery models. As part of this micro-service, WNS has built solutions to address robust training and self-coaching needs using AI capabilities that improves agents’ adaptation timeline as well as empowers contact center trainers to be more effective; |
• | EXPIRIUS RemoteEX strengthens the remote work environment beyond data and workstation security by leveraging AI and analytics for operational oversight, security and compliance; |
• | EXPIRIUS ElevateEX provides a “single source of truth” through intelligent conversation mining across channels, VoC analytics and AI-based custom predictive models with pre-defined lexicons, enabling faster decision-making for change managers in driving relevant transformation initiatives; and |
• | EXPIRIUS JourneyEX leverages customer touchpoints (across self-service and assisted service channels) to hyper-personalize journeys in real time, derive actionable insights, and tailor an optimum contact strategy for a true omni-channel customer experience. |
We have successfully initiated new capabilities across the customer interaction lifecycle with:
• | Gen AI enabled E2E email management tools for corporate travelers: Currently under development, an intuitive platform that encompasses functionalities across the length and breadth of the travel customer journey. This platform is powered by Gen AI to accomplish the following: |
• | Conversational interface with customers with contextual responses |
• | Automated workflows for email management, process orchestration and exceptions |
• | Automating complex business process around re-booking |
• | Proactive notifications relevant to the industry scenarios |
• | Analytics-driven customer profiling (Customer 360) |
• | Hyper-personalization around preferred recommendations |
74
• | Digitally Simulated Training Environment & AI-Coach: An intelligent training solution that drives engaging and video simulation led experiential learning and development resulting in a shortened learning curve and increased adaptability of new hires. This is complemented with an AI-enabled training “coach” that has the flexibility of modularizing complex customer conversations with best responses to improve CX/NPS and other key contact center metrics including sales & revenue uplift. We have started deploying this solution. |
• | Knowra+ - empowers contact center agents to drive meaningful interactions with customers through real-time guidance for improved user experience. This tool has: |
• | Virtual SME Bot - Agent facing conversational bot and knowledge portal that allows agents to ask process related questions mapped with specific responses or redirection links |
• | Guided Workflow - Live decision tree that provides step by step guidance to agents (based on manual inputs or automatically derived intents) and includes smart decision-making through integration and attended desktop automation |
• | After-call Work Automation - Automatically captures call notes in a predefined template which is presented to the agent for review. Optionally update back-end systems or execute a task through APIs / desktop automation |
WNS Triange
WNS Triange seeks to deliver business growth and innovation with AI, analytics, data and research for 200+ global companies. With a specialized team of over 6,000 analysts, data scientists, data engineers and domain experts, WNS Triange aims to translate data into insights for improved decision-making. Comprising three core pillars, namely Triange Consult (the consulting arm), Triange NxT (with AI-led proprietary platforms powered by Gen AI) and Triange CoE (the domain and technology arm), WNS Triange seeks to seamlessly blend strategy, industry-specific needs, AI and ML operations, and intelligent cloud platforms.
With deep domain understanding across industries as the foundation, WNS Triange aims to help businesses ask the right questions to accurately identify all the critical challenges, strategize on clear goals, translate them to impactful actions and achieve desired outcomes at speed and scale.
WNS Triange’s modular cloud-based platforms and solutions employ advanced AI and ML to enable end-to-end data integration and processing in order to generate actionable insights. WNS Triange leverages the combined strength of domain expertise, co-creation labs, strategic partnerships and outcomes-based engagement models.
As at March 31, 2024, we had 3,811 employees in this horizontal unit. In fiscal 2024 and 2023, this horizontal unit accounted for 12.4% and 10.8% of our revenue, and 12.7% and 11.3% of our revenue less repair payments (non-GAAP), respectively.
Sub-vertical / Industry Sectors. The key research and analytics sub-verticals we serve include:
• | Manufacturing; |
• | Retail and CPG; |
• | Banking and financial services; |
• | Insurance; |
• | Healthcare and Life Sciences; |
• | Travel and leisure; |
• | Utilities; and |
• | Other emerging industries. |
75
Service Offerings. We provide the following key areas of services to clients in this horizontal unit:
WNS Triange – Service Offerings | ||||
Triange Consult |
Triange NxT |
Triange CoE | ||
Triange Consult seeks to accelerate data-driven digital transformation for clients, enabling them to become insights-led enterprises through our consulting expertise, frameworks and transformation roadmaps; Triange Consult offer toolkits across industry vertical for comprehensive roadmaps, gap analyses, change management, and governing standards and processes to help organizations attain their analytics goals; Triange Consult’s design thinking-led co-creation approach and comprehensive frameworks deliver data-driven transformation roadmaps for organizations in different areas; | Triange NxT adopts an AI-led platform approach leveraging domain expertise and intelligent cloud-based capabilities to drive business value at scale and achieve faster time-to-market for enterprises; It deploys proprietary pre-trained industry-specific AI / ML models customized to organizational requirements; Triange NxT platforms are now enabled with Gen AI capabilities to deliver superior business outcomes to clients;
Key Triange NxT offerings include Unified Analytics Platform (used across industries such as insurance, manufacturing and retail and CPG) and WNS Skense;
With a cloud-first approach, Triange NxT platforms seek to contribute to sustainability from development to deployment; by applying Infrastructure-as-Code and optimally designed ML models, Triange NxT aims to ensure energy savings for our clients; our platforms’ well-architected framework for workload sustainability aligns with principles of green software; the design principles of sustainable workloads help in optimal usage of computing resources and energy consumption; adoption of cloud technologies from Azure, GCP and AWS ensures the implementation of green software philosophy; Triange NxT’s AI / ML models are built using responsible AI frameworks, covering principles such as inclusivity and non-discrimination, reliability and safety, privacy, security, transparency, explainability and accountability; and |
Triange CoE combines industry and domain expertise, AI assets, intelligent cloud offerings, frameworks, best practices and strategic partnerships to modernize enterprise data landscape and accelerate our clients’ digital transformation; Triange CoE drives the end-to-end execution of industry-specific analytics programs that fuel AI-led transformation across the value chain in outcome-based engagement models. |
76
Technology Tools / Platforms. Some of the key platform-driven offerings that are part of Triange NxT include:
• | Unified Analytics Platform (“UAP”): This is our cloud-based, modular platform combining data management, domain analytics and proprietary pre-built industry-specific AI / ML models. Apart from Gen AI integration, UAP features cloud-agnostic architecture, cognitive analytics, democratized analytics, flexible deployment, plug-and-play architecture, seamlessly integrated user experience and 360-degree view for all business users. The platform includes: |
• | UAP Insurance: This AI-based end-to-end platform for insurance combines data management, insurance domain analytics and proprietary, pre-built AI / ML models integrated with Gen AI. The platform hosts pre-built insurance-specific modules, such as Claims, Pricing, Underwriting and Fraud, and Bordereaux management, as well as domain-agnostic modules such as Customer and Sales & Marketing; |
• | UAP Demand Planning: This AI-led platform seeks to build optimal demand planning for manufacturing and CPG industries; |
• | UAP Market Mix Model: This AI-led platform seeks to optimize marketing spends across channel to maximize return on investment; |
• | InsighTRAC: This AI-led procurement analytics platform tracks spends and identifies savings opportunities; |
• | PRECIZON: This SaaS-based pharmaceutical competitive intelligence solution is powered by WNS’ deep therapeutic expertise and an AI / ML-enabled platform; |
• | Forecasto: This is a customized online platform that supports forecasting across the product lifecycle – pre-launch, launch and in-line – and underpins key processes, such as strategic planning, long-range forecasting and budgeting, designed to reduce TAT during stakeholder alignment and consensus building; |
• | SocioSEER™: This is a social media analytics platform; |
• | Sentinel: This AI-led tracking tool is meant for early identification of trends for new product development; |
• | Darwin: A workflow management tool; and |
• | WNS Skense: This is an enterprise-grade cognitive data capture and processing platform underpinned by AI and ML to drive business outcomes. WNS Skense uses 40+ proprietary pre-built domain-specific AI models to extract and contextualize data from unstructured industry-specific sources. It harnesses LLMs as well as domain-specific AI models – such as Skense for insurance, Skense for cargo, Skense for banking and financial services, Skense for healthcare (clinical summarization) and Skense for procurement – adapting them to the unique requirements of diverse sectors. WNS Skense is available on the Azure marketplace and is an AWS Partner Qualified Software based on foundational technical review assessments. |
77
Technology Services
Our technology strategy for clients has been to leverage established and emerging technologies to re-define existing business models, embed process intelligence and automation into business operations, and drive organizational agility through scalable and integrated solutions and services.
At the core of our technology strategy is “WNS TRAC ®,” which is a consolidated suite of comprehensive digital BPM solutions. It combines the strengths of deep domain and technology expertise, a global partner ecosystem and end-to-end service provisioning (from consulting / advisory to implementation, support and managed services).
WNS TRAC ® solutions are pre-configured with best practices and industrialized accelerators designed to drive development and adoption of cloud-native applications, intelligent automation, AI/ML and Gen AI-led solutions – with a host of deployment options and commercial models to choose from. Available as all-inclusive BPaaS or plug-and-play solutions that are designed to seamlessly integrate with clients’ existing technology environment, our digital solutions seek to drive transformation for today’s anytime-anywhere consumers.
WNS-Vuram is WNS’ hyperautomation division. Its strategy is to combine domain expertise with technological prowess to build industry-specific and industry-agnostic hyperautomation platforms and solutions to drive business outcome for clients. WNS-Vuram seeks to offer end-to-end integrated services across process discovery/mining, intelligent document processing, intelligent business process management software and low-code capabilities, and RPA/intelligent automation. It aims to provide sustainable automation to customers – either as a bundled BPaaS offering integrating with the client’s technology landscape or as independent plug-and-play solutions – through:
1. | End-to-end hyperautomation offerings covering consulting and advisory services, CoE design and setup, and full lifecycle implementation and managed services; |
2. | Building industry-specific hyperautomation platforms and solutions that incorporate Gen AI together with intelligent automation technologies for seamless end-to-end automation workflows; |
3. | Partnerships with technology product- and platform-providers to co-create solutions and joint go-to-market capabilities; and |
4. | Building a talent pool for digital-era businesses through a citizen developer program and continuous focus on training and upskilling. |
As at March 31, 2024, we had 1,345 employees in this horizontal unit. In fiscal 2024 and 2023, this horizontal unit accounted for 4.9% and 3.7% of our revenue, and 5.1% and 3.9% of our revenue less repair payments (non-GAAP), respectively.
Sub-verticals / Industry Sectors. The key industry sectors we serve include:
• | Travel and leisure; |
• | Shipping and logistics; |
• | Utilities; |
• | Manufacturing; |
• | Retail and CPG; |
• | Hi-tech and professional services; |
• | Procurement; |
• | Healthcare and Life Sciences; |
• | Banking and financial services; and |
• | Insurance |
78
Industry-specific Technology Tools / Platforms. We utilize the following industry-specific technology tools and platforms in delivering services to our clients in this horizontal unit:
• | Travel TRAC |
• | Verifare Plus 3.0SM: An automated, analytics-enabled and web-based fare audit solution on cloud, designed to enable airlines to maximize revenue recovery and minimize revenue leakage; |
• | QbaySM: An automated, cloud-hosted workflow management platform designed to manage back-office operations across centers and geographies, minimize costs and enhance customer service; |
• | ; |
• | BIDT Audit: An automated, cloud-hosted revenue integrity platform for the audit and recovery of any revenue losses resulting from non-compliance in travel agency bookings. |
• | Insurance TRAC |
• | WNS InVog (Insurance-in-a-Box Solution): A target operating model designed to provide insurers with the combined advantage of technology platforms and BPaaS; |
• | Claimonix: An auto claims management solution with claims reporting and repair management capabilities suited for small and mid-tier carriers; |
• | Underwriting Workbench: An end-to-end process management solution to help underwriters access relevant data quickly and for efficient decision-making; |
• | Claims STP: Claims STP is a suite of solutions designed to transform the end-to-end P&C claims management landscape with insurtech next-gen solutions, market intelligence and future-ready talent. |
• | Banking and Financial Services TRAC |
• | Client Onboarding: This complete solution for onboarding clients in both retail and corporate banks includes KYC checks and identity verification; and |
• | Card Dispute Management: This automates and streamlines the entire dispute cycle starting from dispute request through chargeback workflow to processing incoming chargeback requests. |
• | Shipping and Logistics TRAC |
• | WNS Malkom: A freight automation platform, underpinned by ML, designed to automate the end-to-end bill of lading and customs invoicing process; and |
• | WNS CollecTRAC: A re-usable collections bot that may be used as a plug-and-play solution or one that is ready-to-integrate with customer-specific portals and enterprise applications, designed to improve aging AR and turnaround time (“TAT”) for dispute resolution and response to customer queries. |
• | HPS |
• | Infoturf.ai: Gen AI driven platform to automate the secondary research processes. It allows for document extraction, website extraction, target and open internet search and summarization through a workflow |
• | Healthcare TRAC |
• | WNS Claims TRAC: A multi-channel healthcare claims processing and workflow platform for advanced document handling and operational efficiency. |
79
• | Hyperautomation |
• | Malkom.AI: A Gen AI-integrated end-to-end freight automation platform on a low code orchestration layer for logistics carriers and shipping companies; |
• | TravelBuddy: A travel fulfilment and booking automation solution with Gen AI capabilities on low code platform; |
• | Card Dispute Management System: A system that automates the card-related disputes-to-settlements lifecycle and helps banks minimize financial losses and improve customer satisfaction with streamlined workflows on a single platform; |
• | Rapid claims: A solution to process insurance claims from FNOL to settlement, reducing the time in FNOL and claims processing by improving the transparency and operational efficiencies; |
• | Subrogation Claims Management System: A system to handle subrogation claims and maximize recovery opportunities with streamlined workflows, transparency and integrated document management; and |
• | Automotive IDP: A solution that aims to provide enterprises in/related to the automotive industry with meaningful insights by extracting any unstructured or semi-structured data from driving licenses and titles with better accuracy, speed and intuitive user experience. |
Cross-industry Technology Tools / Platforms. We utilize the following cross-industry technology tools and platforms in delivering services to our clients in this horizontal unit:
• | CFO TRAC |
• | Procure-to-Pay: A technology solution designed to facilitate multi-channel introduction of invoices, data extraction and processing, followed by seamless transfer to native enterprise resource planning systems for further action; |
• | Order-to-Cash and Record-to-Report: A software-as-a-service solution designed to standardize the workflow processes across different F&A functions such as order-to-cash and record-to-report process in line with industry-leading practices. |
• | CPO TRAC: A procurement management solution that leverages digital advancements along with predictive and functional analytics designed to transform procurement functions |
• | ProjectTRAC: A product for end-to-end procurement portfolio management with capabilities around project intake, project tracking, savings, value management and resource utilization; |
• | PIA: This AI-based digital assistant, integrated with real-time data tools and automation for a simplified stakeholder experience across the procurement ecosystem, assists with guided buying and queries around procurement policy, purchase order, purchase requisition, invoice and project status; |
• | KnowledgeTRAC: A one-stop procurement knowledge platform for category managers, for playbooks, category intelligence, collaboration and best practices; |
• | IntelliTRAC: An AI-enabled tool – powered by Wide Narrow, an AI/ML-based collaborative market intelligence platform – designed to transform unstructured market data into meaningful and actionable insights, providing proactive market intelligence for category managers; and |
• | CategoryTRAC: A next-generation category strategy and execution platform that provides portfolio management, analytics and intelligence to enable strategic category management. |
Other Procurement Solutions:
• | TSC Smart Risk: This is a cloud-based solution for ongoing risk monitoring and assessment of suppliers, supply markets and geographies to provide advance visibility into potential disruptions to our clients, allowing them to take timely and effective actions to mitigate supply chain threats; |
• | TSC Amplifi PRO: This is an on-demand digital procurement intelligence platform, delivering essential procurement intelligence (category and commodity) to the global procurement community; |
• | Workflow Automation: WNS Xpert |
• | A proprietary low-code / no-code process-agnostic workflow automation platform with best-of-breed technology and scalable, secure architecture |
• | Case Management: WNS Trackpoint Pro |
• | A proprietary, web-based case management solution designed to transform operations, track end-to-end task lifecycle and drive higher stakeholder satisfaction; |
80
• | Customer Experience |
• | WNS EXPIRIUS: A digital customer experience model designed to integrate human-assisted design and domain expertise with AI-driven insights and consulting-led strategies, offering multiple solutions as mentioned below: |
• | Conversational AI solutions based on a platform-driven delivery model, designed to lead to better customer experience at reduced operational cost; and |
• | CCaaS (Contact center as a service) solutions offering voice, email, SMS, chat, video, web and social media services in parallel. |
• | RPA and Intelligent Automation TRAC™: A proprietary suite of automation solutions developed on third-party collaborators’ platforms for RPA, cognitive technologies, ML and AI systems. It is designed to deliver automation and transformation services to our clients. |
• | Hyperautomation |
• | TrustHall: An AI-enabled contract management system that can extract contract data, TrustHall seeks to automate the end-to-end lifecycle of contracts to reduce revenue losses and risks and help enterprises improve operational efficiencies and accelerate growth; |
• | TalentHall: An HR recruitment software for automating and managing the full recruitment lifecycle from sourcing to onboarding, TalentHall is bolstered by an analytics dashboard and aims to reduce the time/cost-to-hire, improve the hiring process, identify the right candidates and enhance candidates’ experience; |
• | AppEzy: A no-code app builder that seeks to empower business users to design small applications with workflows and manage all the applications without any coding; and |
• | Dynamic Case Management: A one-stop ticket-handling solution that aims to empower organizations to easily track, prioritize and resolve cases. |
81
Sales and Marketing
The sales cycle for BPM services is time-consuming and complex in nature. The extended sales cycle generally includes initiating client contact, submitting requests for information and requests for proposals for client business, hosting client visits to our delivery centers (in person or virtually), and performing analysis (including diagnostic studies, proofs-of-concept, and pilot implementations) to demonstrate our delivery capabilities, finally culminating into a contract with the client. Due to the complex nature of the sales cycle, we have aligned our sales teams to our vertical business units and horizontal capabilities (such as WNS Triange) and staffed them with “hunting” or new relationship sales professionals (which we refer to as “hunters”), as well as “farming” or existing client relationship professionals (which we refer to as “farmers”). Our hunters and farmers have specialized industry knowledge and experience, which enable them to better understand prospective and existing clients’ business needs and to offer appropriate domain-specific solutions.
Our sales and sales support professionals are based in Australia, the UAE, Eastern Europe, India, Singapore, South Africa, the UK and the US. Our sales teams work closely with our global sales support team, which provides critical analytical support throughout the sales cycle. Other key capabilities offered by our sales support team include hyperautomation, transformation, consulting, generating leads for potential business opportunities and research support.
Our sales teams comprise highly experienced professionals, with an average tenure at WNS exceeding three years. They bring a wealth of industry expertise and leverage their knowledge to orchestrate transformative deals with new and existing clients. As at March 31, 2024, our front-line sales teams consisted of 157 members including hunters and farmers.
We continue to focus on large transformative opportunities that drive desired business outcomes for our clients. Our teams of farmers are responsible for identifying and initiating discussions with and selling services in new areas to existing clients, while our hunters are responsible for identifying opportunities with new clients who seek to outpace and outperform their peers by transforming their operational and digital service models.
Both farmers and hunters work with clients to co-create digital-led solutions that help our clients embrace change and deliver value to their end customers. By leveraging their detailed understanding of the clients’ business objectives gained through close interactions, our sales teams actively identify and target processes that can be better digitized and delivered by WNS’ expert talent with a view to improving self-service, cost efficiency, service accuracy, effectiveness, financial control and systematized performance consistency. Through this forward-looking design philosophy, we have developed a strong track record of increasing our sales year-on-year as well as expanding our relationships with existing clients.
A key aspect of our sales growth has been the ability of our sales leaders, in collaboration with their expert solutions and operations team, to both foresee and adapt to market changes that impact clients’ respective industries, operating and revenue models. The pervasiveness of AI and ML and the integration of data into the human-centric and automated decision making process have changed WNS’ approach to BPM. Our team’s focus has evolved into developing service models that utilize digital offerings and services by means of our proprietary and our industry alliance partners’ solutions. This helps us to address and often go beyond clients’ needs. We are an evolved digital solutions provider in key business verticals such as insurance, banking, manufacturing, healthcare, travel and retail. Our acquisitions of domain-agnostic operating companies such as Vuram, The Smart Cube and OptiBuy, combined with industry vertical expertise, deliver domain-specific hyperautomation solutions to our prospects and clients.
We take a long-term, holistic approach toward building client relationships – from initial contact to business as usual, underpinned by a multi-layered governance methodology to ensure collaboration, co-creation and service evolution. We believe it is the commitment of our sales, service and leadership teams that is the core reason behind clients collaborating with and continuing with WNS through opportune and turbulent times.
82
Clients
As at March 31, 2024, we had a diverse client base of 690 clients (with each client contributing more than $0.01 million in revenue in fiscal 2024) across a variety of industries and service types, including companies that we believe are among the leading players in their respective industries.
We believe the diversity in our client profile differentiates us from our competitors. See “Part I – Item 5. Operating and Financial Review and Prospects – Revenue” for additional information on our client base.
The table below sets forth the number of our clients by revenue for the periods indicated. We believe that the large number of clients who generate more than $1 million of annual revenue indicates our ability to extend the depth of our relationships with existing clients over time.
Year ended March 31, | ||||||||
2024 | 2023 | |||||||
Below $1.0 million |
497 | 457 | ||||||
$1.0 million to $5.0 million |
134 | 120 | ||||||
$5.0 million to $10.0 million |
27 | 23 | ||||||
More than $10.0 million |
32 | 27 |
Competition
Competition in the BPM services industry is intense and growing steadily. See “Part I – Item 3. Key Information – D. Risk Factors – Risks Related to Our Business – We face competition from onshore and offshore BPM companies and from information technology companies that also offer BPM services. Our clients may also choose to run their business processes themselves, either in their home countries or through captive units located offshore.”
We compete primarily with:
• | Focused BPM service companies with presence in offshore locations (primarily India), such as EXL Service Holdings, Inc., Firstsource Solutions Limited and Genpact Limited |
• | BPM divisions of numerous information technology service companies operating out of India, such as Cognizant Technology Solutions, Infosys Technologies Limited, Tata Consultancy Services Limited and Wipro Technologies Limited |
• | Global companies such as Accenture Limited, Capgemini, Electronic Data Systems Corporation, a division of Hewlett-Packard, and International Business Machines Corporation, which provide an array of products and services, including broad-based information technology, software, consulting and business process outsourcing services |
• | Global financial services and consulting firms such as Deloitte Private Limited, industry-focused niche technology players such as InterGlobe Enterprises Limited and Accelya Holding World SL, and specialty analytics service providers such as Mu Sigma Inc. |
In addition, departments of certain companies may choose to perform their business processes in-house, and in some cases via an owned and operated facility in an offshore location such as India. Their employees provide these services as part of their regular business operations.
83
Intellectual Property
We leverage synergistic approach of utilizing our in-house proprietary software platforms and systems, seamlessly integrating with our clients’ software systems and third-party software platforms. This integration forms the foundation for delivering our comprehensive BPM and Technology services.
Our proprietary solutions, complemented by licensed software (encompass both on-premise and cloud-hosted services, including software-as-a-service/platform-as-a-service models), enables us to strategically position and market our services as fully integrated solutions within our WNS TRAC® suite. These technology solutions are integrated into our core BPM service offerings in the majority of cases.
Our principal proprietary software solutions include:
1. |
WNS TRAC® industry-specific solutions, including the following: |
• |
Insurance TRACTM solutions including digital claims platform, WNS InVog (Insurance-in-a-box), and other proprietary solutions in our Insurance business unit; |
• |
Travel TRACTM solutions, including revenue accounting platform, fare audit platform (Verifare Plus 3.0SM), fare pro-ration solution (SmartProSM), revenue integrity solution (BIDT), queue distribution and productivity management solution (QbaySM). We have also launched a new solution this year, TravelBuddy, for corporate travel fulfillment process that leverages GenAI and Hyper-automation technologies for automated processing of requests. |
• |
S&L TRACTM solutions including WNS Malkom, a cloud native digital platform that covers end-to-end freight automation for logistics carriers and shipping companies, and helps drive optimization using AI/ML algorithms. Also, an expanded version of the solution, Malkom.ai was launched during the year that combines Gen AI and Hyper-automation for lifecycle processing of shipping documents with integration to client systems. |
• |
Healthcare TRAC™ solutions including multi-channel workflow platform for advanced document handling and improvement in process and operational efficiency (ClaimsTRAC™) and Industry-specific point-solutions used in other business units. |
2. |
WNS auto claims software platform (Claimonix) for insurers and fleet services, which we use in our WNS Assistance business, as well as other insurance clients; |
3. |
WNS TRAC ® cross-industry solutions, including the following: |
• |
CFO TRACTM solutions for our finance and accounting services, combining our proprietary software as well as solutions developed on 3rd party software. The suite includes F&A TRACTM, AP TRACTM, solution for end-to-end invoice processing workflow, |
• |
Digital CIS TRACTM solutions including WNS EXPIRIUS for our CIS (Customer Interaction Services) practice, combining multiple solutions across the customer interaction lifecycle |
• |
CPO TRACTM solutions for procurement including proprietary solutions like ProjectTRAC, InsightTRAC, WNS Procurement Card and PIA chatbot for procurement services |
• |
Process management solution and platform including, TrackPoint Pro (case management solution), Bridge (reporting and business intelligence platform) and Xpert (workflow platform) |
4. |
WNS RPA and Intelligent Automation TRACTM, including our proprietary automation solutions and solutions developed on third party partner platforms for RPA, cognitive technologies, ML and AI systems for delivering automation and transformation services to our clients. |
5. |
WNS-Vuram includes our hyperautomation proprietary solutions and accelerators on a low-code platform, such as TrustHall, for end-to-end commercial contract lifecycle management, AppEzy to empower business users with dynamic application building and workflows, ESGHall to enable organizations to achieve their ESG goals through automation and Dynamic Case Management, one-stop ticket handling solution which empowers organizations to easily track, prioritize, and resolve cases. |
6. |
The Smart Cube includes proprietary assets across four core segments namely, Procurement & Supply Chain, Commercial, Sales & Marketing, Digital & Analytics and Strategy & Investment Research, and proprietary platform “Amplifi PRO”. |
7. |
OptiBuy provides procurement transformation and consulting through its proprietary assets including its “OptiPRO” methodology to help implement end-to-end procurement transformation with process mapping and mining analysis. |
There are other proprietary software, point solutions and platform solutions developed on third party software used for cross-industry services including our WNS Triange business unit.
84
We routinely engage in the establishment of licensing and non-disclosure agreements with our clients concerning the utilization of their software platforms and systems. Our proprietary software platforms and systems are safeguarded by intellectual property rights, and we acquire licenses for third-party software platforms and systems from their respective owners. In adherence to our contracts with third-party software platform providers, any solutions developed by us using our domain knowledge based on such platforms are considered our intellectual property, unless specified otherwise.
Contracts with our clients typically stipulate that all customized intellectual property tailored specifically for their use will be assigned to them, unless expressly identified as our intellectual property.
To uphold the confidentiality of sensitive information, our employees are mandated to sign confidentiality agreements as a condition of their employment. These agreements encompass confidentiality obligations regarding both our company’s and the client’s intellectual property, extending beyond the duration of their employment. Additionally, these agreements ensure that any intellectual property created or developed by our employees during their employment is duly assigned to our organization.
Furthermore, we have taken measures to protect our brand identity by registering trademarks such as “WNS”, “WNS-Extending Your Enterprise”, and “WNS TRAC” in the majority of countries where our presence is established.
Technology
We have a dedicated team of technology experts who support clients at every stage of their engagement with us. The team designs, implements and supports technology solutions to enable delivery of business processes for our clients.
Enterprise grade Connectivity — We have designed and built a highly redundant, resilient, and secured network over Internet and global multi-protocol label switching (“MPLS”) network, connecting all our delivery centers and client datacenters. We run data, voice and video services over this robust network to serve our clients.
Customer experience services technology infrastructure — We have deployed omni-channel contact center platforms with voice, web chat, e-mail, social media, and interactive voice response channels across all our delivery centers, designed to improve customer experience. These customized platforms orchestrate omni-channel customer journeys across digital channels including self-service and payment card industry data security standard compliance.
Data centers — We have built highly secure, redundant data centers for hosting our omni-channel contact center platforms, automation tools, corporate infrastructure and application services.
Cloud computing — We have adopted cloud computing services such as office productivity tools, virtual servers, virtual storage, and web and e-mail security, for some of our clients and our corporate use.
Work from Anywhere: We have designed a highly secure and resilient work-from-anywhere solution leveraging multi-cloud technology. We have plugged in the Zero-Trust platform designed to protect internal and external applications against compromised remote devices and data theft. Further, strengthening of the platform’s security layer is done by implementing a multi-factor authentication.
Technology service management methodology — Our technology service delivery management is based on an information technology infrastructure library framework. We assist over 600 clients with technology implementation, service delivery and support for end user computing, wide area network, local area network telecommunications, customer interaction management platform, IT security, datacenter systems and cloud computing technology platforms.
Process and Quality Assurance and Risk Management
Our process and quality assurance compliance programs are critical for the success of our operations. We have an independent quality team to monitor, analyze, and provide feedback and report process performance and compliance. Our company-wide quality management system focuses on effectively managing our client processes on an ongoing basis. Our process delivery is managed by independent empowered teams and is measured regularly against pre-defined operational metrics. We have over 1,900 employees that help us meet quality assurance and ISO 9001 standards for Quality Management Systems and ensure continued compliance. We apply Lean Six Sigma methodologies, which are statistical and process-focused methodologies to improve and deliver consistent quality to customers. We apply well-defined quality management principles to improve and provide consistent levels of service quality to our clients. In fiscal 2024, more than 3,200 different projects / ideas completed using Lean Six Sigma / Kaizen methodologies and over 3,300 ideas/ additional projects are in progress. We also trained over 19,500 employees in ISO 9001 and Lean Six Sigma principles in fiscal 2024.
85
Our Board of Directors is primarily responsible for overseeing our risk management processes. The Board of Directors receives and reviews reports from the Chief Risk Officer as considered appropriate regarding our company’s assessment of risks. The Board of Directors focuses on the most significant risks facing our company and our company’s general risk management strategy, and also ensures that risks taken by our company are consistent with the Board’s appetite for risk.
Our risk management framework also focuses on three important elements: business continuity planning, information security and operations risk management.
Our approach to business continuity planning involves implementation of an organization-wide business continuity management framework which includes continual self-assessment, strategy formulation, execution and review. Our business continuity strategy leverages our expanding network of delivery centers for operational and technological risk mitigation in the event of a disaster. To manage our business continuity planning program, we employ a dedicated team of experienced professionals. A customized business continuity strategy is developed for key clients, depending on their specific requirements. For mission-critical processes, operations are typically split across multiple delivery centers in accordance with client-approved customized business continuity plans.
We have further enhanced our business continuity strategy, in view of the COVID-19 pandemic, through the implementation of a secure hybrid “Work-from-Home and Work-from-Office” model.
“Our approach to information security involves implementation of an organization-wide information security management system, which complies with the ISO 27001:2013 to manage organizational information security risks. These measures seek to ensure that sensitive information pertaining to our company or our clients remains secure. Currently, information security systems at 52 delivery centers are ISO 27001:2013 certified, and we expect to seek similar certifications for our newer delivery centers. We also comply with the Payment Card Industry Data Security Standard (“PCI DSS”) which is a security standard aimed at helping companies proactively protect cardholder data and sensitive authentication data. In addition, on an annual basis, we undergo “Service Organization Controls (“SOC”) 1 Type 2” audits, pursuant to Statements on Standards for Attestation Engagement No. 18 and International Standards for Assurance Engagements No. 3402, with respect to our general control environment supporting operational delivery, and “SOC 2 Type 2” audits, with respect to the trust service categories of security, availability and confidentiality.
Our approach to operations risk management involves the implementation of a “three lines of defense” framework for our clients’ offshored business processes. Under this framework, the quality assurance teams embedded within the business units act as the first line of defense, an independent and centralized risk management team acts as the second line of defense and an independent centralized audit team acts as the third line of defense. Our lines of defense are designed to identify potential risks, evaluate design efficiency and operating effectiveness of controls embedded within the outsourced business processes that we manage for our clients, and propose additional controls as appropriate for mitigation of the identified risks.
In addition, our clients may be governed by regulations specific to their industries or in the jurisdictions where they operate or where their customers are domiciled which may require them to comply with certain process-specific requirements. As we serve a large number of clients globally and across various industries, we rely on our clients to identify the process-specific compliance requirements and the measures that must be implemented in order to comply with their regulatory obligations. We assist our clients to maintain and enforce compliance in their business processes by implementing control and monitoring procedures and providing training to our employees serving specific client programs. These control and monitoring procedures are separate from and in addition to our periodic internal audits.
Human Capital
As at March 31, 2024, we had 60,125 employees, of whom 40,280 were based in India, 10,445 were based in the Philippines, 5,332 were based in South Africa, 1,205 were based in the US, 885 were based in Sri Lanka, 515 were based in Romania, 388 were based in the UK, 471 were based in China, 207 were based in Poland, 201 were based in Costa Rica, 99 were based in Australia, 25 were based in Turkey, 16 were based in Canada, 18 were based in Malaysia, 12 were based in Germany, 7 were based in Mexico, 6 were based in France, 6 were based in the United Arab Emirates, 3 were based in Singapore, 3 were based in Spain and 1 was based in Switzerland. Most of our associates hold university degrees. As at March 31, 2023, we had 59,755 employees. Our employees are not unionized. We believe that our employee relations are good. We focus heavily on recruiting, training and retaining our employees.
Recruiting and Retention
We believe that talent acquisition is an integral part of our overall organizational strategy. We have developed effective human resource strategies and demonstrated a strong track record in recruitment specific to the needs of our business units to optimize the training and development of our employees. As we continue to grow, we look to improve and enhance our candidate pool, which we source from recruitment agencies, job portals, advertisements, college campuses and walk-in applications. In addition, a significant number of our applicants are referred to us by existing employees. We recruited an average of 2,244 employees per month in fiscal 2024.
During fiscal 2024, 2023 and 2022, the attrition rate for our employees who had completed six months of employment with us was 31%, 39% and 36% respectively.
86
Learning and Development
In the past few years, we have been growing at an accelerated pace with a diversified client base. Our talent strategy complements our business strategy to access, mobilize and optimize talents for the organization’s aspiration to impact clients and stakeholders. In the age of “new normal” and rapid digital transformation, we are poised to build a digital-capable and resilient workforce that is ready for the future.
We have created a learning strategy based on a combination of organizational, business-unit and horizontal strategies, employee input and leadership conversations. Our talent development team carries out an intensive analysis of our training needs at the organization, business unit and location levels each year. Final training plans are approved by the leaders of our business units in alignment with their respective strategies.
Our talent strategy consists of four main components: (i) future ready workforce, (ii) robust leadership bench, (iii) inclusive culture, and (iv) talent fungibility.
Future-ready Workforce. Digital technology is fast-evolving and is becoming increasingly more pervasive in our lives. We recognize the importance of a workforce that is ready for a digital future. We aim to prepare our workforce to become digital natives. Below are some of the programs that we have implemented to create a future-ready workforce.
• | WNS Education Program: A division of the Learning Academy, WNS Education is dedicated to providing learning programs that empower employees to remain relevant amidst evolving times and shifting business priorities. In addition to a variety of curriculum-based certification programs, WNS Education offers numerous upskilling opportunities through curated self-paced programs, webinar series, keynote masterclasses and panel discussions with industry experts. The WNS Education Program aims at: |
• | Building capabilities to lead digital transformation in the BPM space by enabling the workforce to create ready-to-deploy capstone projects; |
• | Raising the organization’s digital consciousness by driving awareness on and familiarizing the workforce with emerging technology; |
• | Repurposing and re-skilling our workforce (since BPM-specific education is not available outside the WNS ecosystem) to create conduits between business and emerging technologies; |
• | Preparing a workforce of digital natives who are tech-aware and capable of working on technological projects; and |
• | Training domain experts to become AI / Gen AI evangelists and practitioners who actively integrate AI-powered solutions with their domain expertise to enhance client gains and efficiencies. |
At WNS, we recognize the impact of these evolving paradigms, particularly those driven by AI, on our clients and their end-customers. As strategic partners to our clients, it is our commitment to reskill and upskill our workforce and align our solutions, products and services with these dynamic and disruptive trends through the WNS Education initiative.
With the rise of AI, WNS Education remains dedicated to keeping WNS employees up-to-date and establishing a people capability development framework for AI / Gen AI through 22+ specialized programs, including AI Evangelist, AI Practitioner and AI Thought Leadership. We have achieved significant milestones, including 50K+ learner footfalls in areas such as RPA, digital awareness, AI / Gen AI; 300+ Capstone Ideas; 20K+ Learning Badges, 16K LinkedIn certifications and 30K+ learning footfalls for AI-based learning programs. Additionally, we have forged partnerships with leading global learning partners such as Carnegie Mellon, NASSCOM FutureSkills, LinkedIn, Mindmap Consulting, KPMG, Emeritus, XED and Deloitte Consulting.
• | GLINT: GLINT is an AI-powered LXP and knowledge cloud designed to enable employee journeys from end to end with learning, skilling and career mobility solutions. We partner with EdCast by Cornerstone to customize the platform for WNS employees. GLINT serves as our learning ecosystem, offering a diverse range of digital learning content accessible anytime, anywhere, on any device. It aims to accelerate skills development and foster inspiring learning experiences for individuals. GLINT seeks to deliver a unified, relevant, and engaging learning journey with modules tailored to WNS’ business requirements. It supports AI-enabled searches across assets sourced from trusted content providers within and outside the organization. Moreover, GLINT offers robust features including content curation, learning plans with assignments, progress tracking and analytics, as well as social and gamification elements to enhance collaborative and interactive learning experiences. |
• | Empowered LMS: Enthralltech’s LMS platform, called Empowered, caters to different learning modes, including asynchronous, synchronous and blending modes. Since its development about seven years ago, it has acquired a strong user base with over 100 customers leveraging its capabilities. |
This platform is tailored in collaboration with EnthrallTech to oversee structured learning programs in a modern and agile manner. It enables users to enhance learning outcomes, streamline training management processes and generate centralized learning reports. Users can further schedule training sessions, align instructors and content, manage user enrollments, deliver and monitor both classroom and virtual trainings, and capture session attendance and feedback.
The platform’s assessment functionality facilitates comprehensive learner evaluation through various formats, including multiple-choice questions, quizzes, video-based questions and interactive simulations. Additionally, its AI-based proctoring capabilities ensure the integrity and security of assessments.
87
Robust Leadership Bench. We have also established a number of programs that focus on nurturing and developing future leaders of the organization.
• | Signature Leadership Development Program (“SLDP”): This program has been specially designed and created for top leaders within the organization. Created in partnership with Korn Ferry and Harvard Business Publishing. |
SLDP is a 12-month journey, designed as a combination of face-to-face residentials, virtual sessions, group and one-on-one coaching, and corporate immersions. The entire program has been curated to help participants continue their career and growth as enterprise leaders, while supporting WNS in its digital transformation journey and drive its strategic objectives.
• | The CEO Millennial Council: The CEO Millennial Council is a marquee platform for the CEO and senior leaders to engage with the younger sections of the WNS workforce. The platform seeks to provide millennials and “Generation Z” employees an opportunity to share their thoughts and work with senior leaders, and contribute to shape the organization’s success. Its goal is to foster a global millennials community collaborating across regions and roles. |
• | WNS’ Leadership Academy: This initiative aims at leadership development, offering customized, role-specific, competency-aligned leadership development solutions for our leaders in the role band of C2 and above. The objective is to build leadership capabilities to enable the organization to reach its business goals. These programs consist of quarterly calendar programs and self-paced modules, primarily focusing on Gen AI, AI, and business unit-specific interventions, aligned with the Leadership Winning DNA framework. They are available across various geographical locations through partnerships with esteemed global learning vendors such as eCornell, Duarte Inc., Wilson Learning, and Strategic Proposals. These programs consistently receive high satisfaction scores, averaging 9 out of 10 in VoC feedback. |
• | The Trusted Client Advisor (“TCA”): The TCA program was curated for the global client partnering team as a virtual journey comprising both self-paced and live-webinar sessions. The virtual nature enabled outreach to and implementation with participants across the globe even during the COVID-19 lockdowns. |
• | The WNS Sales Academy: The WNS Sales Academy has been launched for our global sales team to foster a culture of continuous professional development. This curated program is a blend of self-paced learning, masterclasses from eminent speakers and roundtable conversations. The program content has been curated in partnership with LinkedIn Learning and is mapped to the essential aspects of WNS’ sales cycle, which include demand generation and pipeline, consulting and advisory, stakeholder management and relationships, negotiation and closing deals, and essential sales acumen. |
• | “Q-rious” Awards: Launched in December 2021, the Q-rious awards were conceived to fuel curiosity, influence knowledge acquisition and celebrate learning excellence. This program features forward-looking award categories, with leaderboards being published every quarter, leading to an exclusive annual award ceremony. The award categories (namely, Learning Content Curator, Learning Culture Enthusiast, Learning Guru, Learning Influencer and Learning Solution Architect) are incorporated into the League of Champions (LoC) portal. |
• | i-Excel: This leadership-learning program, accomplished in partnership with Harvard Business Publishing and Cornell University, is curated to meet the learning needs of specific groups from the business units, horizontal functions and support functions. |
• | Building Coaching Capabilities |
• | WNS Certified Coach: Coaching as an acumen has emerged as one of the most sought-after skills in managing teams in a hybrid setup. This certification program focuses on upskilling and transforming our managers into coaches. |
• | Leader as Mentor and Coach: This program has been created to help leaders acquire coaching and mentoring tools and techniques to augment their leadership style. |
These leadership programs are available on multiple platforms in different formats, including self-paced courses, virtual instructor-led sessions, simulation-based training and other blended learning methods.
88
Inclusive Culture. We are committed to creating an inclusive culture within the organization. To this end, some of the programs we have implemented include:
• | Centurion Program: This is a 30-month accelerated program to identify and nurture female employees in frontline management roles. It is aimed at enhancing their capabilities for future leadership positions and providing them with unique career advancement opportunities. The program consists of a 12-month academic phase followed by a tailored development journey. Additionally, it features a three-in-a-box mentoring initiative that pairs each Centurion participant with both a business leader and an HR leader to prepare the participant for a CII role. The business leader offers subject-matter guidance and developmental feedback, while the HR leader provides governance and support to ensure follow-through. |
• | Bloomberg Gender Equality Index: WNS has been included in the Bloomberg Gender Equality Index for three consecutive years from 2021 to 2023. |
Talent Fungibility. The BPM industry has been revolutionized by Gen AI, AI, robotics and other digital disruptions. As such, there is an increasing need for a pool of fungible talents to meet changing business requirements. We have implemented a number of initiatives designed to keep our employees’ skills relevant in the competitive market and in different roles.
Examples include:
• | The “Aspire” Program: The Aspire program enables the creation of talent pools for roles that are expected to develop in the near future. Employees are taken through a specially designed journey which includes tie-ups with reputed academic institutes, leader-speak sessions, live projects, etc. Specifically tailored to talent from Solutions, Operations, Client Partner and WNS Technology Services domains, the program targets employees engaged in roles requiring substantial client interaction or deliverables and identified as Best Bets. |
• | HR Leadership Program (“HRLP”): This is a talent development program, curated and customized in partnership with Deloitte. It seeks to cultivate a versatile talent pool of prospective HR Leaders equipped with a broad understanding of diverse business and functional intricacies. The program spans an 18-month learning voyage, comprising academic immersion, cross-functional exposure, and leadership coaching components. |
• | COMPASS: This is a dedicated, self-paced learning platform for managers transitioning into new roles. |
• | The CEO Millennial Council: The CEO Millennial Council is a marquee platform for the CEO and senior leaders to engage with the younger sections of the WNS workforce. The platform seeks to provide millennials and “Generation Z” employees an opportunity to share their thoughts and work with senior leaders, and contribute to shape the organization’s success. Its goal is to foster a global millennials community collaborating across regions and roles |
89
Employee Health and Safety
WNS Occupational Health & Safety—Management System
WNS has a well-defined Occupational Health and Safety Management System and its major service delivery locations such as WNS India, Philippines, South Africa, Romania, and Sri Lanka have implemented and have been certified for the latest international standard ISO 45001:2018, which cover WNS’ major headcount and area footprint. The organization has a systematic approach of integrating Environment Health and Safety (“EHS”) into its business practices. Other locations of WNS will be included under the certification program in phases pursuant to the business/client requirement.
WNS has a well-defined EHS policy which is signed by the Group CEO. This policy reflects the intent, direction and commitment of the top management towards environment protection, health and safety of employees and contractor employees working at WNS. The four key elements of the EHS policy are:
• |
Environment & sustainability |
• |
Encourage compliance |
• |
Employees & stakeholders (clients, suppliers, contractors & government) |
• |
EHS integration & business excellence |
The purpose of EHS system is to identify and control hazards on an on-going basis to protect the environment and the health and safety of employees and stakeholders. Our EHS management system partners with all concerned internal and external stakeholders to provide a safe and health work place. Technically, the complete EHS Program follows the Plan Do Check Act (“PDCA”) approach which provides the opportunity to identify the scope of improvement and move towards continual development.
EHS awareness is part of a new employee induction program. WNS has a dedicated team for risk management. The high-level risk assessments are performed and necessary control measures are placed accordingly to minimize risks. The risk management team also performs periodical risk audits at each location and follows up for the relevant closures. In addition to the high-level risk assessment performed by the risk management team, the hazard identification and risk assessment at functional/task level are also performed by the EHS team. The control measures are being set accordingly. Appropriate information and training are provided to concerned teams for better execution of the allotted role/task and continual improvement. EHS is a part of new employee induction program. Online trainings modules on health and safety topics with assessment are available for employees. Post completion of the assessment , the digital certificates are provided for the successful participants.
In addition, WNS has a dedicated corporate legal team that ensures complete adherence to applicable regulatory requirements. The organization has an automated online Ernst & Young Global Compliance Manager Tool (“GCT”) to help ensure a high level of compliance.
• |
GCT contains a comprehensive repository of applicable statutory compliances for each entity/branch/function. |
• |
IT provides timely alerts and enables the users to report compliance activities seamlessly. |
• |
GCT dashboard provides a real-time status of the organization’s compliance health to the management. |
The on ground implementation of the local regulations and international standards as per ISO 45001 is co-ordinated by the facilities and admin- EHS function.
The EHS program of WNS not only protects the employees but also cares for the contract workers, through various trainings, awareness session and health screening camps. The program has a matured pathway for the management of sustainable development, while taking care of the health and safety of its employees and service providers. For this purpose, several new procedures and practices were also laid down. Sites are equipped with emergency mitigating systems and procedures. Sufficient exit routes, fire alarm and fighting equipments have been installed which are periodically inspected. Mock drills and other necessary trainings are also performed. Required periodical Internal, Client and Certification audits are also conducted to check maintenance of the program.
WNS has an Incident Management System which is an online intranet portal to report all types of incidents. The purpose of IMS is to ensure that all Occupational Illness, Injury & Learning Incident (Near Miss), Environmental Releases by spill or leakages are appropriately managed, promptly & appropriately reported. Any event that requires investigation (due to either its intensity of harm to people, environment or property or might have potential of causing such harm) are evaluated to find the root cause and necessary corrective and preventive action shall be taken wherever required in response to it for the enhancement of safety and environmentally sound at workplace.
90
The EHS policies and procedures include:
1) |
EHS Policy |
2) |
Corporate EHS Manual |
3) |
EHS Standard Procedures and Guidelines which has below major procedures and guidelines |
4) | EHS Committee |
5) | Compliance and Communication for Contractors, Service Providers & Suppliers |
6) | Change Management |
7) | Occupational Health Center Management |
8) | Walking Working Surfaces and Ladder Safety |
9) | Fire Prevention and Protection Systems |
10) | Occupational incident and Environmental Release |
11) | Sustainability Reporting |
EHS Forms/Checklist:
• | Change Management Form |
• | EHS Committee MOM Form |
• | Permit to work Form |
• | Fire Extinguisher Inspection Form |
• | Walking working Surfaces Checklist |
• | Health & Safety Management certification ISO45001:2018 |
• | Occupational Safety and Health Award: Silver Award at the 4th OSH India Awards 2016 conducted by UBM. |
• | Global safety Summit Award 2019 for two categories, Environment Awards (ITES) and Health & Safety Awards (ITES) 2019 |
Environmental, Social and Governance
At WNS, sustainability represents a unified belief, a shared responsibility, and an unwavering commitment. By leveraging deep and meaningful partnerships with our stakeholders, we continuously strive to create sustainable outcomes that fulfil our dual objective of value creation and growth while strengthening our environment and societies. Our strategy is structured to seamlessly integrate sustainability into the very foundation of our operational framework. Rooted in the principle of creating trust among stakeholders, we prioritize the planet, people, and partnerships as the cornerstones of our strategy.
Our Sustainability Strategy is focused on:
• | Mitigating climate risks by moving towards Carbon Net-Zero |
• | Enabling our clients to balance purpose and performance through digital-led innovative offerings |
• | Building the skills of tomorrow by providing an equitable and opportunity-led work environment |
• | Contributing towards building an inclusive society by providing education for the marginalized children and youth |
• | Creating the highest standards for Ethics, Integrity and Compliance to drive value and trust in every stakeholder (investors / shareholders) engagement |
Being a signatory member to the United Nations Global Compact (‘UNGC’), we have submitted our first Communication of Progress to UNGC in December 2023. We have published an ESG report in accordance with Global Reporting Initiative and our disclosure in the report are aligned with Sustainability Accounting Standards Boards, the guiding principles of the UNGC and the targets outlined in the United Nations Sustainable Development Goals.
For more information about our ESG initiatives, and accomplishments, please see our Sustainability Report available in the “About us” section of our website.
91
Regulations
Due to the industry and geographic diversity of our operations and services, our operations are subject to a variety of rules and regulations, and several federal and state agencies in Australia, China, Costa Rica, Canada, France, Germany, India, Ireland, Mauritius, Malaysia, the Mexico, the Netherlands, New Zealand, the Philippines, Poland, Portugal, Romania, Singapore, South Africa, Spain, Sri Lanka, Switzerland, Turkey, United Arab Emirates, the UK and the US that regulate various aspects of our business. See “Part I — Item 3. Key Information — D. Risk Factors — Risks Related to our Business — Our global operations expose us to numerous and sometimes conflicting legal and regulatory requirements. Failure to adhere to the laws and regulations that govern our business or our clients’ businesses that we are required to comply with in performing our services could harm our business.” We have benefitted from, and continue to benefit from, certain tax holidays and exemptions in various jurisdictions in which we have operations.
In fiscal 2024, 2023 and 2022, our tax rate in India, the Philippines and Sri Lanka impacted our effective tax rate. We would have incurred approximately $10.3 million, $20.7 million and $20.9 million in additional income tax expense on our combined operations in our SEZ operations in India, the Philippines and Sri Lanka in fiscal 2024, 2023 and 2022 respectively, if the tax holidays and exemptions described below had not been available for the respective periods.
We expect our tax rate in India, the Philippines and Sri Lanka to continue to impact our effective tax rate. Our tax rate in India has been impacted by the reduction in the tax exemption enjoyed by our delivery center operating under the SEZ scheme. In fiscal 2024, we operated from various delivery centers in the Philippines which commenced operations from fiscal 2018 to fiscal 2024 and are eligible for tax exemption benefits expiring between fiscal 2024 and fiscal 2029. Following the expiry of the tax benefits, income generated by the Philippines subsidiary will be taxed at the prevailing special tax rate, which currently is 5.0% on gross profit. As per The Corporate Recovery and Tax Incentives for Enterprises Act (“CREATE”) which is effective from April 2021, enterprises will be taxed at 5% on gross profit for a fixed period of 10 years. Also, any changes in the regulations relating to work from home arrangements may impact the tax exemption benefits available to our Philippines subsidiary. From January 1, 2020, our operations in Sri Lanka are eligible to claim income tax exemption with respect to the profits earned from export revenue, as more fully described below.
92
India
Effective April 1, 2011, upon the expiration of this tax exemption, income derived from our operations in India became subject to the prevailing annual tax rate of 34.95%.
In 2005, the Government of India implemented the SEZ legislation, with the effect that taxable income of new operations established in designated SEZs may be eligible for a 15-year tax holiday scheme consisting of a complete tax holiday for the initial five years and a partial tax holiday for the subsequent ten years, subject to the satisfaction of certain capital investment conditions in the last five years. Since fiscal 2012, we have started operations in various delivery centers in Mumbai, Pune, Chennai, Gurgaon and Noida, India that were registered under the SEZ scheme. Some of these operations are eligible for a 100.0% income tax exemption for a period of five years from the date of commencement of operations expiring between fiscal 2022 and fiscal 2024. Following the expiry of the 100.0% income tax exemption, these operations are eligible for a 50.0% income tax exemption, which is set to expire between fiscal 2026 and fiscal 2034. Such income tax exemptions are only eligible for business units and operations set up under the SEZ legislation on or before March 31, 2020.
The Government of India enacted the India Tax Law effective April 1, 2019, which enables Indian companies to elect to be taxed at a lower income tax rate of 25.17% as compared to the current rate of 34.95% (applicable after expiry of tax holiday). Once a company elects into the lower income tax rate, a company may not benefit from any tax holidays associated with SEZ and certain other tax incentives and may not reverse its election.
The Government of India may enact new tax legislation that could impact the way we are taxed in the future. See “Part I — Item 3. Key Information — D. Risk Factors — Risks Related to Key Delivery Locations — Tax legislation and the results of actions by taxing authorities may have an adverse effect on our operations and our overall tax rate.”
Philippines
In fiscal 2024, we operated from various delivery centers in the Philippines which commenced operations from fiscal 2018 to fiscal 2024 and are eligible for tax exemption benefits expiring between fiscal 2024 and fiscal 2029. Following the expiry of the tax benefits, income generated by the Philippines subsidiary will be taxed at the prevailing special tax rate, which currently is 5.0% on gross profit. As per CREATE which is effective from April 2021, enterprises will be taxed at 5% on gross profit for a fixed period of 10 years.
Any changes in the regulations relating to work from home arrangements may impact the tax exemption benefits available to our Philippines subsidiary.
Sri Lanka
From January 1, 2020, our operations in Sri Lanka are eligible to claim income tax exemption with respect to the profits earned from export revenue.
93
Enforcement of Civil Liabilities
We are incorporated in Jersey, Channel Islands. Most of our directors and executive officers reside outside of the US. Substantially all of the assets of these persons and substantially all of our assets are located outside the US. As a result, there may be difficulties for investors in effecting service of process on these persons or us within the US, or in enforcing against these persons or us, either inside or outside the US, a judgment obtained in a US court, including in particular a judgment predicated upon the civil liability provisions of the federal securities or other laws of the US or any state thereof. It is doubtful whether an original action based on US federal securities laws can be brought before Jersey courts.
A judgment of a US court is not directly enforceable in Jersey, but constitutes a cause of action on the basis of which a judgment may be obtained in the Jersey courts which will be enforced by Jersey courts provided that:
• | the court which pronounced the judgment had jurisdiction to entertain the case according to the principles recognized by Jersey law; |
• | the judgment is given on the merits and is final and conclusive — it cannot be altered by the courts which pronounced it; |
• | there is payable pursuant to the judgment a sum of money, being not considered by the Jersey courts to be a sum payable in respect of tax or other charges of a like nature or in respect of a fine or other penalty (subject to a non-money foreign judgment being in some circumstances also enforceable); |
• | the judgment can be enforced by execution in the jurisdiction in which the judgment is given; |
• | the person against whom the judgment is given does not benefit from immunity under the principles of public international law; |
• | there is no earlier judgment in another court between the same parties on the same issues as are dealt with in the judgment to be enforced; |
• | the judgment was not obtained by fraud or duress; and |
• | the recognition and enforcement of the judgment is not contrary to public policy in Jersey or the requirements of natural justice and the right to a fair trial, which in general terms require that notice of the US proceeding was properly served on the defendant, that the defendant was given the right to be heard and represented by counsel in a free and fair trial before an independent and impartial tribunal and that judicial proceedings were substantially conducted in accordance with what could reasonably be expected by the defendant under the law of the tribunal. |
Jersey courts cannot enter into the substantive merits of the foreign judgment and cannot act as a court of appeal or review over the foreign courts. A plaintiff may be required to provide security for costs in the event of proceedings being initiated in Jersey.
It is the general policy of Jersey courts to assess damages in terms of compensation for the loss or damage actually sustained by the person to whom the compensation is awarded. The award of punitive damages is rare. It has been held not to be available in respect of claims for breach of contract. Whether a judgment is contrary to public policy depends on the facts of each case. Awards which are considered to be exorbitant, unconscionable, or grossly excessive may be contrary to Jersey public policy. The Protection of Trading Interests Act 1980, an Act of the UK extended to Jersey by the Protection of Trading Interests Act 1980 (Jersey) Order 1983 (“the Order”), provides that a judgment inter alia for multiple damages is not enforceable in Jersey. A judgment for multiple damages is defined as a judgment for an amount arrived at by doubling, trebling or otherwise multiplying a sum assessed as compensation for the loss or damage sustained by the person in whose favour the judgment is given.The Order providesthat a qualifying defendant (which includes a citizen of the UK and colonies, a company incorporated in Jersey and a person carrying on business in Jersey) is in some circumstances able to recover such amount paid by it as represents the excess of such multiple damages over the sum assessed as compensation by the court that gave the judgment.
94
In India, recognition and enforcement of foreign judgments is provided for under Section 13 and Section 44A of the Code of Civil Procedure, 1908 (India) (the “Civil Code”), as amended. Section 44A of the Civil Code provides that where a foreign judgment has been rendered by a superior court in any country or territory outside India which the Indian government has by notification declared to be a reciprocating territory, such foreign judgment may be enforced in India by proceedings in execution as if the judgment had been rendered by a competent court in India. However, Section 44A of the Civil Code is applicable only to monetary decrees not being in the nature of amounts payable in respect of taxes or other charges of a similar nature or in respect of fines or other penalties and does not include arbitration awards. The US has not been declared by the Indian government to be a reciprocating territory for the purposes of Section 44A of the Civil Code. Accordingly, a judgment of a foreign court, which is not a court in a reciprocating territory, may be enforced in India only by a fresh suit instituted in a court of India and not by proceedings in execution. Furthermore, the execution of the foreign decree under Section 44A of the Civil Code is also subject to the exception under Section 13 of the Civil Code, as discussed below.
Section 13 of the Civil Code, states that a foreign judgment is conclusive as to any matter directly adjudicated upon except:
• | where the judgment has not been pronounced by a court of competent jurisdiction; |
• | where the judgment has not been given on the merits of the case; |
• | where it appears on the face of the proceedings that the judgment is founded on an incorrect view of international law or a refusal to recognize the law of India in cases where such law is applicable; |
• | where the proceedings in which the judgment was obtained were opposed to natural justice; |
• | where the judgment has been obtained by fraud; or |
• | where the judgment sustains a claim founded on a breach of any law in force in India. |
The suit must be brought in India within three years from the date of the judgment in the same manner as any other suit filed to enforce a civil liability in India. It is unlikely that a court in India would award damages on the same basis as a foreign court if an action is brought in India. Furthermore, it is unlikely that an Indian court would enforce foreign judgments if it viewed the amount of damages awarded as excessive or inconsistent with public policy in India. A party seeking to enforce a foreign judgment in India is required to obtain prior approval from the Reserve Bank of India under the Indian Foreign Exchange Management Act, 1999, to repatriate any amount recovered pursuant to such execution and such amount may be subject to tax in accordance with applicable laws. Any judgment in a foreign currency would be converted into Indian rupees on the date of judgment and not on the date of payment. We cannot predict whether a suit brought in a court in India will be disposed of in a timely manner.
95
C. Organizational Structure
The following diagram illustrates our company’s organizational structure and the place of organization of each of our subsidiaries as at the date hereof. Unless otherwise indicated, each of our subsidiaries is wholly owned, directly or indirectly, by WNS (Holdings) Limited. Directly owned subsidiaries of WNS are represented by shaded boxes.
1. | # WNS Cares Foundation is a company registered under Section 8 of the Companies Act, 2013 (prev. Section 25 of Companies Act, 1956). |
2. | Denali Sourcing Services, Inc. and WNS Global Service, Inc. were each converted into a limited liability company i.e. Denali Sourcing Services, LLC and WNS Global Service, LLC respectively with effect from April 1, 2023. |
3. | Pursuant to the Order dated August 4, 2022 issued by the Hon’ble National Company Law Tribunal, Mumbai Bench, for amalgamation of WNS Information Services (India) Private Limited (“Transferor Company”) with WNS Global Services Private Limited (“Transferee Company”), the Transferee Company allotted 1,505 equity shares to WNS (Mauritius) Limited on June 19, 2023, The aggregate shareholding of WNS (Mauritius) Limited in the Transferee Company post such allotment increased from 63.18% to 63.23%. |
4. | WNS GLOBAL SERVICES LISBON, UNIPESSOAL LDA was dissolved on November 29, 2023 and deregistered from the company registry on December 12, 2023. |
5. | On December 14, 2023, WNS Global Services Private Limited acquired a further 24.77% stake of WNS Business Consulting Netherlands B.V. from WNS (Holdings) Limited, after which WNS Business Consulting Netherlands B.V became the wholly owned subsidiary of WNS Global Services Private Limited. |
6. | WNS BPM Americas LLC- Philippine branch office was incorporated in Philippines with effect from February 12, 2024. |
7. | With effect from April 7, 2024, Smart Cube Consulting Service (Dalian) Co., Ltd ceased to exist upon cancellation of its business license. |
8. | WNS Global Services SA (Pty) Ltd redeemed 1 Redeemable Participating Preference Share effective April 19, 2024 resulting into no entitlement of The WNS B-BBEE Staff Share Trust for: |
i. | participation in the economic interest of WNS South Africa (Pty) Ltd |
ii. | exercise of voting rights on any shareholder’s resolution proposed by WNS South Africa (Pty) Ltd. |
96
D. Property, Plants and Equipment
As at March 31, 2024, we have an installed capacity of 41,599 production workstations, or seats, that can operate on an uninterrupted 24/7 basis and can be staffed on a three-shift per day basis.
The majority of our properties are leased by us. Most of our leases are renewable at our option, as indicated below. Details of the leases for each of our delivery centers and sales offices, including centers under construction, are summarized in the table below.
Location |
Total Space (square feet) |
Total number of work stations |
Lease Expiration Date | Extendable Until ( 1) | ||||||||||||
India: |
||||||||||||||||
Mumbai |
364,627 | 3,309 | ||||||||||||||
Godrej Plant 10 |
February 15, 2026 | N/A | ||||||||||||||
Godrej Plant 11 |
February 15, 2026 | N/A | ||||||||||||||
Godrej Plant 5 |
February 15, 2026 | N/A | ||||||||||||||
Raheja (SEZ), Airoli |
May 31, 2029 | N/A | ||||||||||||||
Gurgaon |
445,352 | 4,755 | ||||||||||||||
World Tech Park Block – B2 – 9th floor |
April 30, 2027 | April 30, 2032 | ||||||||||||||
World Tech Park Block – B3 – 9th floor |
April 30, 2027 | April 30, 2032 | ||||||||||||||
World Tech Park – 8th, 9th, 10th & part 11th floor |
April 30, 2027 | April 30, 2032 | ||||||||||||||
World Tech Park – Remaining part of 11th floor |
April 30, 2027 | April 30, 2032 | ||||||||||||||
World Tech Park – Block A3 – 11th floor |
April 30, 2027 | April 30, 2032 | ||||||||||||||
World Tech Park – Block B3 –10th floor |
April 30, 2027 | April 30, 2032 | ||||||||||||||
World Tech Park – Block B2 –10th floor |
April 30, 2027 | April 30, 2032 | ||||||||||||||
World Tech Park – Block A2& A3 –10th floor |
April 30, 2027 | April 30, 2032 | ||||||||||||||
World Tech Park – Block B3 – 11th floor |
February 14, 2028 | February 14, 2033 | ||||||||||||||
World Tech Park – Block B2 – 6th floor |
November 30, 2028 | February 19, 2033 | ||||||||||||||
World Tech Park – Block B3 – 6th floor |
October 31, 2028 | February 19, 2033 | ||||||||||||||
Pune |
656,045 | 8,755 | ||||||||||||||
Magarpatta |
N/A | N/A | ||||||||||||||
Weikfield – Phase I |
February 14, 2028 | N/A | ||||||||||||||
Weikfield – Phase II |
April 30, 2028 | N/A | ||||||||||||||
Weikfield – Phase III |
June 14,2028 | N/A | ||||||||||||||
Magarpatta (SEZ) – Level 5 |
February 14, 2026 | N/A | ||||||||||||||
Magarpatta (SEZ) – Level 6 |
October 26, 2026 | N/A | ||||||||||||||
Magarpatta (SEZ) – Level 7 |
February 28, 2027 | N/A | ||||||||||||||
Magarpatta – Tower 9 |
February 28, 2029 | N/A | ||||||||||||||
Pune Info city – 5th floor |
June 14, 2027 | June 14, 2032 | ||||||||||||||
Pune Info city – 4th floor |
June 14, 2028 | N/A | ||||||||||||||
Pune Info city – 3rd floor |
September 30, 2028 | September 30, 2033 | ||||||||||||||
Nashik |
114,908 | 1,813 | ||||||||||||||
Shreeniketan |
June 30, 2028 | N/A | ||||||||||||||
Vtech |
October 13, 2028 | N/A | ||||||||||||||
Ashoka Business Conclave – 6th floor |
November19, 2024 | N/A | ||||||||||||||
Ashoka Business Conclave – 3rd floor |
November 19, 2025 | N/A | ||||||||||||||
Bangalore |
191,890 | 1,987 | ||||||||||||||
RMZ Centennial – Ground floor and Level 1 |
June 14, 2025 | June 14, 2028 | ||||||||||||||
RMZ Centennial – Level 2 and 3 |
October 31, 2025 | October 31, 2028 | ||||||||||||||
RMZ Centennial – Terrace |
July 31, 2025 | July 31, 2028 | ||||||||||||||
Chennai |
187,263 | 1,801 | ||||||||||||||
Prestige Cyber Tower |
December 31, 2027 | December 31, 2032 | ||||||||||||||
DLF (SEZ) – Phase 1&2 |
March 15, 2026 | March 14, 2031 | ||||||||||||||
DLF IT SEZ – 9th floor |
March 15, 2026 | March 15, 2031 | ||||||||||||||
Vuram Shyamala Towers – 3rd floor(5) |
January 31, 2026 | N/A | ||||||||||||||
Vuram Shyamala Towers – 2nd floor |
June 30, 2025 | June 30, 2028 |
97
Location |
Total Space (square feet) |
Total number of work stations |
Lease Expiration Date | Extendable Until ( 1) | ||||||||||||
Vishakhapatnam |
212,613 | 2,177 | ||||||||||||||
Vizag IT Park Ltd |
March 31, 2034 | N/A | ||||||||||||||
Tech Mahindra |
March 31, 2026 | March 31, 2029 | ||||||||||||||
Tirchy |
||||||||||||||||
Vuram | Elcott IT Park |
5,976 | 80 | February 28, 2025 | February 28, 2028 | ||||||||||||
Noida |
56,111 | 615 | ||||||||||||||
Brookfield |
January 22, 2028 | January 22, 2033 | ||||||||||||||
Windsor IT Park |Smart Cube 3rd floor. |
March 31, 2025 | N/A | ||||||||||||||
Windsor IT Park |Smart Cube 6th floor. |
December 31, 2032 | N/A | ||||||||||||||
Indore |
52,214 | 527 | ||||||||||||||
Brilliant Titanium – 5th floor |
May 14, 2032 | April 30, 2037 | ||||||||||||||
Hyderabad |
60,260 | 689 | ||||||||||||||
Prestige Skytech – 3rd Floor |
December 9, 2028 | December 9, 2033 | ||||||||||||||
Srilanka: |
54,675 | 817 | ||||||||||||||
Colombo (HNB) – Level 12 and 13 |
July 31, 2028 | N/A | ||||||||||||||
Colombo (Orion City) |
August 24, 2028 | August 24, 2033 | ||||||||||||||
UK: |
14,509 | 170 | ||||||||||||||
Ipswich (Museum Street) |
May 23, 2028 | N/A | ||||||||||||||
Piccadilly (Malta House)(2) |
February 10, 2027 | N/A | ||||||||||||||
Lloyds Building(2) |
December 31, 2024 | N/A | ||||||||||||||
Farriers Yard – UK Smart cube(4) |
July 3, 2026 | N/A | ||||||||||||||
US: |
74089 | 403 | ||||||||||||||
Bellevue (sterling plaza) – 5th and 6th floors |
June 30,2024 | N/A | ||||||||||||||
Pittsburg (One Waterfront Place) |
July 31, 2027 | March 31, 2032 | ||||||||||||||
Midtown Suites (Co-working space(2) |
September 30, 2028 | N/A | ||||||||||||||
7909 Parklane Road, Columbia SC – 1st floor |
May 31, 2026 | October 15, 2029 | ||||||||||||||
Vuram |Tampa Oaks LLC |
March 31, 2025 | N/A | ||||||||||||||
Houston (Northchase drive) |
March 31, 2026 | March 31, 2036 | ||||||||||||||
Canada: |
||||||||||||||||
Canada | Vuram Mindshare Space |
August 31, 2024 | N/A | ||||||||||||||
Malaysia: |
||||||||||||||||
Axiata Tower |
23 | May 14, 2026 | N/A | |||||||||||||
Switzerland: |
3788 | |||||||||||||||
Zurich (Bahnhofstrasse(2) |
Not specified | N/A | ||||||||||||||
Romania: |
25,218 | 92 | ||||||||||||||
One Crotoceini Park, Bucharest Romania |
March 31, 2034 | N/A | ||||||||||||||
Centrul de Afacer – 8th floor(6) |
December 31, 2024 | December 31, 2025 | ||||||||||||||
Simultan S.R.L – Smart Cube |
May 31, 2024 | N/A | ||||||||||||||
Cowork Timisoara SRL |
March 31, 2025 | N/A | ||||||||||||||
Philippines: |
||||||||||||||||
Manila |
652,387 | 8,492 | ||||||||||||||
Eastwood – 10th floor |
June 30, 2026 | N/A | ||||||||||||||
Eastwood – 9th floor |
June 30, 2026 | N/A | ||||||||||||||
Techno Plaza II |
April 30, 2026 | N/A | ||||||||||||||
Zeta Tower – 10th floor |
May 14, 2024 | May 14, 2029 | ||||||||||||||
Exxa tower – 15th floor |
November 30, 2028 | N/A | ||||||||||||||
Exxa Tower – 16th floor |
June 14, 2028 | June 14, 2032 | ||||||||||||||
Exxa Tower – 17th floor |
November 30, 2028 | N/A | ||||||||||||||
Giga Tower – 8th floor |
October 15, 2024 | October 15, 2029 | ||||||||||||||
Giga Tower – 9th floor |
April 30, 2025 | April 30, 2030 | ||||||||||||||
Ilo Ilo |
||||||||||||||||
One Global Center |
January 15, 2026 | N/A | ||||||||||||||
Three Techno Place – 4th floor |
March 16, 2027 | March 16, 2032 | ||||||||||||||
Two Techno Place |
April 30, 2029 | April 30, 2034 | ||||||||||||||
Cybergate Tower 1 – 7th floor |
December 31, 2026 | N/A | ||||||||||||||
Cybergate Tower 2 – 3rd and 4th floor |
December 15, 2027 | December 15, 2032 |
98
Location |
Total Space (square feet) |
Total number of work stations |
Lease Expiration Date | Extendable Until ( 1) | ||||||||||||
Alabang |
||||||||||||||||
Vector 2 – 9th and 10th floors |
February 28, 2027 | February 28, 2032 | ||||||||||||||
Capella – 15th and 16th floors |
May 31, 2026 | N/A | ||||||||||||||
FiliInvest Axis – 21st floor |
November 30, 2028 | November 30, 2033 | ||||||||||||||
FiliInvest Axis – 22nd floor |
November 30, 2028 | November 30, 2033 | ||||||||||||||
Tera Towers |
December 31, 2027 | December 31, 2032 | ||||||||||||||
Costa Rica: |
12,592 | 199 | ||||||||||||||
San Jose (Forum H) |
April 30, 2025 | N/A | ||||||||||||||
United Arab Emirates: |
1,130 | N/A | ||||||||||||||
Dubai Airport Free Trade Zone(2) |
October 31, 2026 | N/A | ||||||||||||||
South Africa: |
332,374 | 4,047 | ||||||||||||||
Cape Town |
||||||||||||||||
Knowledge Park |
March 31, 2025 | March 31, 2030 | ||||||||||||||
Bridge Park |
December 31, 2027 | N/A | ||||||||||||||
Sunclare, Claremont |
May 31, 2028 | May 31, 2033 | ||||||||||||||
Bellville |
||||||||||||||||
Ambition House – 4th floor |
October 31, 2025 | N/A | ||||||||||||||
Durban |
||||||||||||||||
Hippopark Avenue – Sections 1 and 2 |
April 30, 2025 | N/A | ||||||||||||||
Cornubia Momentum. |
June, 30 2028 | N/A | ||||||||||||||
Poland: |
28,222 | 323 | ||||||||||||||
Gdynia (Luzycka Office Park) – Buildings C and D |
August 31, 2027 | N/A | ||||||||||||||
Poland|Eqlibrium|Optibuy |
May 15, 2025 | N/A | ||||||||||||||
Poland|Building 5 Mfynska Street|Optibuy |
December 31, 2024 | N/A | ||||||||||||||
Poland|Technology Incubator|Optibuy |
August 16, 2026 | N/A | ||||||||||||||
China: |
47,598 | 513 | ||||||||||||||
Guangzhou (Zhongshan Street) – 22nd and 30th floors |
April 30, 2027 | N/A | ||||||||||||||
Dalian (Dalian Software Park) – Building 22 |
May 15, 2026 | N/A | ||||||||||||||
Beijing (YongAnDongLi) – 5th floor |
Decemebr 31, 2026 | N/A | ||||||||||||||
Shanghai (Huangu PL) |
January 31, 2025 | N/A | ||||||||||||||
Germany: |
32 | — | ||||||||||||||
Friedrich-Ebert-Anlage 36 |
October 31, 2024 | N/A | ||||||||||||||
Berlin |
January 31, 2025 | N/A | ||||||||||||||
Australia: |
1,216 | — | ||||||||||||||
Sydney (Berry Street)(2) |
March 27, 2025 | N/A | ||||||||||||||
Co-working space – Vuram Melbourne |
November 30, 2024 | N/A | ||||||||||||||
Turkey: |
||||||||||||||||
SmartOffice (Denali registered office) |
N/A | 10 | April 30, 2025 | N/A |
Notes:
N/A means not applicable.
(1) | We have signed a lease for new premises located at Central Avenue, Mumbai, India (the second, third and fourth floors), effective starting from April 1, 2023; the premises have 187,457 square feet of total space and are not yet operational. |
(2) | These are sales facilities and hence workstations are not reported as at March 31, 2024. |
(3) | One-Cotroceni Park, Bucharest Romania, with an area of 20,988 square feet and 230 seat capacity, signed for 120 months ending March 31, 2034 is currently under fit out and not yet operational. |
(4) | We have issued a termination notice in relation to Farriers Yard – UK Smart cube facility to be surrendered in July 2024. |
(5) | We have issued a termination notice in relation to Vuram Shyamla Towers-3rd floor, Chennai for the facility to be surrendered in May 2024. |
(6) | We have issued a termination notice in realtion to Centrul de Afacer-8th floor, Romania for the facility to be surrendered in June 2024. |
(7) | We surrendered Regus Manchester Didsbury, UK facility in April 2024. |
(8) | We surrendered South Sackville, UK facility in April 2024. |
(9) | We surrendered Maximus Tower, IT Parks Hyderabad facility in April 2024. |
Our delivery centers are equipped with fiber optic connectivity and have backups to their power supply designed to achieve uninterrupted operations. In fiscal 2025, we intend to continue to streamline our operations by further consolidating production capacities in our delivery centers.
ITEM 4A. UNRESOLVED STAFF COMMENTS
None.
99
ITEM 5. OPERATING AND FINANCIAL REVIEW AND PROSPECTS
The following discussion on the financial condition and results of operations of our company should be read in conjunction with our consolidated financial statements and the related notes included elsewhere in this annual report. Some of the statements in the following discussion contain forward-looking statements that involve risks and uncertainties. See “Special Note Regarding Forward-Looking Statements.” Our actual results could differ materially from those anticipated in these forward-looking statements as a result of a number of factors, including, but not limited to, those described below and elsewhere in this annual report, particularly in the risk factors described in “Part I — Item 3 Key Information — D. Risk Factors.”
For a discussion of our results in fiscal 2023 compared to fiscal 2022 and certain comparative numbers in fiscal 2022, please refer to “Part I — Item 5. Operating and Financial Review and Prospects” contained in our Annual Report on Form 20-F for fiscal 2023 filed with the SEC on May 16, 2023.
Overview
We are a leading global provider of BPM services, offering comprehensive data, voice, analytical and business transformation services with a blended onshore, near shore and offshore delivery model. We transfer the business processes of our clients to our delivery centers, located in Canada, China, Costa Rica, India, Malaysia, the Philippines, Poland, Romania, South Africa, Sri Lanka, Turkey, the UK, and the US, with a view to offer cost savings, operational flexibility, improved quality and actionable insights to our clients. We seek to help our clients “transform” their businesses by identifying business and process optimization opportunities through technology-enabled solutions, improvements to their processes, global delivery capabilities, analytics and an understanding of their business.
We win outsourcing engagements from our clients based on our domain knowledge of their business, our experience in managing the specific processes they seek to outsource and our customer-centric approach. Effective April 1, 2023, we adopted a new organizational structure featuring four strategic business units (“SBUs”), each headed by a chief business officer. Under the new organizational structure, we combined our prior verticals into the four SBUs. The new structure is intended to help drive improved outcomes for global clients and enable us to better drive business synergies, enhance scalability, generate operating leverage, and create organizational depth. We now manage and report financial information through our four SBUs, which reflects how management reviews financial information and makes operating decisions.
Our operating segments, effective April 1, 2023, are as follows:
• | Banking/Financial Services, and Insurance (“BFSI”) SBU (comprising our prior banking and financial services, and insurance verticals), |
• | Travel, Shipping/Logistics, and Utilities (“TSLU”) SBU (comprising our prior travel and leisure, shipping and logistics, and utilities verticals), |
• | Manufacturing/Retail/Consumer, Hi-tech/Professional Services, and Procurement (“MRHP”) SBU (comprising our prior diversified businesses and hi-tech and professional services verticals), and |
• | Healthcare/Life Sciences (“HCLS”) SBU (comprising prior our healthcare vertical) |
Our portfolio of services includes specific processes that are tailored to address our clients’ specific business and industry practices. In addition, we offer a set of shared services that are common across multiple industries, including finance and accounting, customer experience services, research and analytics, technology services, legal services, and human resources outsourcing.
100
Although we typically enter into long-term contractual arrangements with our clients, these contracts can usually be terminated with or without cause by our clients and often with short notice periods. Nevertheless, our client relationships tend to be long-term in nature given the scale and complexity of the services we provide coupled with risks and costs associated with switching processes in-house or to other service providers. We structure each contract to meet our clients’ specific business requirements and our target rate of return over the life of the contract. In addition, since the sales cycle for offshore BPM is long and complex, it is often difficult to predict the timing of new client engagements. As a result, we may experience fluctuations in growth rates and profitability from quarter to quarter, depending on the timing and nature of new contracts. Our operating results may also differ significantly from quarter to quarter due to seasonal changes in the operations of our clients. For example, our clients in the TSLU segment typically experience seasonal changes in their operations in connection with the US summer holiday season, as well as episodic factors such as adverse weather conditions. Our focus, however, is on deepening our client relationships and maximizing shareholder value over the life of a client’s relationship with us.
The following table represents our revenue (a GAAP financial measure) for the periods indicated:
Year ended March 31, | ||||||||
2024 | 2023 | |||||||
(US dollars in millions) | ||||||||
Revenue |
$ | 1,323.4 | $ | 1,224.3 |
Our revenue is generated primarily from providing BPM services. We have four reportable segments for financial statement reporting purposes — BFSI, TSLU, MRHP and HCLS. In our BFSI segment, we provide “fault” repairs. For “fault” repairs, we provide claims handling and repair management services, where we arrange for automobile repairs through a network of third party repair centers. In our repair management services, where we act as the principal in our dealings with the third party repair centers and our clients, the amounts which we invoice to our clients for payments made by us to third party repair centers are reported as revenue. Where we are not the principal in providing the services, we record revenue from repair services net of repair cost. See Note 2(s) to our consolidated financial statements included elsewhere in this annual report. Since we wholly subcontract the repairs to the repair centers, we evaluate the financial performance of our “fault” repair business based on revenue less repair payments to third party repair centers, which is a non-GAAP financial measure. We believe that revenue less repair payments (a non-GAAP financial measure) for “fault” repairs reflects more accurately the value addition of the BPM services that we directly provide to our clients. Management believes that revenue less repair payments (non-GAAP) may be useful to investors as a more accurate reflection of our performance and operational results.
101
Revenue less repair payments is a non-GAAP financial measure which is calculated as (a) revenue less (b) in our BFSI segment, payments to repair centers for “fault” repair cases where we act as the principal in our dealings with the third party repair centers and our clients. This non-GAAP financial information is not meant to be considered in isolation or as a substitute for our financial results prepared in accordance with GAAP. Our revenue less repair payments (non-GAAP) may not be comparable to similarly titled measures reported by other companies due to potential differences in the method of calculation. The following table reconciles our revenue (a GAAP financial measure) to revenue less repair payments (a non-GAAP financial measure) for the periods indicated:
Year ended March 31, | ||||||||
2024 | 2023 | |||||||
(US dollars in millions) | ||||||||
Revenue |
$ | 1,323.4 | $ | 1,224.3 | ||||
Less: Payments to repair centers(1) |
39.1 | 62.2 | ||||||
|
|
|
|
|||||
Revenue less repair payments (non-GAAP) |
$ | 1,284.3 | $ | 1,162.0 | ||||
|
|
|
|
Note:
(1) | Consists of payments to repair centers in our BFSI segment for “fault” repair cases where we act as the principal in our dealings with the third party repair centers and our clients. |
The following table sets forth our constant currency revenue less repair payments (a non-GAAP financial measure) for the periods indicated. Constant currency revenue less repair payments is a non-GAAP financial measure. We present constant currency revenue less repair payments (non-GAAP) so that revenue less repair payments (non-GAAP) may be viewed without the impact of foreign currency exchange rate fluctuations, thereby facilitating period-to-period comparisons of business performance. Constant currency revenue less repair payments (non-GAAP) is presented by recalculating prior period’s revenue less repair payments (non-GAAP) denominated in currencies other than in US dollars using the foreign exchange rate used for the latest period, without taking into account the impact of hedging gains/losses. Our non-US dollar denominated revenue includes, but is not limited to, revenue denominated in pound sterling, the Australian dollar, the Euro and the South African rand. Management believes constant currency revenue less repair payments (non-GAAP) may be useful to investors in evaluating the underlying operating performance of our company. This non-GAAP financial information is not meant to be considered in isolation or as a substitute for our financial results prepared in accordance with GAAP. Our constant currency revenue less repair payments (non-GAAP) may not be comparable to similarly titled measures reported by other companies due to potential differences in the method of calculation.
Year ended March 31, | ||||||||
2024 | 2023 | |||||||
(US dollars in millions) | ||||||||
Revenue less repair payments (non-GAAP) |
$ | 1,284.3 | $ | 1,162.0 | ||||
Exchange rate impact |
5.0 | 11.4 | ||||||
|
|
|
|
|||||
Constant currency revenue less repair payments (non-GAAP) |
$ | 1,289.2 | $ | 1,173.4 | ||||
|
|
|
|
102
Additional Global Headquarters in New York and London
On January 18, 2024, we announced that we had added global headquarters locations in New York and London. The addition of these headquarters, alongside the existing Mumbai location, supports the decentralization of our senior leadership and decision-making as highlighted by our organizational structure change announced in April 2023. These new headquarters also reflect the evolution of our Company over the past 25 years, including the geographic diversification of our revenue mix and delivery footprint.
Global Economic Conditions
As we have operations in 13 countries and service clients across multiple geographic regions, our business, financial performance and results of operations depend significantly on worldwide macroeconomic and geo-political conditions. Recent economic conditions and geo-political developments have been and continue to be challenging for global economies and could materially and adversely affect our business and financial performance.
Economic factors, such as recessionary economic cycles, inflation, rising interest rates, fluctuations in foreign exchange rates, monetary tightening and volatility in the financial markets, have impacted, and may continue to impact, our business, financial condition and results of operations. The current global economic slowdown and the possibility of continued turbulence or uncertainty in the European, US, Asian and international financial markets and economies have adversely affected, and may continue to adversely affect, our and our clients’ liquidity and financial condition. High levels of inflation in the various geographies where we operate have resulted in increased supply costs, which in turn have impacted pricing and consumer demand. Rising interest rates, coupled with illiquid credit markets and wider credit spreads, may increase our cost of borrowing and cause credit to become more limited, which could have a material adverse effect on not only on our financial condition, liquidity and cash flows, but also on our clients’ ability to use credit to purchase our services or to make timely payments to us. In addition, as a result of high debt levels, a number of countries have required and may continue to require additional financial support, sovereign credit ratings have declined and may continue to decline, and there may be default on the sovereign debt obligations of certain countries. Uncertainties remain regarding future central bank and other economic policies in the US and EU. Such adverse macroeconomic conditions economic conditions may further lead to increased volatility in the currency and financial markets globally. For example, the recent appreciation of the US dollar may have an unpredictable impact on our company in a number of ways, including the conversion of our operating results into our reporting currency, the US dollar. For further information, see “Part I — Item 3. Key Information — D. Risk Factors — Risks Related to Our Business — Currency fluctuations among the Indian rupee, the pound sterling, the US dollar, the Australian dollar, the Euro, the South African rand and the Philippine peso could have a material adverse effect on our results of operations.” In addition, volatility in the financial markets could have a material impact on our share price. We cannot predict the trajectory of the recent economic slowdown or any subsequent economic recovery. If adverse macroeconomic conditions continue for a prolonged period of time or even worsen, our business, financial condition and results of operations will be adversely affected.
Government policies or objectives pursued by countries in which we do business could potentially impact the demand for our services in certain countries. Changes in trade policies, increases in tariffs, the imposition of retaliatory tariffs, including those implemented by the United States, China and Europe and legislation requiring greater oversight of supply chains, may have a material adverse effect on global economic conditions and the stability of global financial markets and may reduce international trade.
Geopolitical crises, such as war, political instability and terrorist attacks, could disrupt our operations. The conflict between Russia and Ukraine and the recent conflict between Israel and Hamas have led and could lead to significant market and other disruptions, including significant volatility in commodity prices, supply of energy resources, instability in financial markets, supply chain interruptions, political and social instability, changes in consumer or purchaser preferences as well as increase in cyberattacks and espionage. In particular, we have operations in Poland and Romania, which border Ukraine and have been materially and adversely affected by inflation, particularly increases in energy and food prices, resulting from disrupted supplies from Russia and Ukraine. In addition, as a result of the ongoing military conflict, there has been a growing number of migrants in Poland and Romania. Such an influx of migrants could further exacerbate inflation in these two countries, thereby resulting in an upward pressure on wages, which could have a material adverse effect on our operations in these two countries. The length, impact and outcome of the ongoing military conflict in Ukraine are highly unpredictable. If the conflict continues or extends beyond Ukraine, it would continue to have a significant impact on the global economy and our operations in Poland and Romania.
Additionally, major political events, including the UK’s withdrawal from the EU in January 2020, commonly referred to as “Brexit,” has also created uncertainty for businesses such as ours that operate in these markets. While the UK and the EU have ratified a trade and cooperation agreement to govern their relationship after Brexit, the agreement merely sets forth a framework in many respects and requires additional bilateral negotiations between the UK and the EU as both parties continue to work on the rules for implementation. Significant political and economic uncertainty remains about how the precise terms of the relationship between the parties will differ from the terms before withdrawal. Such terms could adversely affect the economic conditions in affected markets as well as the stability of the global financial markets, which in turn have had and may continue to have a material adverse effect on global economic conditions and financial markets, and may significantly reduce global market liquidity, restrict the ability of key market participants to operate in certain financial markets or restrict our access to capital. 24.2% of our revenues and 21.9% of our revenue less repair payments (non-GAAP) in fiscal 2024 and 25.4% of our revenues and 21.4% of our revenue less repair payments (non-GAAP) in fiscal 2023 were denominated in pound sterling. The extent and duration of the decline in the value of the pound sterling to the US dollar and other currencies is unknown at this time. A long-term reduction in the value of the pound sterling as a result of Brexit or otherwise could adversely impact our earnings growth rate and profitability. Although we believe that our hedging program is effective, there is no assurance that it will protect us against fluctuations in foreign currency exchange rates.
103
In addition to the pound sterling, a weakening of the rate of exchange for the US dollar or, to a lesser extent, the Australian dollar or the Euro (in which our revenue is principally denominated) against the Indian rupee, or to a lesser extent, the Philippine peso or the South African rand (in which a significant portion of our costs are denominated) would also adversely affect our results.
Fluctuations between the Indian rupee, the Philippine peso, the pound sterling, the South African rand, the Euro, or the Australian dollar, on the one hand, and the US dollar, on the other hand, also expose us to translation risk when transactions denominated in these currencies are translated into US dollars, our reporting currency. The exchange rates between each of the Indian rupee, the Philippine peso, the pound sterling, the South African rand, the Euro, and the Australian dollar, on the one hand, and the US dollar, on the other hand, have changed substantially in recent years and may fluctuate substantially in the future.
For example, in fiscal 2024, the Indian rupee depreciated against the US dollar by an average of 3.0%, the Philippine peso depreciated against the US dollar by an average of 1.0%, the South African rand depreciated against the US dollar by an average of 10.3%, the Australian dollar depreciated against the US dollar by an average of 4.0%, the Euro appreciated against the US dollar by an average of 4.1% and the pound sterling appreciated against the US dollar by an average of 4.2%.
The depreciation of the Indian rupee, the Philippine peso and the South African rand and the appreciation of the pound sterling and the Euro in each case against the US dollar in fiscal 2024 positively impacted our results of operations, whereas the depreciation of the Australian dollar against the US dollar negatively impacted our results of operations in fiscal 2024.
Impact of COVID-19
In May 2023, the World Health Organization declared that COVID-19 was no longer a global emergency. Countries around the world have also relaxed restrictions imposed over the past three years during the global outbreak of COVID-19, including the travel restrictions.
We have a business continuity planning mechanism in place and are actively working to understand our clients’ changing requirements, adapt delivery to a “hybrid” model, ensure data security, prioritize critical processes, adjust service levels and manage discretionary costs (such as travel costs) and fixed costs (such as personnel costs). Our “hybrid” delivery capability steadily improved throughout fiscal 2022 and fiscal 2023, from delivering over 80% of our clients’ requirements in April 2020 to 100% of our clients’ requirements in the second, third and fourth quarters of fiscal 2022 and throughout fiscal 2023 and 2024. In addition, we have also worked, and continue to work with national, state, and local authorities, so as to comply with applicable rules and regulations related to “hybrid” and “work from home” models. We will continue to assess the impact of the COVID-19 pandemic on the Company and respond accordingly.
104
In fiscal 2024, the pandemic did not have a significant impact on our results. In the longer term, while we remain confident in our business and the quality of our services, the magnitude of COVID-19’s impact to our business and financial performance in fiscal 2025 and beyond will be a function of several factors, including, but not limited to, the following:
• | the possibility of a resurgence of COVID-19 in the future and the duration that it takes for our clients’ businesses to stabilize and recover; |
• | the level of demand for services from clients across the industries, including the demand within their own customer base that we serve; |
• | our ability to implement policies and measures to ensure the health and safety of our employees; |
• | the impact and challenge of managing “remote working” arrangements on the effectiveness of our productivity or operating capability, due to varying local governmental regulations, client requirements, size and scale of operations and technology or infrastructure issues, such as hardware access, software compatibility and internet connectivity; and |
• | the volatility in exchange rate movements |
We continue to work closely with our clients to maximize our ability to service their rapidly changing business requirements.
As at March 31, 2024, we had cash and cash equivalents and investments of $244.3 million and outstanding long-term debt amounting to $139.2 million and we had utilized short-term lines of credit amounting to $40.0 million. The unutilized short term lines amounted to $134.1 million as at March 31, 2024. Based on our current level of operations, we expect that our anticipated cash generated from operating activities, cash and cash equivalents on hand, and use of existing credit facilities will be sufficient to fund our debt repayment obligations, estimated capital expenditures, share repurchases and working capital needs for the next 12 months. However, under the current challenging economic and business conditions as discussed under “— Global Economic Conditions,” there can be no assurance that our business activity would be maintained at the expected level to generate the anticipated cash flows from operations. Also, see “— Liquidity and Capital Resources” for more information.
Following the COVID-19 pandemic, more businesses globally continue to adopt delivery models with improved technology infrastructure, and incorporate elements of the “work from home” model. Countries may enact more flexible labor laws, which may potentially expand a company’s employee base to include a higher number of part-time and gig workers, such as independent contractors, online platform workers, contract firm workers and on-call workers. This may allow businesses such as ours to expand delivery models beyond the larger cities and into the smaller ones, for example, Tier 2 and Tier 3 cities in India.
105
Revenue
We generate revenue by providing BPM services to our clients. The following table shows our revenue (a GAAP financial measure) and revenue less repair payments (a non-GAAP financial measure) for the periods indicated:
Year ended March 31, | Change | |||||||||||||||
2024 | 2023 | $ | % | |||||||||||||
(US dollars in millions) | ||||||||||||||||
Revenue |
$ | 1,323.4 | $ | 1,224.3 | 99.1 | 8.1 | % | |||||||||
Revenue less repair payments (non-GAAP) |
$ | 1,284.3 | $ | 1,162.0 | 122.2 | 10.5 | % |
We have a large client base diversified across industries and geographies. As at March 31, 2024, we had a diverse client base of 690 clients (with each client contributing more than $0.01 million in revenue in fiscal 2024).
Our revenue is characterized by client, industry, service type, geographic and contract type diversity, as the analysis below indicates.
Revenue by Top Clients
In fiscal 2024 and 2023, the percentage of revenue and revenue less repair payments (non-GAAP) that we derived from our largest clients were in the proportions set forth in the following table:
As a percentage of revenue | As a percentage of revenue less repair payments (non-GAAP) |
|||||||||||||||
Year ended March 31, | Year ended March 31, | |||||||||||||||
2024 | 2023 | 2024 | 2023 | |||||||||||||
Top client |
4.9 | % | 6.5 | % | 5.1 | % | 6.8 | % | ||||||||
Top five clients |
20.9 | % | 23.8 | % | 21.6 | % | 25.0 | % | ||||||||
Top ten clients |
31.9 | % | 37.4 | % | 32.5 | % | 38.4 | % | ||||||||
Top twenty clients |
45.3 | % | 51.1 | % | 45.5 | % | 51.1 | % |
Revenue by SBUs
In fiscal 2024 and 2023, the percentage of revenue and revenue less repair payments (non-GAAP) that we derived from our SBUs were in the proportions set forth in the following table:
As a percentage of revenue | As a percentage of revenue less repair payments (non-GAAP) |
|||||||||||||||
Year ended March 31, | Year ended March 31, | |||||||||||||||
Strategic Business Unit |
2024 | 2023 | 2024 | 2023 | ||||||||||||
BFSI |
34.9 | % | 33.2 | % | 32.9 | % | 29.6 | % | ||||||||
TSLU |
30.7 | % | 30.7 | % | 31.6 | % | 32.4 | % | ||||||||
MRHP |
24.1 | % | 22.7 | % | 24.9 | % | 23.9 | % | ||||||||
HCLS |
12.5 | % | 15.3 | % | 12.9 | % | 16.1 | % | ||||||||
Reconciling item (1) |
(2.2 | )% | (1.9 | )% | (2.3 | )% | (2.0 | )% | ||||||||
|
|
|
|
|
|
|
|
|||||||||
Total |
100.0 | % | 100.0 | % | 100.0 | % | 100.0 | % | ||||||||
|
|
|
|
|
|
|
|
Note:
(1) | Revenue under reconciling items includes inter and intra segment eliminations and impact of foreign exchange fluctuations |
Certain services that we provide to our clients are subject to the seasonality of our clients’ business. Accordingly, we typically see an increase in transaction related services within the travel and leisure industry during holiday seasons, such as during the US summer holidays (our fiscal second quarter); an increase in business in the insurance industry during the beginning and end of the fiscal year (our fiscal first and last quarters) and during the US peak winter season (our fiscal third quarter); and an increase in business in the consumer product industry during the US festive season towards the end of the calendar year when new product launches and campaigns typically happen (our fiscal third quarter).
106
Revenue by Service Type
In fiscal 2024 and 2023, our revenue and revenue less repair payments (non-GAAP) were diversified across service types in the proportions set forth in the following table:
As a percentage of revenue | As a percentage of revenue less repair payments (non-GAAP) |
|||||||||||||||
Year ended March 31, | Year ended March 31, | |||||||||||||||
Service Type |
2024 | 2023 | 2024 | 2023 | ||||||||||||
Industry-specific(1) |
40.8 | % | 42.8 | % | 39.0 | % | 39.7 | % | ||||||||
Finance and accounting |
21.5 | % | 23.0 | % | 22.2 | % | 24.3 | % | ||||||||
Customer experience services |
20.2 | % | 19.4 | % | 20.8 | % | 20.4 | % | ||||||||
Research and analytics |
12.4 | % | 10.8 | % | 12.7 | % | 11.3 | % | ||||||||
Others(2) |
5.1 | % | 4.0 | % | 5.3 | % | 4.3 | % | ||||||||
|
|
|
|
|
|
|
|
|||||||||
Total |
100.0 | % | 100.0 | % | 100.0 | % | 100.0 | % | ||||||||
|
|
|
|
|
|
|
|
Note:
(1) | Previously, we presented revenue and revenue less repair payments (non-GAAP) generated from “auto claims” service type separately. Commencing fiscal first quarter ended June 30, 2023, in line with our new organization structure that we adopted effective April 1, 2023, we have included such revenue and revenue less repair payments (non-GAAP) under “industry-specific” service type. The revenues from “autoclaims” service type for the year ended March 31, 2023 have similarly been included under “industry-specific” service type for comparative purposes. |
(2) | Others includes revenue from technology services, legal services and human resources outsourcing services. |
107
Revenue by Geography
In fiscal 2024 and 2023, our revenue and revenue less repair payments (non-GAAP) were derived from the following geographies (based on the location of our clients) in the proportions set forth below in the following table:
As a percentage of revenue | As a percentage of revenue less repair payments (non-GAAP) |
|||||||||||||||
Year ended March 31, | Year ended March 31, | |||||||||||||||
Geography |
2024 | 2023 | 2024 | 2023 | ||||||||||||
North America (primarily the US) |
47.1 | % | 49.2 | % | 48.5 | % | 51.8 | % | ||||||||
UK |
28.3 | % | 28.7 | % | 26.2 | % | 24.9 | % | ||||||||
Europe (excluding the UK) |
8.3 | % | 7.1 | % | 8.5 | % | 7.4 | % | ||||||||
Australia |
6.5 | % | 6.1 | % | 6.7 | % | 6.4 | % | ||||||||
South Africa |
1.0 | % | 1.1 | % | 1.0 | % | 1.2 | % | ||||||||
Rest of world |
8.8 | % | 7.8 | % | 9.1 | % | 8.3 | % | ||||||||
|
|
|
|
|
|
|
|
|||||||||
Total |
100.0 | % | 100.0 | % | 100.0 | % | 100.0 | % | ||||||||
|
|
|
|
|
|
|
|
Our business in South Africa is evaluated for compliance with the South African government’s BBBEE legislation against a BBBEE scorecard, which has different levels based on various criteria. South African government grants are available to businesses that meet specified conditions, including achieving a specified minimum BBBEE rating. A level one BBBEE rating has the most rigorous criteria. Additionally, many South African companies require their service providers to maintain a minimum BBBEE rating, and many of our South African client contracts contain clauses that allow our clients to terminate their contracts with us or impose specified penalties on us if we do not maintain a minimum BBBEE rating.
We conduct our domestic business in South Africa (serving clients based in South Africa) through our South Africa subsidiary, WNS South Africa (Pty) Ltd, and our international business in South Africa (serving clients based outside South Africa) through our South Africa subsidiary, WNS Global Services SA (Pty) Limited. During fiscal 2020, pursuant to the requirements of the South African government’s BBBEE Codes of Good Practice, the WNS B-BBEE Staff Share Trust subscribed to one participating preference share issued by WNS Global Services SA (Pty) Ltd, which entitles it to 45.56% of voting rights in WNS South Africa (Pty) Ltd. In fiscal 2022, the voting rights were increased to 48.84% to help ensure WNS South Africa (Pty) Ltd maintains the same level. On April 19, 2024, WNS Global Services SA (Pty) Limited redeemed the one participating preference share on account of unwinding of Scheme B of WNS B-BBEE Staff Share Trust. We are currently working on a new ownership structure to ensure continued compliance with the requirements of the BBBEE legislation.
We achieved a level one rating in respect of WNS South Africa (Pty) Ltd in May 2023, which is valid until May 2024 and achieved a level seven rating in respect of WNS Global Services SA (Pty) Limited in June 2023 which is valid until June 2024. The BBBEE verification audit for WNS Global Services SA (Pty) Ltd is in process and the new rating is expected to be received by the end of May 2024. To help us achieve the requisite BBBEE rating for WNS Global Services SA (Pty) Limited, we have implemented a program that includes divesting some of our interests in such subsidiary to address the requirement relating to the percentage of ownership of an entity by “black people” (as defined under the applicable legislation). We expect to maintain a level one or achieve level two rating in respect of WNS South Africa (Pty) Ltd and maintain a rating between level six and eight in respect of WNS Global Services SA (Pty) Limited, which would help ensure that we continue to meet the minimum BBBEE rating required under our contracts with South African clients and be eligible for government grants associated with our domestic and international business. However, there is no assurance that WNS South Africa (Pty) Ltd or WNS Global Services SA (Pty) Limited will maintain their existing BBBEE ratings in the ongoing or future annual BBBEE verification audits. If we fail to maintain or achieve the required minimum BBBEE ratings, we will cease to be eligible for government grants, will be disqualified from bidding for certain business, and certain of our clients may terminate their contracts with us or impose penalties on us. These outcomes would have an adverse effect on our business, results of operations, financial condition and cash flows.
108
Revenue by Location of Delivery Centers
For fiscal 2024 and 2023, our revenue and revenue less repair payments (non-GAAP) were derived from the following geographies (based on the location of our delivery centers) in the proportions set forth in the following table:
As a percentage of revenue | As a percentage of revenue less repair payments (non-GAAP) |
|||||||||||||||
Year ended March 31, | Year ended March 31, | |||||||||||||||
Location of Delivery Center |
2024 | 2023 | 2024 | 2023 | ||||||||||||
India |
54.6 | % | 51.9 | % | 56.3 | % | 54.7 | % | ||||||||
Philippines |
14.3 | % | 13.5 | % | 14.7 | % | 14.2 | % | ||||||||
United States(1) |
12.0 | % | 15.2 | % | 12.4 | % | 16.0 | % | ||||||||
South Africa |
6.4 | % | 5.1 | % | 6.6 | % | 5.4 | % | ||||||||
UK(2) |
5.8 | % | 8.4 | % | 3.0 | % | 3.5 | % | ||||||||
Romania |
2.0 | % | 1.7 | % | 2.0 | % | 1.8 | % | ||||||||
Sri Lanka |
1.3 | % | 1.3 | % | 1.4 | % | 1.4 | % | ||||||||
China |
1.2 | % | 1.1 | % | 1.2 | % | 1.2 | % | ||||||||
Poland |
1.0 | % | 0.6 | % | 1.0 | % | 0.6 | % | ||||||||
Costa Rica |
0.6 | % | 0.4 | % | 0.7 | % | 0.5 | % | ||||||||
Australia(3) |
0.5 | % | 0.4 | % | 0.5 | % | 0.4 | % | ||||||||
Spain(4) |
0.3 | % | 0.4 | % | 0.2 | % | 0.3 | % | ||||||||
Malaysia |
0.0 | % | 0.0 | % | 0.0 | % | 0.0 | % | ||||||||
|
|
|
|
|
|
|
|
|||||||||
Total |
100.0 | % | 100.0 | % | 100.0 | % | 100.0 | % | ||||||||
|
|
|
|
|
|
|
|
Notes:
(1) | Includes revenue and revenue less repair payments (non-GAAP) derived from Canada, which were not significant. |
(2) | Includes revenue and revenue less repair payments (non-GAAP) derived from Turkey and Germany, which were not significant. |
(3) | Revenue from Australia is for processes being delivered under our “work from home” model. We do not have any delivery center in Australia. |
(4) | In March 2023, WNS closed its delivery center in Spain. Commencing fiscal first quarter ended June 30, 2023, revenue from Spain is for processes being delivered under our “work from home” model. We do not have any delivery center in Spain. |
Our Contracts
We provide our services under contracts with our clients, which typically range from three to five years, with some being rolling contracts with no end dates. Typically, these contracts can be terminated by our clients with or without cause and with short notice periods. However, we tend to have long-term relationships with our clients given the complex and comprehensive nature of the business processes executed by us, coupled with the switching costs and risks associated with relocating these processes in-house or to other service providers.
Each client contract has different terms and conditions based on the scope of services to be delivered and the requirements of that client. Occasionally, we may incur significant costs on certain contracts in the early stages of implementation, with the expectation that these costs will be recouped over the life of the contract to achieve our targeted returns. Each client contract has corresponding service level agreements that define certain operational metrics based on which our performance is measured. Some of our contracts specify penalties or damages payable by us in the event of failure to meet certain key service level standards within an agreed upon time frame.
When we are engaged by a client, we typically transfer that client’s processes to our delivery centers over a six-month period. This transfer process is subject to a number of potential delays. Therefore, we may not recognize significant revenue until several months after commencing a client engagement.
109
We charge for our services based on the following pricing models:
1) | per full-time-equivalent arrangements, which typically involve billings based on the number of full-time employees (or equivalent) deployed on the execution of the business process outsourced; |
2) | per transaction arrangements, which typically involve billings based on the number of transactions processed (such as the number of e-mail responses, or airline coupons or insurance claims processed); |
3) | subscription arrangements, which typically involve billings based on per member per month, based on contractually agreed rates; |
4) | fixed-price arrangements, which typically involve billings based on achievements of pre-defined deliverables or milestones; |
5) | outcome-based arrangements, which typically involve billings based on the business result achieved by our clients through our service efforts (such as measured based on a reduction in days sales outstanding, an improvement in working capital, an increase in collections or a reduction in operating expenses); or |
6) | other pricing arrangements, including cost-plus arrangements, which typically involve billing the contractually agreed direct and indirect costs and a fee based on the number of employees deployed under the arrangement. |
Apart from the above-mentioned pricing methods, a small portion of our revenue is comprised of reimbursements of out-of-pocket expenses incurred by us in providing services to our clients.
Outcome-based arrangements are examples of non-linear pricing models where revenues from platforms and solutions and the services we provide are linked to usage or savings by clients rather than the efforts deployed to provide these services. We intend to focus on increasing our service offerings that are based on non-linear pricing models that allow us to price our services based on the value we deliver to our clients rather than the headcount deployed to deliver the services to them. We believe that non-linear pricing models help us to grow our revenue without increasing our headcount. Accordingly, we expect increased use of non-linear pricing models to result in higher revenue per employee and improved margins. Non-linear revenues may be subject to short-term pressure on margins, however, as initiatives in developing the products and services take time to deliver. Moreover, in outcome-based arrangements, we bear the risk of failure to achieve clients’ business objectives in connection with these projects. For more information, see “Part I — Item 3. Key Information — D. Risk Factors — Risks Related to Our Business – If our pricing structures do not accurately anticipate the cost and complexity of performing our work, our profitability may be negatively affected.”
110
Revenue by Contract Type
For fiscal 2024 and 2023, our revenue and revenue less repair payments (non-GAAP) were diversified by contract type in the proportions set forth in the following table:
As a percentage of revenue | As a percentage of revenue less repair payments (non-GAAP) |
|||||||||||||||
Year ended March 31, | Year ended March 31, | |||||||||||||||
Revenue by Contract type |
2024 | 2023 | 2024 | 2023 | ||||||||||||
Full-time-equivalent |
71.2 | % | 67.7 | % | 73.4 | % | 71.4 | % | ||||||||
Transaction |
14.3 | % | 14.8 | % | 11.7 | % | 10.2 | % | ||||||||
Subscription |
5.1 | % | 7.7 | % | 5.3 | % | 8.1 | % | ||||||||
Fixed price |
5.1 | % | 5.5 | % | 5.3 | % | 5.8 | % | ||||||||
Others (1) |
4.3 | % | 4.3 | % | 4.3 | % | 4.5 | % | ||||||||
|
|
|
|
|
|
|
|
|||||||||
Total |
100.0 | % | 100.0 | % | 100.0 | % | 100.0 | % | ||||||||
|
|
|
|
|
|
|
|
Note:
(1) | Others includes revenue from “outcome-based arrangements”, which typically involve billings based on the business result achieved by our clients through our service efforts (such as a reduction in days sales outstanding, an improvement in working capital, an increase in collections or a reduction in operating expenses). |
111
Expenses
The majority of our expenses consist of cost of revenue and operating expenses. The key components of our cost of revenue are employee costs, payments to repair centers, facilities costs, depreciation, legal and professional costs, and travel expenses. Our operating expenses include selling and marketing expenses, general and administrative expenses, foreign exchange gains and losses and amortization of intangible assets. Our non-operating expenses include finance expenses as well as other expenses recorded under “other income, net.”
Cost of Revenue
Employee costs represent the largest component of cost of revenue. In addition to employee salaries, employee costs include costs related to recruitment, training and retention, and share-based compensation expense. Historically, our employee costs have increased primarily due to increases in the number of employees to support our growth and, to a lesser extent, to recruit, train and retain employees. Salary levels in India and our ability to efficiently manage and retain our employees significantly influence our cost of revenue. See “Part I — Item 4. Information on the Company — B. Business Overview — Human Capital.” Regulatory developments may, however, result in wage increases in India and increase our cost of revenue.
For example, the Code on Wages 2019, Industrial Relations Code 2020, Social Security Code 2020 and Occupational Safety, Health & Working Condition Code 2020 received assent from the President of India on September 28, 2020. However, the rules implementing these Acts have not yet been published and the effective date from which these changes are applicable has yet to be announced. Accordingly, while we are unable to ascertain with certainty the financial impact due to these changes, it is possible that our wage costs in India may increase as a result of these changes when they become effective. See “Part I — Item. 3. Key Information. — D. Risk Factors — Risks Related to Our Business — Wage increases may prevent us from sustaining our competitive advantage and may reduce our profit margin.” We seek to mitigate these cost increases through improvements in employee productivity, employee retention and asset utilization.
Our facilities costs comprise lease rentals, utilities cost, facilities management and telecommunication network cost. Most of our leases for our facilities are long-term agreements and have escalation clauses which provide for increases in rent at periodic intervals. Most of these agreements have clauses that have fixed escalation of lease rentals.
We create capacity in our operational infrastructure ahead of anticipated demand as it takes six to nine months to build up a new site. Hence, our cost of revenue as a percentage of revenue may be higher during periods in which we carry such additional capacity.
Once we are engaged by a client in a new contract, we normally have a transition period to transfer the client’s processes to our delivery centers and accordingly incur costs related to such transfer.
Selling and Marketing Expenses
Our selling and marketing expenses comprise primarily employee costs for sales and marketing personnel, share-based compensation expense, brand building expenses, legal and professional fees, travel expenses, and other general expenses relating to selling and marketing.
Selling and marketing expenses as a proportion of revenue was 5.9% in fiscal 2024 as compared with 5.2% for fiscal 2023. Selling and marketing expenses as a proportion of revenue less repair payments (non-GAAP) was 6.1% in fiscal 2024 as compared with 5.5% for fiscal 2023.
112
General and Administrative Expenses
Our general and administrative expenses comprise primarily employee costs for senior management and other support personnel, share-based compensation expense, legal and professional fees, travel expenses, and other general expenses not related to cost of revenue and selling and marketing.
General and administrative expenses as a proportion of revenue was 13.9% in fiscal 2024 as compared with 13.8% in fiscal 2023. General and administrative expenses as a proportion of revenue less repair payments (non-GAAP) was 14.3% in fiscal 2024 as compared with 14.6% in fiscal 2023.
Foreign Exchange Loss / (Gain), Net
Foreign exchange loss / (gain), net include:
• | marked to market gains or losses on derivative instruments that do not qualify for “hedge” accounting and are deemed ineffective; |
• | realized foreign currency exchange gains or losses on settlement of transactions in foreign currency and derivative instruments; and |
• | unrealized foreign currency exchange gains or losses on revaluation of other assets and liabilities. |
We had a foreign exchange gain of $0.7 million in fiscal 2024 as compared to a gain of $1.0 million in fiscal 2023.
Amortization of Intangible Assets
Amortization of intangible assets is primarily associated with our acquisitions of Fusion in June 2012, Value Edge in June 2016, Denali in January 2017, HealthHelp in March 2017, Vuram in July 2022, The Smart Cube in December 2022, OptiBuy in December 2022 and amortization of intangible assets associated with business transfers from CEPROCS in December 2021 and a large insurance company in October 2022.
Other Income, Net
Other income, net comprises interest income, income from investments, reversal of acquisition related contingent consideration, gain or loss on sale of assets and other miscellaneous income and expenses.
Finance Expense
Finance expense primarily relates to interest charges payable on our term loans and short-term borrowings, transaction costs and gains/losses on settlement of related derivative instruments. On adoption of IFRS 16, with effect from April 1, 2019, interest expense on lease liabilities is reflected in this line item. It includes changes in the fair value of contingent consideration relating to our acquisitions.
113
Operating Data
Our profit margin is largely a function of our asset utilization and the rates we are able to recover for our services. One of the most significant components of our asset utilization is our seat utilization rate which is the average number of work shifts per day, out of a maximum of three, for which we are able to utilize our seats. Generally, an improvement in seat utilization rate will improve our profitability unless there are other factors which increase our costs such as an increase in lease rentals, large ramp-ups to build new seats, and increases in costs related to repairs and renovations to our existing or used seats. In addition, an increase in seat utilization rate as a result of an increase in the volume of work will generally result in a lower cost per seat and a higher profit margin as the total fixed costs of our built up seats remain the same while each seat is generating more revenue.
The following table presents certain operating data as at the dates indicated:
As at March 31, | ||||||||
2024 | 2023 | |||||||
Total headcount |
60,125 | 59,755 | ||||||
Built up seats(1) |
41,599 | 37,222 | ||||||
Used seats(1) |
— | — | ||||||
Seat utilization rate(1) (2) |
— | — |
Notes:
(1) | “Built up seats” refers to the total number of production seats (excluding support functions like finance, human resources, administration and seats dedicated for business continuity planning) that are set up in any premises. “Used seats” refers to the number of built up seats that are being used by employees. The remainder would be termed “vacant seats.” The vacant seats would get converted into used seats when we increase headcount. |
The service delivery capacities of our remote-working employees may not be equivalent to their normal capacities when working in our delivery centers.
The “hybrid” model continued to be used in fiscal 2024 and fiscal 2023. Accordingly, the used seats details and seat utilization rate details are not relevant for fiscal 2024 and fiscal 2023. However, we have made significant progress towards in-person operations averaging 68% “work from office” during fiscal 2024.
(2) | The seat utilization rate is calculated by dividing the average total headcount by the average number of built up seats to show the rate at which we are able to utilize our built up seats. Average total headcount and average number of built up seats are calculated by dividing the aggregate of the total headcount or number of built up seats, as the case may be, as at the beginning and end of the fiscal year by two. |
Our total headcount and built up seats increased from March 31, 2023 to March 31, 2024 primarily in line with our revenue growth and higher work from office
We expect our total headcount in fiscal 2025 to increase as compared to fiscal 2024 as the impact of an increased flow of business from new and existing clients is expected to continue to increase our hiring requirements in fiscal 2025.
Foreign Exchange
Exchange Rates
We report our financial results in US dollars and our results of operations would be adversely affected if the pound sterling or, to a lesser extent, the Euro or the Australian dollar depreciates against the US dollar, or if the Indian rupee or, to a lesser extent, the Philippine peso or the South African rand appreciates against the US dollar. Although a substantial portion of our revenue and revenue less repair payments (non-GAAP) is denominated in US dollars (59.3% and 61.1%, respectively, in fiscal 2024 and 59.4% and 62.6%, respectively, in fiscal 2023), pound sterling (24.2% and 21.9%, respectively, in fiscal 2024 and 25.4% and 21.4%, respectively, in fiscal 2023), and, to a lesser extent, the Euro (7.4% and 7.6%, respectively, in fiscal 2024 and 6.4% and 6.8%, respectively, in fiscal 2023), the Australian dollars (6.0% and 6.2%, respectively, in fiscal 2024 and 5.7% and 6.0%, respectively, in fiscal 2023), and the South African rand (0.9% and 1.0%, respectively, in fiscal 2024 and 1.1% and 1.1%, respectively, in fiscal 2023), most of our expenses (net of payments to repair centers) are incurred and paid in Indian rupees (45.9% in fiscal 2024 and 46.0% in fiscal 2023) and, to a lesser extent, in the Philippine peso (11.7% in fiscal 2024 and 11.8% in fiscal 2023) and the South African rand (5.9% in fiscal 2024 and 5.2% in fiscal 2023). The exchange rates between these currencies and the US dollar have changed substantially in recent years and may fluctuate substantially in the future.
114
The average Indian rupee to US dollar exchange rate was approximately ₹83.04 per $1.00 in fiscal 2024, which represented a depreciation of the Indian rupee of 3.0% as compared with the average exchange rate of ₹80.33 per $1.00 in fiscal 2023, which in turn represented a depreciation of the Indian rupee of 7.8% as compared with the average exchange rate of approximately ₹74.49 per $1.00 in fiscal 2022.
The average pound sterling to US dollar exchange rate was approximately £0.80 per $1.00 in fiscal 2024, which represented an appreciation of the pound sterling of 4.2% as compared with the average exchange rate of approximately £0.83 per $1.00 in fiscal 2023, which in turn represented an depreciation of the pound sterling of 11.8% as compared with the average exchange rate of approximately £0.73 per $1.00 in fiscal 2022.
The average Australian dollar to US dollar exchange rate was approximately A$1.52 per $1.00 in fiscal 2024, which represented a depreciation of the Australian dollar of 4.0% as compared with the average exchange rate of approximately A$1.46 per $1.00 in fiscal 2023, which in turn represented an depreciation of the Australian dollar of 7.3% as compared with the average exchange rate of approximately A$1.35 per $1.00 in fiscal 2022.
The average Euro to US dollar exchange rate was approximately €0.92 per $1.00 in fiscal 2024, which represented an appreciation of the Euro of 4.1% as compared with the average exchange rate of approximately €0.96 per $1.00 in fiscal 2023, which in turn represented a depreciation of the Euro of 10.4% as compared with the average exchange rate of approximately €0.860 per $1.00 in fiscal 2022.
The average South African rand to US dollar exchange rate was approximately R18.73 per $1.00 in fiscal 2024, which represented a depreciation of the South African rand of 10.3% as compared with the average exchange rate of approximately R16.98 per $1.00 in fiscal 2023, which in turn represented an depreciation of the South African rand of 14.4% as compared with the average exchange rate of approximately R14.85 per $1.00 in fiscal 2022.
The average Philippine peso to US dollar exchange rate was approximately PHP55.90 per $1.00 in fiscal 2024, which represented a depreciation of the Philippine peso of 1.0% as compared with the average exchange rate of approximately PHP55.32 per $1.00 in fiscal 2023, which in turn represented a depreciation of the Philippine peso of 10.5% as compared with the average exchange rate of approximately PHP50.07 per $1.00 in fiscal 2022.
The depreciation of the Indian rupee, Philippine peso and the South African rand against the US dollar in fiscal 2024 and the appreciation of the pound sterling, the Euro against the US dollar in fiscal 2024, positively impacted our results of operations whereas the depreciation the Australian dollar against the US dollar negatively impacted our results of operations during the year. Increases in our cost of revenue, and other expenses were partially offset by the positive impact of the depreciation of Indian rupee in fiscal 2024. The depreciation of the Indian rupee, Philippine peso and the South African rand against the US dollar in fiscal 2023 positively impacted our results of operations whereas the depreciation of the pound sterling, the Euro and the Australian dollar in each case against the US dollar negatively impacted ourresults of operations during the year. See “Part I — Item 11. Quantitative and Qualitative Disclosures About Market Risk — B. Risk Management Procedures — Components of Market Risk — Exchange Rate Risk.”
We have subsidiaries in several countries and hence, the functional currencies of these entities differ from our reporting currency, the US dollar. The financial statements of these entities are translated to the reporting currency as at the balance sheet date. Adjustments resulting from the translation of these financial statements from functional currency to reporting currency are accumulated and reported as other comprehensive income/(loss), which is a separate component of equity and such exchange differences are recognized in our consolidated statement of income in the period in which such subsidiaries are disposed. Foreign currency transaction gains and losses are recorded as other income or expense.
115
Currency Regulation
Our Indian subsidiaries are registered as exporters of BPM services with STPI or Special Economic Zone (“SEZ”). According to the prevailing foreign exchange regulations in India, an exporter of BPM services registered with STPI or SEZ is required to receive its export proceeds in India within a period of nine months from the date of such exports in order to avail itself of the tax and other benefits. In the event that such a registered exporter has received any advance against exports in foreign exchange from its overseas customers, it is required to render the requisite services so that such advances are earned within a period of one year from the date of such receipt. If such a registered exporter does not meet these conditions, it will be required to obtain permission from the Reserve Bank of India to receive and realize such foreign currency earnings.
A majority of the payments we receive from our clients are denominated in pound sterling and US dollars. For most of our clients, our subsidiaries in Mauritius, the Netherlands, Australia, the UK and the US enter into contractual agreements directly with our clients for the provision of BPM services by our Indian subsidiaries, which hold the foreign currency receipts in an export earners’ foreign currency account. All foreign exchange requirements, such as for the import of capital goods, expenses incurred during overseas travel by employees and discharge of foreign exchange expenses or liabilities, can be met using the foreign currency in the export earners’ foreign currency account in India. As and when funds are required by us, the funds in the export earners’ foreign currency account may be transferred to an ordinary rupee-denominated account in India.
There are currently no Jersey, UK or US foreign exchange control restrictions on the payment of dividends on our ordinary shares or on the conduct of our operations.
Income Taxes
We operate in multiple tax jurisdictions including Australia, China, Costa Rica, Canada, France, Germany, India, Ireland, Mauritius, Malaysia, Mexico, the Netherlands, New Zealand, the Philippines, Poland, Portugal, Romania, Singapore, South Africa, Spain, Sri Lanka, Switzerland, Turkey, United Arab Emirates, the UK and the US. As a result, our effective tax rate changes from year to year based on recurring factors such as the geographical mix of income before taxes, state and local taxes, the ratio of permanent items to pre-tax book income and the implementation of various global tax strategies, as well as non-recurring events.
In fiscal 2024, 2023 and 2022, our tax rate in India, the Philippines and Sri Lanka impacted our effective tax rate. We would have incurred approximately $10.3 million, $20.7 million and $20.9 million in additional income tax expense on our combined operations in our SEZ operations in India, the Philippines and Sri Lanka in fiscal 2024, 2023 and 2022 respectively, if the tax holidays and exemptions described below had not been available for the respective periods.
We expect our tax rate in India, the Philippines and Sri Lanka to continue to impact our effective tax rate. Our tax rate in India has been impacted by the reduction in the tax exemption enjoyed by our delivery center operating under the SEZ scheme as discussed below. In fiscal 2024, we operated from various delivery centers in the Philippines which commenced operations from fiscal 2018 to fiscal 2024 and are eligible for tax exemption benefits expiring between fiscal 2024 and fiscal 2029. Following the expiry of the tax benefits, income generated by the Philippines subsidiary will be taxed at the prevailing special tax rate, which currently is 5.0% on gross profit. As per CREATE which is effective from April 2021, enterprises will be taxed at 5% on gross profit for a fixed period of 10 years. Also, any changes in the regulations relating to work from home arrangements may impact the tax exemption benefits available to our Philippines subsidiary. From January 1, 2020, our operations in Sri Lanka are eligible to claim income tax exemption with respect to the profits earned from export revenue, as more fully described below.
116
India
In the past, the majority of our Indian operations were eligible to claim income tax exemption with respect to profits earned from export revenue from operating units registered under the STPI. The benefit was available for a period of 10 years from the date of commencement of operations, but not beyond March 31, 2011. Effective April 1, 2011, upon the expiration of this tax exemption, income derived from our operations in India became subject to the prevailing annual tax rate, which was 34.95% in fiscal 2024, 2023 and 2022.
In 2005, the Government of India implemented the SEZ legislation, with the effect that taxable income of new operations established in designated SEZs may be eligible for a 15-year tax holiday scheme consisting of a complete tax holiday for the initial five years and a partial tax holiday for the subsequent ten years, subject to the satisfaction of certain capital investment conditions in the last five years. From fiscal 2012 until fiscal 2022, the Company started operations in various delivery centers in Mumbai, Pune, Chennai, Gurgaon and Noida, India that were registered under the SEZ scheme. Some of these operations are eligible for a 100% income tax exemption for a period of five years from the date of commencement of operations, which are set to expire between fiscal 2022 and fiscal 2024. Following the expiry of the 100% income tax exemption, these operations are eligible for a 50% income tax exemption which are set to expire between fiscal 2026 and fiscal 2034. Such income tax exemption are only eligible for business units and operations set up under the SEZ legislation on or before March 31, 2020.
The Government of India may enact new tax legislation that could impact the way we are taxed in the future. For example, the change in the law in fiscal 2017 has resulted in any new business units or operation units set up under the SEZ legislation after March 31, 2020 not being eligible for the same income tax holidays that our existing SEZ operations currently enjoy. See “Part I — Item 3. Key Information — D. Risk Factors — Risks Related to Key Delivery Locations — Tax legislation and the results of actions by taxing authorities may have an adverse effect on our operations and our overall tax rate”.
Philippines
In fiscal 2024, we operated from various delivery centers in the Philippines which commenced operations from fiscal 2018 to fiscal 2024 and are eligible for tax exemption benefits expiring between fiscal 2024 and fiscal 2029. Following the expiry of the tax benefits, income generated by the Philippines subsidiary will be taxed at the prevailing special tax rate, which currently is 5.0% on gross profit. As per CREATE which is effective from April 2021, enterprises will be taxed at 5% on gross profit for a fixed period of 10 years.
Any changes in the regulations relating to work-from-home arrangements may impact the tax exemption benefits available to our Philippines subsidiary.
Sri Lanka
From January 1, 2020, our operations in Sri Lanka are eligible to claim income tax exemption with respect to the profits earned from export revenue.
117
Results of Operations
The following table sets forth certain financial information as a percentage of revenue and revenue less repair payments (non-GAAP) for the periods indicated:
As a percentage of | ||||||||||||||||
Revenue | Revenue less repair payments (non-GAAP) |
|||||||||||||||
Year ended March 31, | Year ended March 31, | |||||||||||||||
2024 | 2023 | 2024 | 2023 | |||||||||||||
Cost of revenue |
63.8 | % | 65.5 | % | 62.7 | % | 63.6 | % | ||||||||
Gross profit |
36.2 | % | 34.5 | % | 37.3 | % | 36.4 | % | ||||||||
Operating expenses: |
||||||||||||||||
Selling and marketing expenses |
5.9 | % | 5.2 | % | 6.1 | % | 5.5 | % | ||||||||
General and administrative expenses |
13.9 | % | 13.8 | % | 14.3 | % | 14.6 | % | ||||||||
Foreign exchange loss / (gain), net |
(0.1 | )% | (0.1 | )% | (0.1 | )% | (0.1 | )% | ||||||||
Impairment of intangible assets |
2.3 | % | — | % | 2.4 | % | — | % | ||||||||
Amortization of intangible assets |
2.5 | % | 1.9 | % | 2.6 | % | 2.0 | % | ||||||||
Operating profit |
11.6 | % | 13.7 | % | 11.9 | % | 14.4 | % | ||||||||
Other income, net |
(3.0 | )% | (1.3 | )% | (3.1 | )% | (1.4 | )% | ||||||||
Finance expense |
2.2 | % | 1.5 | % | 2.3 | % | 1.6 | % | ||||||||
Income tax expense |
1.8 | % | 2.2 | % | 1.8 | % | 2.3 | % | ||||||||
Profit after tax |
10.6 | % | 11.2 | % | 10.9 | % | 11.8 | % |
The following table reconciles revenue (a GAAP financial measure) to revenue less repair payments (a non-GAAP financial measure) and sets forth payments to repair centers and revenue less repair payments (non-GAAP) as a percentage of revenue for the periods indicated:
Year ended March 31, | ||||||||||||||||
2024 | 2023 | 2024 | 2023 | |||||||||||||
(US dollars in millions) | ||||||||||||||||
Revenue |
$ | 1,323.4 | $ | 1,224.3 | 100.0 | % | 100.0 | % | ||||||||
Less: Payments to repair centers |
39.1 | 62.2 | 3.0 | % | 5.1 | % | ||||||||||
|
|
|
|
|
|
|
|
|||||||||
Revenue less repair payments (non-GAAP) |
$ | 1,284.3 | $ | 1,162.0 | 97.0 | % | 94.9 | % | ||||||||
|
|
|
|
|
|
|
|
118
The following table presents our results of operations for the periods indicated:
Year ended March 31, | ||||||||
2024 | 2023 | |||||||
(US dollars in millions) | ||||||||
Revenue |
$ | 1,323.4 | $ | 1,224.3 | ||||
Cost of revenue(1) |
844.9 | 801.5 | ||||||
|
|
|
|
|||||
Gross profit |
478.4 | 422.7 | ||||||
Operating expenses: |
||||||||
Selling and marketing expenses(2) |
78.3 | 63.5 | ||||||
General and administrative expenses(3) |
183.6 | 169.3 | ||||||
Foreign exchange loss / (gains), net |
(0.7 | ) | (1.0 | ) | ||||
Impairment of intangible assets |
30.9 | — | ||||||
Amortization of intangible assets |
33.0 | 23.6 | ||||||
|
|
|
|
|||||
Operating profit |
153.3 | 167.3 | ||||||
|
|
|
|
|||||
Other income, net |
(39.4 | ) | (16.0 | ) | ||||
Finance expense |
29.1 | 18.8 | ||||||
|
|
|
|
|||||
Profit before income taxes |
163.6 | 164.5 | ||||||
Income tax expense |
23.4 | 27.2 | ||||||
|
|
|
|
|||||
Profit after tax |
$ | 140.1 | $ | 137.3 | ||||
|
|
|
|
Notes:
(1) | Includes share-based compensation expense of $10.0 million in fiscal 2024 and $8.1 million in fiscal 2023. |
(2) | Includes share-based compensation expense of $7.0 million in fiscal 2024 and $6.4 million in fiscal 2023. |
(3) | Includes share-based compensation expense of $34.6 million in fiscal 2024 and $35.3 million in fiscal 2023. |
119
Fiscal 2024 Compared to Fiscal 2023
Revenue
The following table sets forth our revenue and percentage change in revenue for the periods indicated:
Year ended March 31, | ||||||||||||||||
2024 | 2023 | Change | % Change | |||||||||||||
(US dollars in millions) | ||||||||||||||||
Revenue |
$ | 1,323.4 | $ | 1,224.3 | $ | 99.1 | 8.1 | % |
The increase in revenue of $99.1 million was primarily attributable to an increase in revenue from existing clients of $121.1 million (including revenue of $46.8 million from Vuram, The Smart Cube and OptiBuy which we acquired on July 1, 2022, December 16, 2022 and December 14, 2022, respectively) and an appreciation of the pound sterling and the Euro by an average of 4.2% and 4.1%, respectively, against the US dollar in fiscal 2024, as compared to the respective average exchange rates in fiscal 2023. The increase was partially offset by lower revenues from new clients of $19.2 million and higher hedging loss on our revenue by $2.8 million to a loss of $5.0 million in fiscal 2024 from a loss of $2.2 million in fiscal 2023. The increase in revenue was primarily attributable to higher revenues in our BFSI, MRHP and TSLU segments, partially offset by lower revenues in our HCLS segment. The decrease in revenues in our HCLS segment was in part attributable to the ramp-down of a large healthcare process for a client.
Revenue by Geography
The following table sets forth the composition of our revenue based on the location of our clients in our key geographies for the periods indicated:
Revenue | As a percentage of revenue |
|||||||||||||||
Year ended March 31, | ||||||||||||||||
2024 | 2023 | 2024 | 2024 | |||||||||||||
(US dollars in millions) | ||||||||||||||||
North America (primarily the US) |
$ | 623.4 | $ | 602.5 | 47.1 | % | 49.2 | % | ||||||||
UK |
375.0 | 351.0 | 28.3 | % | 28.7 | % | ||||||||||
Europe (excluding the UK) |
109.2 | 86.5 | 8.3 | % | 7.1 | % | ||||||||||
Australia |
86.0 | 74.7 | 6.5 | % | 6.1 | % | ||||||||||
South Africa |
13.4 | 13.5 | 1.0 | % | 1.1 | % | ||||||||||
Rest of world |
116.4 | 96.0 | 8.8 | % | 7.8 | % | ||||||||||
|
|
|
|
|
|
|
|
|||||||||
Total |
$ | 1,323.4 | $ | 1,224.3 | 100.0 | % | 100.0 | % | ||||||||
|
|
|
|
|
|
|
|
The increase in revenue from the UK region was primarily attributable to higher revenues in our TSLU, MRHP and HCLS segments and an appreciation of the pound sterling against the US dollar by an average of 4.2% for fiscal 2024 as compared to the average exchange rate for fiscal 2023, partially offset by lower revenue in our BFSI segment. The increase in revenue from the Europe (excluding the UK) region was primarily attributable to higher revenues in all our segments and an appreciation of the Euro against the US dollar by an average of 4.1% for fiscal 2024 as compared to the average exchange rate for fiscal 2023. The increase in revenue in the North America (primarily the US) region was primarily attributable to higher revenues in our BFSI and MRHP segments, partially offset by lower revenues in our HCLS and TSLU segments. The increase in revenue from the rest of world region was primarily attributable to higher revenues in all our segments. The increase in revenue from the Australia region was primarily attributable to higher revenues in our BFSI, TSLU and MRHP segments, partially offset by lower revenues in our HCLS segment, and a depreciation of the Australian dollar against the US dollar by an average of 4.0% for fiscal 2024, as compared to the average exchange rate in fiscal 2023. The decrease in revenue from the South Africa region was primarily attributable to lower revenues in our TSLU segment and a depreciation of the South African rand against the US dollar by an average of 10.3% for fiscal 2024, as compared to the average exchange rate in fiscal 2023, partially offset by higher revenues in our MRHP and BFSI segments.
120
Revenue Less Repair Payments (non-GAAP)
The following table sets forth our revenue less repair payments (non-GAAP) and percentage change in revenue less repair payments (non-GAAP) for the periods indicated:
Year ended March 31, | ||||||||||||||||
2024 | 2023 | Change | % Change | |||||||||||||
(US dollars in million) | ||||||||||||||||
Revenue less repair payments (non-GAAP) |
$ | 1,284.3 | $ | 1,162.0 | $ | 122.2 | 10.5 | % |
The increase in revenue less repair payments (non-GAAP) of $122.2 million was primarily attributable to an increase in revenue less repair payments (non-GAAP) from existing clients of $143.4 million, (including revenue of $46.8 million from Vuram, The Smart Cube and OptiBuy which we acquired on July 1, 2022, December 16, 2022 and December 14, 2022, respectively) and an appreciation of the pound sterling and the Euro by an average of 4.2% and 4.1%, respectively, against the US dollar in fiscal 2024, as compared to the respective average exchange rates in fiscal 2023. The increase was partially offset by lower revenue less repair payments (non-GAAP) from new clients of $18.3 million and a higher hedging loss on our revenue by $2.8 million to a loss of $5.0 million in fiscal 2024 from a loss of $2.2 million in fiscal 2023. The increase in revenue was primarily attributable to higher revenues in our BFSI, MRHP and TSLU segments, partially offset by lower revenues in our HCLS segment. The decrease in revenues in our HCLS segment was in part attributable to the ramp-down of a large healthcare process for a client.
Revenue Less Repair Payments (non-GAAP) by Geography
The following table sets forth the composition of our revenue less repair payments (non-GAAP) based on the location of our clients in our key geographies for the periods indicated:
Revenue less repair payments (non-GAAP) |
As a percentage of revenue less repair payments (non-GAAP) |
|||||||||||||||
Year ended March 31, | ||||||||||||||||
2024 | 2023 | 2024 | 2023 | |||||||||||||
(US dollars in millions) | ||||||||||||||||
North America (primarily the US) |
$ | 623.4 | $ | 602.5 | 48.5 | % | 51.8 | % | ||||||||
UK |
335.9 | 288.8 | 26.2 | % | 24.9 | % | ||||||||||
Europe (excluding the UK) |
109.2 | 86.5 | 8.5 | % | 7.4 | % | ||||||||||
Australia |
86.0 | 74.7 | 6.7 | % | 6.4 | % | ||||||||||
South Africa |
13.4 | 13.5 | 1.0 | % | 1.2 | % | ||||||||||
Rest of world |
116.4 | 96.0 | 9.1 | % | 8.3 | % | ||||||||||
|
|
|
|
|
|
|
|
|||||||||
Total |
$ | 1,284.3 | $ | 1,162.0 | 100.0 | % | 100.0 | % | ||||||||
|
|
|
|
|
|
|
|
The increase in revenue less repair payments (non-GAAP) from the UK region was primarily attributable to higher revenue less repair payments (non-GAAP) in all our segments and an appreciation of the pound sterling against the US dollar by an average of 4.2% for fiscal 2024 as compared to the average exchange rate for fiscal 2023. The increase in revenue less repair payments (non-GAAP) from the Europe (excluding the UK) region was primarily attributable to higher revenue less repair payments (non-GAAP) in all our segments and an appreciation of the Euro against the US dollar by an average of 4.1% for fiscal 2024 as compared to the average exchange rate for fiscal 2023. The increase in revenue less repair payments (non-GAAP) in the North America (primarily the US) region was primarily attributable to higher revenue less repair payments (non-GAAP) in our BFSI and MRHP segments, partially offset by lower revenue less repair payments (non-GAAP)s in our HCLS and TSLU segments. The increase in revenue less repair payments (non-GAAP) from the rest of world region was primarily attributable to higher revenue less repair payments (non-GAAP) in all our segments. The increase in revenue less repair payments (non-GAAP) from the Australia region was primarily attributable to higher revenue less repair payments (non-GAAP) in our BFSI, TSLU and MRHP segments, partially offset by lower revenue less repair payments (non-GAAP) in our HCLS segment, and a depreciation of the Australian dollar against the US dollar by an average of 4.0% for fiscal 2024, as compared to the average exchange rate in fiscal 2023. The decrease in revenue less repair payments (non-GAAP) from the South Africa region was primarily attributable to lower revenue less repair payments (non-GAAP) in our TSLU segment and a depreciation of the South African rand against the US dollar by an average of 10.3% for fiscal 2024, as compared to the average exchange rate in fiscal 2023, partially offset by higher revenue less repair payments (non-GAAP) in our MRHP and BFSI segments.
121
Cost of Revenue
The following table sets forth the composition of our cost of revenue for the periods indicated:
Year ended March 31, | ||||||||||||
2024 | 2023 | Change | ||||||||||
(US dollars in millions) | ||||||||||||
Employee costs |
$ | 627.9 | $ | 578.3 | $ | 49.7 | ||||||
Repair payments |
39.1 | 62.2 | (23.1 | ) | ||||||||
Facilities costs |
80.7 | 67.5 | 13.3 | |||||||||
Depreciation |
54.9 | 48.7 | 6.3 | |||||||||
Legal and professional costs |
12.2 | 12.4 | (0.2 | ) | ||||||||
Travel costs |
8.6 | 7.3 | 1.2 | |||||||||
Other costs |
21.4 | 25.2 | (3.7 | ) | ||||||||
|
|
|
|
|
|
|||||||
Total cost of revenue |
$ | 844.9 | $ | 801.5 | $ | 43.4 | ||||||
|
|
|
|
|
|
|||||||
As a percentage of revenue |
63.8 | % | 65.5 | % |
The increase in cost of revenue was primarily due to higher employee costs on account of higher headcount (including headcount from Vuram, The Smart Cube and OptiBuy, which we acquired on July 1, 2022, December 16, 2022 and December 14, 2022, respectively), wage inflation and higher facilities running costs due to an increase in facilities utilization (as our employees gradually returned to the office); higher travel costs due to increased travel on account of the easing of COVID-19 related travel restrictions in most countries and an appreciation of the pound sterling and the Euro against the US dollar by an average of 4.2% and 4.1% respectively in fiscal 2024 as compared to the average exchange rate in fiscal 2023 which resulted in an increase in our cost by approximately $1.4 million. These increases were partially offset by (i) lower other costs primarily lower sub-contracting costs (primarily due to the ramp-down of a large healthcare process for a client) (ii) the depreciation of the Indian rupee, the Philippine peso and the South African rand against the US dollar by an average of 3.1%, 1.0% and 10.3%, respectively, for fiscal 2024, as compared to the respective average exchange rates for fiscal 2023, which resulted in a decrease in our cost of revenue by approximately $15.9 million . Further, the cost of revenue associated with COVID-19 related business continuity costs, such as costs arising from the provision of accommodation to our employees, rental laptops and WIFI dongles, which are devices that allow remote access via the Internet, as we shifted to a “hybrid” model, decreased by $3.1 million to $2.2 million in fiscal 2024 as compared to $5.3 million in fiscal 2023.
Gross Profit
The following table sets forth our gross profit for the periods indicated:
Year ended March 31, | ||||||||||||
2024 | 2023 | Change | ||||||||||
(US dollars in millions) | ||||||||||||
Gross profit |
$ | 478.4 | $ | 422.7 | $ | 55.7 | ||||||
As a percentage of revenue |
36.2 | % | 34.5 | % | ||||||||
As a percentage of revenue less repair payments (non-GAAP) |
37.3 | % | 36.4 | % |
Gross profit as a percentage of revenue increased in fiscal 2024 from fiscal 2023, due to a higher revenue as discussed above.
Gross profit as a percentage of revenue less repair payments (non-GAAP) increased in fiscal 2024 from fiscal 2023, primarily due to a higher revenue less repair payments (non-GAAP) as discussed above.
During fiscal 2024, our built up seats increased by 11.8% from 37,222 as at the end of fiscal 2023 to 41,599 as at the end of fiscal 2024 due to the expansion of facilities in the Philippines and South Africa and new facilities added in Chennai, Gurgaon, Hyderabad and Vizag in India. The increase was partially offset by surrender of facilities in Romania, South Africa and Chennai in India. Our total headcount increased by 0.6% from 59,755 as at March 31, 2023 to 60,125 as at March 31, 2024, in line with the increase in revenue generation by such hires.
For further information, see notes (1) and (2) to the table presenting certain operating data in “— Operating Data” above.
122
Selling and Marketing Expenses
The following table sets forth the composition of our selling and marketing expenses for the periods indicated:
Year ended March 31, | ||||||||||||
2024 | 2023 | Change | ||||||||||
(US dollars in millions) | ||||||||||||
Employee costs |
$ | 62.1 | $ | 51.7 | $ | 10.4 | ||||||
Other costs |
16.2 | 11.8 | 4.4 | |||||||||
|
|
|
|
|
|
|||||||
Total selling and marketing expenses |
$ | 78.3 | $ | 63.5 | $ | 14.9 | ||||||
|
|
|
|
|
|
|||||||
As a percentage of revenue |
5.9 | % | 5.2 | % | ||||||||
As a percentage of revenue less repair payments (non-GAAP) |
6.1 | % | 5.5 | % |
The increase in our selling and marketing expenses was primarily due to an increase in employee costs due to wage inflation and higher share-based compensation costs and an increase in other costs due to higher marketing costs and higher travel costs and an appreciation of the the pound sterling against the US dollar by an average of 4.2% in fiscal 2024, as compared to the average exchange rates in fiscal 2023 which resulted in an increase of selling and marketing expenses by approximately $0.7 million.
General and Administrative Expenses
The following table sets forth the composition of our general and administrative expenses for the periods indicated:
Year ended March 31, | ||||||||||||
2024 | 2023 | Change | ||||||||||
(US dollars in millions) | ||||||||||||
Employee costs |
$ | 141.3 | $ | 130.8 | $ | 10.5 | ||||||
Other costs |
42.3 | 38.6 | 3.8 | |||||||||
|
|
|
|
|
|
|||||||
Total general and administrative expenses |
$ | 183.6 | $ | 169.3 | $ | 14.3 | ||||||
|
|
|
|
|
|
|||||||
As a percentage of revenue |
13.9 | % | 13.8 | % | ||||||||
As a percentage of revenue less repair payments (non-GAAP) |
14.3 | % | 14.6 | % |
The increase in general and administrative expenses was primarily due to an increase in employee costs due to higher salaries on account of higher headcount (including headcount from Vuram, The Smart Cube and OptiBuy, which we acquired on July 1, 2022, December 16, 2022 and December 14,2022, respectively) and wage inflation and and an increase in other costs due to higher travel costs and costs related to the termination of our ADS facility and the listing of ordinary shares directly on the NYSE and costs associated with the transition to voluntarily filing as a domestic issuer reporting under US GAAP, partially offset by the depreciation of the Indian rupee and the South African rand against the US dollar by an average of 3.0% and 10.3%, respectively, for fiscal 2024 as compared to the average exchange rates for fiscal 2023, which reduced our general and administrative expenses by approximately $2.6 million.
123
Foreign Exchange Loss / (Gain), Net
The following table sets forth our foreign exchange loss / (gain), net for the periods indicated:
Year ended March 31, | ||||||||||||
2024 | 2023 | Change | ||||||||||
(US dollars in millions) | ||||||||||||
Foreign exchange loss/ (gain), net |
$ | (0.7 | ) | $ | (1.0 | ) | $ | 0.3 |
We recorded foreign exchange gain of $0.7 million in fiscal 2024, primarily on account of a revaluation gain of $0.7 million as compared to a foreign exchange gain of $1.0 million in fiscal 2023, primarily on account of a revaluation gain of $1.0 million.
Impairment of Intangible assets
The following table sets forth our impairment of intangible assets for the periods indicated:
Year ended March 31, | ||||||||||||
2024 | 2023 | Change | ||||||||||
(US dollars in millions) | ||||||||||||
Impairment of Intangible assets |
$ | 30.9 | $ | — | $ | 30.9 |
We recorded Impairment of Intangible Assets of $30.9 million in fiscal 2024, primarily on account of an impairment charge to the customer relationship intangible related to our large HCLS client termination.
124
Amortization of Intangible Assets
The following table sets forth our amortization of intangible assets for the periods indicated:
Year ended March 31, | ||||||||||||
2024 | 2023 | Change | ||||||||||
(US dollars in millions) | ||||||||||||
Amortization of intangible assets |
$ | 33.0 | $ | 23.6 | $ | 9.4 |
The increase in amortization of intangible assets was primarily attributable to the amortization of intangibles assets associated with our acquisition of Vuram (which we acquired in July 2022), The Smart Cube (which we acquired in December 2022) and OptiBuy (which we acquired in December 2022) and amortization of intangible assets associated with the business transfer from a large insurance company (in October 2022). This increase was partially offset by the completion of the amortization of certain intangible assets associated with our Fusion acquisition.
Operating Profit
The following table sets forth our operating profit for the periods indicated:
Year ended March 31, | ||||||||||||
2024 | 2023 | Change | ||||||||||
(US dollars in millions) | ||||||||||||
Operating profit |
$ | 153.3 | $ | 167.3 | $ | (14.1 | ) | |||||
As a percentage of revenue |
11.6 | % | 13.7 | % | ||||||||
As a percentage of revenue less repair payments (non-GAAP) |
11.9 | % | 14.4 | % |
Operating profit as a percentage of revenue was lower in fiscal 2024 as compared to fiscal 2023 notwithstanding higher revenues in fiscal 2024 due to higher selling and marketing expenses, general and administrative expenses, impairment of intangibles and amortization of intangible assets and lower foreign exchange gains as a percentage of revenue, partially offset by lower cost of revenue as a percentage of revenue.
Operating profit as a percentage of revenue less repair payments (non-GAAP) was lower in fiscal 2024 from fiscal 2023 notwithstanding higher revenues less repair payments (non-GAAP) in fiscal 2024 due to higher selling and marketing expenses, impairment of intangibles and amortization of intangible assets and lower foreign exchange gains as a percentage of revenue, partially offset by lower cost of revenue and general and administrative expenses, as a percentage of revenue less repair payments (non-GAAP).
125
Other Income, net
The following table sets forth our other income, net for the periods indicated:
Year ended March 31, | ||||||||||||
2024 | 2023 | Change | ||||||||||
(US dollars in millions) | ||||||||||||
Other income, net |
$ | (39.4 | ) | $ | (16.0 | ) | $ | (23.4 | ) |
Other income, net was higher primarily due to the write back of the contingent consideration related to our acquisition of Vuram, which we acquired in July 2022.
Finance Expense
The following table sets forth our finance expense for the periods indicated:
Year ended March 31, | ||||||||||||
2024 | 2023 | Change | ||||||||||
(US dollars in millions) | ||||||||||||
Finance expense |
$ | 29.1 | $ | 18.8 | $ | 10.3 |
Finance expense increased primarily due to higher interest on the right of use assets under IFRS 16, and higher interest on long-term loans taken for general corporate purposes and for the acquisition of The Smart Cube and an increase in the fair value of contingent considerations relating to our acquisitions.
Income Tax Expense
The following table sets forth our income tax expense for the periods indicated:
Year ended March 31, | ||||||||||||
2024 | 2023 | Change | ||||||||||
(US dollars in millions) | ||||||||||||
Income tax expense |
$ | 23.4 | $ | 27.2 | $ | (3.8 | ) |
The decrease in income tax expense was primarily due to a one time reversal of deferred tax liability of $9.5 million on intangibles, offset by an overall increase in taxable profit and an increase in tax rate in UK in fiscal 2024 and further offset by one-time deferred tax asset benefit of $1.7 million due to recognition of previously unrecognized deferred tax assets in fiscal 2023.
Profit After Tax
The following table sets forth our profit after tax for the periods indicated:
Year ended March 31, | ||||||||||||
2024 | 2023 | Change | ||||||||||
(US dollars in millions) | ||||||||||||
Profit after tax |
$ | 140.1 | $ | 137.3 | $ | 2.8 | ||||||
As a percentage of revenue |
10.6 | % | 11.2 | % | ||||||||
As a percentage of revenue less repair payments (non-GAAP) |
10.9 | % | 11.8 | % |
The decrease in profit after tax as a percentage of revenue as well as a percentage of revenue less repair payments (non-GAAP) was primarily on account of lower operating profit as a percentage of revenue and lower operating profit as a percentage of revenue less repair payments (non-GAAP) and higher finance expense, partially offset by higher other income and lower income tax expense, as explained above.
Fiscal 2023 Compared to Fiscal 2022
For a discussion of our results in fiscal 2023 compared to fiscal 2022, please see “Part I — Item 5. Operating and Financial Review and Prospects — Results of Operations — Fiscal 2023 Compared to Fiscal 2022” contained in our Annual Report on Form 20-F for fiscal 2022 filed with the SEC on May 16, 2023.
126
Results by Reportable Segment
For purposes of evaluating operating performance and allocating resources, we have organized our company by operating segments. See Note 28 to our consolidated financial statements included elsewhere in this annual report. For financial statement reporting purposes, we aggregate the segments that meet the criteria for aggregation as set forth in IFRS 8 “Operating Segments” (“IFRS 8”).
The Company provides business process management services. Effective April 1, 2023, the Company adopted a new organizational structure featuring four “SBUs”, each headed by a chief business officer. Under the new organizational structure, the Company combined its priorverticals into the four SBUs. The new structure is intended to help drive improved outcomes for global clients and enable the Company to better drivebusiness synergies, enhance scalability, generate operating leverage, and create organizational depth. The Company now manages and reports financial information through its four SBUs, which reflects how management reviews financial information and makes operating decisions.
The SBUs’ performance is reviewed by the Group Chief Executive Officer, who has been identified as the Chief Operating decision Maker (“CODM”) as defined by IFRS 8, “Operating Segments”. The CODM evaluates the Company’s performance and allocates resources based on revenue growth and operating performance of SBUs. The Company’s operating segments, effective April 1, 2023, are as follows:
• | TSLU: Travel and leisure, shipping and logistics and utilities; |
• | MRHP: Diversified businesses (including manufacturing, retail and CPG, media and entertainment, and telecommunication), hi-tech and professional services, and procurement; |
• | HCLS: Healthcare and life sciences; and |
• | BFSI: Banking and financial services. |
127
The Company uses revenue less repair payments (non-GAAP) as a primary measure to allocate resources and measure segment performance. Revenue less repair payments is a non-GAAP measure which is calculated as (a) revenue less (b) in the Company’s BFSI SBU, payments to repair centers for “Fault” repair cases where the Company acts as the principal in its dealings with the third party repair centers and its clients.
The CODM does not evaluate certain operating expenses, finance expense, other income, net and income taxes by segment, therefore the Company does not allocate these expenses by segment.
The segment results for the year ended March 31, 2024 are as follows:
(US dollars in millions) |
TSLU | MRHP | HCLS | BFSI | Reconciling item (3) |
Total | ||||||||||||||||||
Revenue from external customers |
||||||||||||||||||||||||
Segment Revenue |
$ | 406.1 | $ | 319.3 | $ | 165.9 | $ | 461.9 | $ | (29.8 | ) | $ | 1,323.4 | |||||||||||
Payments to repair centers |
— | — | — | 39.1 | — | 39.1 | ||||||||||||||||||
|
|
|
|
|
|
|
|
|
|
|
|
|||||||||||||
Revenue less repair payments (non-GAAP) |
406.1 | 319.3 | 165.9 | 422.8 | (29.8 | ) | 1,284.3 | |||||||||||||||||
Adjusted cost of revenue (1) (2) |
234.6 | 183.2 | 113.3 | 258.0 | 6.7 | 795.8 | ||||||||||||||||||
|
|
|
|
|
|
|
|
|
|
|
|
|||||||||||||
Segment gross profit |
171.5 | 136.1 | 52.6 | 164.8 | (36.5 | ) | 488.5 | |||||||||||||||||
Other costs |
219.6 | |||||||||||||||||||||||
Other income, net |
(39.4 | ) | ||||||||||||||||||||||
Finance expense |
29.1 | |||||||||||||||||||||||
Impairment of intangible assets |
30.9 | |||||||||||||||||||||||
Amortization of intangible assets |
33.0 | |||||||||||||||||||||||
Share-based compensation expense |
51.7 | |||||||||||||||||||||||
Income- tax expense |
23.4 | |||||||||||||||||||||||
|
|
|||||||||||||||||||||||
Profit after tax |
$ | 140.1 | ||||||||||||||||||||||
|
|
(1) | Excludes share-based compensation expense. |
(2) | Adjusted cost of revenue under reconciling items includes inter and intra segment eliminations and unallocated expenses. |
(3) | Revenue under reconciling items includes inter and intra segment eliminations and impact of foreign exchange fluctuations. |
128
The segment results for the year ended March 31, 2023 are as follows:
(US dollars in millions) |
TSLU | MRHP | HCLS | BFSI | Reconciling item (3) |
Total | ||||||||||||||||||
Revenue from external customers |
||||||||||||||||||||||||
Segment Revenue |
$ | 376.2 | $ | 278.2 | $ | 187.4 | $ | 406.4 | $ | (23.9 | ) | $ | 1,224.3 | |||||||||||
Payments to repair centers |
— | — | — | 62.2 | — | 62.2 | ||||||||||||||||||
|
|
|
|
|
|
|
|
|
|
|
|
|||||||||||||
Revenue less repair payments (non-GAAP) |
376.2 | $ | 278.2 | $ | 187.4 | 344.2 | (23.9 | ) | 1,162.0 | |||||||||||||||
Adjusted cost of revenue (1) (2) |
223.0 | 168.5 | 134.0 | 209.4 | (3.7 | ) | 731.2 | |||||||||||||||||
|
|
|
|
|
|
|
|
|
|
|
|
|||||||||||||
Segment gross profit |
153.2 | 109.7 | 53.3 | 134.8 | (20.2 | ) | 430.8 | |||||||||||||||||
Other costs |
190.1 | |||||||||||||||||||||||
Other income, net |
(16.0 | ) | ||||||||||||||||||||||
Finance expense |
18.8 | |||||||||||||||||||||||
Impairment of intangible assets |
— | |||||||||||||||||||||||
Amortization of intangible assets |
23.6 | |||||||||||||||||||||||
Share-based compensation expense |
49.7 | |||||||||||||||||||||||
Income- tax expense |
27.2 | |||||||||||||||||||||||
|
|
|||||||||||||||||||||||
Profit after tax |
$ | 137.3 | ||||||||||||||||||||||
|
|
(1) | Excludes share-based compensation expense. |
(2) | Adjusted cost of revenue under reconciling items includes inter and intra segment eliminations and unallocated expenses. |
(3) | Revenue under reconciling items includes inter and intra segment eliminations and impact of foreign exchange fluctuations. |
129
TSLU
Segment Revenue
Fiscal 2024 Compared to Fiscal 2023
Revenue and revenue less repair payments (non-GAAP) in the TSLU segment increased by 8.0% to $406.1 million in fiscal 2024 from $376.2 million in fiscal 2023. This increase was primarily attributable to the increase in revenues for existing clients by $26.4 million and revenue from new clients of $3.5 million and an appreciation of the pound sterling and the Euro by an average of 4.2% and 4.1%, respectively, in each case against the US dollar in fiscal 2024, as compared to the respective average exchange rates in fiscal 2023. The increase was partially offset by a depreciation of the Australian dollar and the South African rand by an average of 4.0% and 10.3% respectively, in each case against the US dollar in fiscal 2024, as compared to the respective average exchange rates in fiscal 2023.
Fiscal 2023 Compared to Fiscal 2022
Revenue and revenue less repair payments (non-GAAP) in the TSLU segment increased by 18.5% to $376.2 million in fiscal 2023 from $317.4 million in fiscal 2022. This increase was primarily attributable to the increase in revenues for existing clients by $49.7 million and revenue from new clients of $9.1 million. The increase was partially offset by a depreciation of the pound sterling, the Euro, Australian dollar and the South African rand by an average of 11.8%, 10.4%, 7.3% and 14.4% respectively, in each case against the US dollar in fiscal 2023, as compared to the respective average exchange rates in fiscal 2022.
Segment Gross Profit
Fiscal 2024 Compared to Fiscal 2023
Segment gross profit in the TSLU segment increased by 12.0% to $171.5 million in fiscal 2024 from $153.2 million in fiscal 2023. The increase was primarily attributable to higher segment revenue, partially offset by higher cost of revenue primariliy higher employee cost on account of wage inflation and higher facilities running costs due to an increase in facilities utilization (as our employees gradually returned to the office) and higher travel cost.
Fiscal 2023 Compared to Fiscal 2022
Segment gross profit in the TSLU segment increased by 31.0% to $153.2 million in fiscal 2023 from $117.0 million in fiscal 2022. The increase was primarily attributable to higher segment revenue, partially offset by higher cost of revenue primariliy higher employee cost on account higher headcount and wage inflation, higher facilities running costs due to an increase in facilities utilization (as our employees gradually returned to the office) and higher travel cost.
MRHP
Segment Revenue
Fiscal 2024 Compared to Fiscal 2023
Revenue and revenue less repair payments (non-GAAP) in the MRHP segment increased by 14.7% to $319.3 million in fiscal 2024 from $278.2 million in fiscal 2023. This increase was primarily attributable to the increase in revenues for existing clients by $31.9 million and revenue from new clients of $9.4 million and an appreciation of the pound sterling and the Euro by an average of 4.2% and 4.1%, respectively, in each case against the US dollar in fiscal 2024, as compared to the respective average exchange rates in fiscal 2023. The increase was partially offset by a depreciation of the Australian dollar by an average of 4.0% against the US dollar in fiscal 2024, as compared to the respective average exchange rates in fiscal 2023.
Fiscal 2023 Compared to Fiscal 2022
Revenue and revenue less repair payments (non-GAAP) in the MRHP segment increased by 27.8% to $278.2 million in fiscal 2023 from $217.7 million in fiscal 2022. This increase was primarily attributable to the increase in revenues for existing clients by $32.3 million and revenue from new clients of $28.2 million. The increase was partially offset by a depreciation of the pound sterling, the Euro and Australian dollar by an average of 11.8%, 10.4% and 7.3%, in each case against the US dollar in fiscal 2023, as compared to the respective average exchange rates in fiscal 2022.
130
Segment Gross Profit
Fiscal 2024 Compared to Fiscal 2023
Segment gross profit in the MRHP segment increased by 24.0% to $136.1 million in fiscal 2024 from $109.7 million in fiscal 2023. The increase was primarily attributable to higher segment revenue, partially offset by higher cost of revenue primariliy higher employee cost on account of higher headcount and wage inflation, higher facilities running costs due to an increase in facilities utilization (as our employees gradually returned to the office) and higher travel cost.
Fiscal 2023 Compared to Fiscal 2022
Segment gross profit in the MRHP segment increased by 39.4% to $109.7 million in fiscal 2023 from $92.1 million in fiscal 2022. The increase was primarily attributable to higher segment revenue, partially offset by higher cost of revenue primariliy higher employee cost on account of higher headcount and wage inflation, higher facilities running costs due to an increase in facilities utilization (as our employees gradually returned to the office) and higher travel cost.
HCLS
Segment Revenue
Fiscal 2024 Compared to Fiscal 2023
Revenue and revenue less repair payments (non-GAAP) in the HCLS segment decreased by 11.5% to $165.9 million in fiscal 2024 from $187.4 million in fiscal 2023. This decrease was primarily attributable to the ramp-down of a large healthcare process for a client and a depreciation of the Australian dollar by an average of 4.0% against the US dollar in fiscal 2024, as compared to the respective average exchange rates in fiscal 2023. The decrease was partially offset by an appreciation of the pound sterling and the Euro by an average of 4.2% and 4.1%, respectively, in each case against the US dollar in fiscal 2024, as compared to the respective average exchange rates in fiscal 2023.
Fiscal 2023 Compared to Fiscal 2022
Revenue and revenue less repair payments (non-GAAP) in the HCLS segment decreased by 4.2% to $187.4 million in fiscal 2023 from $195.7 million in fiscal 2022. This decrease was primarily attributable to the ramp-down of a large healthcare process for a client and a depreciation of the pound sterling, the Euro and Australian dollar by an average of 11.8%, 10.4% and 7.3%, in each case against the US dollar in fiscal 2023, as compared to the respective average exchange rates in fiscal 2022.
Segment Gross Profit
Fiscal 2024 Compared to Fiscal 2023
Segment gross profit in the HCLS segment decreased by 1.3% to $52.6 million in fiscal 2024 from $53.3 million in fiscal 2023. The decrease was primarily attributable to lower segment revenue, partially offset by lower cost of revenue primariliy lower employee cost on account of lower headcount.
Fiscal 2023 Compared to Fiscal 2022
Segment gross profit in the HCLS segment decreased by 16.3% to $53.3 million in fiscal 2023 from $63.7 million in fiscal 2022. The decrease was primarily attributable to lower segment revenue and higher cost of revenue primariliy higher employee cost on account of wage inflation.
131
BFSI
Segment Revenue
Fiscal 2024 Compared to Fiscal 2023
Revenue in the BFSI segment increased by 13.6% to $461.9 million in fiscal 2024 from $406.4 million in fiscal 2023. This increase was primarily attributable to the increase in revenues for existing clients by $43.7 million and revenue from new clients of $11.6 million and an appreciation of the pound sterling and the Euro by an average of 4.2% and 4.1%, respectively, in each case against the US dollar in fiscal 2024, as compared to the respective average exchange rates in fiscal 2023. The increase was partially offset by a depreciation of the Australian dollar by an average of 4.0% against the US dollar in fiscal 2024, as compared to the respective average exchange rates in fiscal 2023.
Revenue less repair payments (non-GAAP) in the BFSI segment increased by 22.8% to $422.8 million in fiscal 2024 from $344.2 million in fiscal 2023. This increase was primarily attributable to the increase in revenues for existing clients by $66.9 million and revenue from new clients of $11.6 million and an appreciation of the pound sterling and the Euro by an average of 4.2% and 4.1%, respectively, in each case against the US dollar in fiscal 2024, as compared to the respective average exchange rates in fiscal 2023. The increase was partially offset by a depreciation of the Australian dollar by an average of 4.0% against the US dollar in fiscal 2024, as compared to the respective average exchange rates in fiscal 2023.
Fiscal 2023 Compared to Fiscal 2022
Revenue in the BFSI segment increased by 4.4% to $406.4 million in fiscal 2023 from $389.2 million in fiscal 2022. This increase was primarily attributable to the increase in revenues from new clients of $32.0 million. The increase was partially offset by a depreciation of the pound sterling, the Euro and Australian dollar by an average of 11.8%, 10.4% and 7.3%, in each case against the US dollar in fiscal 2023, as compared to the respective average exchange rates in fiscal 2022 and lower revenues from existing clients by $14.8 million.
Revenue less repair payments (non-GAAP) in the BFSI segment increased by 12.4% to $344.2 million in fiscal 2023 from $306.2 million in fiscal 2022. This increase was primarily attributable to the increase in revenues for exisiting clients for $6.8 million and increase in revenue from new clients of $31.1 million. The increase was partially offset by a depreciation of the pound sterling, the Euro and Australian dollar by an average of 11.8%, 10.4% and 7.3%, in each case against the US dollar in fiscal 2023, as compared to the respective average exchange rates in fiscal 2022.
Segment Gross Profit
Fiscal 2024 Compared to Fiscal 2023
Segment gross profit in the BFSI segment increased by 22.3% to $164.8 million in fiscal 2024 from $134.8 million in fiscal 2023. The increase was primarily attributable to higher segment revenue, partially offset by higher cost of revenue primariliy higher employee cost on account of higher headcount and wage inflation, higher facilities running costs due to an increase in facilities utilization (as our employees gradually returned to the office) and higher travel cost.
Fiscal 2023 Compared to Fiscal 2022
Segment gross profit in the BFSI segment increased by 10.3% to $134.8 million in fiscal 2023 from $122.2 million in fiscal 2022. The increase was primarily attributable to higher segment revenue, partially offset by higher cost of revenue primariliy higher employee cost on account of higher headcount and wage inflation, higher facilities running costs due to an increase in facilities utilization (as our employees gradually returned to the office) and higher travel cost.
132
Tax Assessment Orders
Transfer pricing regulations to which we are subject require that any international transaction among the WNS group enterprises be on arm’s-length terms. We believe that the international transactions among the WNS group enterprises are on arm’s-length terms. If, however, the applicable tax authorities determine that the transactions among the WNS group enterprises do not meet arm’s-length criteria, we may incur increased tax liability, including accrued interest and penalties. This would cause our tax expense to increase, possibly materially, thereby reducing our profitability and cash flows. We have signed an advance pricing agreement with the Government of India providing for the agreement on transfer pricing matters over certain transactions covered thereunder for a period of five years starting from April 2018. We have filed an application with the Government of India for the renewal of the advance pricing agreement on similar terms for another five years starting from April 2023. The applicable tax authorities may also disallow deductions or tax holiday benefits claimed by us and assess additional taxable income on us in connection with their review of our tax returns.
From time to time, we receive orders of assessment from the Indian tax authorities assessing additional taxable income on us and/or our subsidiaries in connection with their review of our tax returns. We currently have orders of assessment for fiscal 2003 through fiscal 2020 pending before various appellate authorities. These orders assess additional taxable income that could in the aggregate give rise to an estimated ₹343.8 million ($4.1 million based on the exchange rate on March 31, 2024) in additional taxes, including interest of ₹49.1 million ($0.6 million based on the exchange rate on March 31, 2024).
The following sets forth the details of these orders of assessment:
Entity |
Tax year(s) | Amount demanded (including interest) |
Interest on amount Demanded |
|||||||||||||||||
(₹ and US dollars in millions) | ||||||||||||||||||||
Permanent establishment of WNS North America Inc (“WNS NA Inc”) in India |
Fiscal 2003 | ₹ | 0.1 | $ | (0.1 | )(1) | ₹ | — | $ | — | ||||||||||
Permanent establishment of WNS NA Inc and WNS Global Services UK Limited (“WNS UK”) in India |
Fiscal 2004 | ₹ | 8.1 | $ | (0.1 | )(1) | ₹ | — | $ | — | ||||||||||
Permanent establishment of WNS NA Inc and WNS UK in India |
Fiscal 2005 | ₹ | 4.1 | $ | (0.1 | )(1) | ₹ | — | $ | — | ||||||||||
WNS Global |
Fiscal 2006 | ₹ | 29.8 | $ | (0.4 | )(1) | ₹ | 7.7 | $ | (0.1 | )(1) | |||||||||
Permanent establishment of WNS NA Inc and WNS UK in India |
Fiscal 2006 | ₹ | 13.2 | $ | (0.2 | )(1) | ₹ | 5.6 | $ | (0.1 | )(1) | |||||||||
Permanent establishment of WNS NA Inc. and WNS UK in India |
Fiscal 2007 | ₹ | 23.1 | $ | (0.3 | )(1) | ₹ | 5.4 | $ | (0.1 | )(1) | |||||||||
WNS Global |
Fiscal 2009 | ₹ | 55.2 | $ | (0.6 | )(1) | ₹ | — | $ | — | ||||||||||
WNS Business Consulting Services Private Limited (“WNS BCS”) |
Fiscal 2010 | ₹ | 1.0 | $ | (0.1 | )(1) | ₹ | — | $ | — | ||||||||||
Permanent establishment of WNS NA Inc in India |
Fiscal 2011 | ₹ | 31.0 | $ | (0.4 | )(1) | ₹ | 9.9 | $ | (0.1 | )(1) | |||||||||
WNS Global |
Fiscal 2016 | ₹ | 45.2 | $ | (0.4 | )(1) | ₹ | 20.50 | $ | (0.2 | )(1) | |||||||||
WNS Global |
Fiscal 2020 | ₹ | 133.0 | $ | (1.4 | )(1) | ₹ | — | $ | — | ||||||||||
Total |
₹ | 343.8 | $ | (4.1 | )(1) | ₹ | 49.1 | $ | (0.6 | )(1) |
Note:
(1) | Based on the exchange rate as at March 31, 2024. |
The aforementioned orders of assessment allege that the transfer prices we applied to certain of the international transactions between WNS Global or WNS BCS (each of which is one of our Indian subsidiaries), as the case may be, and our other wholly-owned subsidiaries named above were not on arm’s-length terms, disallow a tax holiday benefit claimed by us, deny the set off of brought forward business losses and unabsorbed depreciation and disallow certain expenses claimed as tax deductible by WNS Global or WNS BCS, as the case may be. As at March 31, 2024, we have provided a tax reserve of ₹774.3 million ($9.3 million based on the exchange rate on March 31, 2024) primarily on account of the Indian tax authorities’ denying the set-off of brought forward business losses and unabsorbed depreciation. We have appealed against these orders of assessment before higher appellate authorities.
133
In addition, we currently have orders of assessment pertaining to similar issues that have been decided in our favor by appellate authorities, vacating tax demands of ₹6,907.0 million ($82.8 million based on the exchange rate on March 31, 2024) in additional taxes, including interest of ₹2,457.1 million ($29.5 million based on the exchange rate on March 31, 2024). The income tax authorities have filed or may file appeals against these orders at higher appellate authorities.
In case of disputes, the Indian tax authorities may require us to deposit with them all or a portion of the disputed amounts pending resolution of the matters on appeal. Any amount paid by us as deposits will be refunded to us with interest if we succeed in our appeals. We have deposited ₹904.1 million ($10.8 million based on the exchange rate on March 31, 2024) of the disputed amount with the tax authorities and may be required to deposit the remaining portion of the disputed amount with the tax authorities pending final resolution of the respective matters.
As at March 31, 2024, corporate tax returns for fiscal year 2021 and thereafter remain subject to examination by tax authorities in India.
After consultation with our Indian tax advisors and based on the facts of these cases, legal opinions from counsel on certain matters, the nature of the tax authorities’ disallowances and the orders from appellate authorities deciding similar issues in our favor in respect of assessment orders for earlier fiscal years, we believe these orders are unlikely to be sustained at the higher appellate authorities and we intend to vigorously dispute the orders of assessment.
In addition, we currently have orders of assessment outstanding for various years pertaining to pre-acquisition period of Smart Cube India Private Limited acquired in fiscal 2023, which assess additional taxable income that could in the aggregate give rise to an estimated ₹63.2 million ($0.8 million based on the exchange rate on March 31, 2024) in additional taxes, including interest of ₹31.1 million ($0.4 million based on the exchange rate on March 31, 2024). These orders of assessment disallow tax holiday benefit claimed by Smart Cube India Private Limited. Smart Cube India Private Limited has appealed against these orders of assessment before higher appellate authorities.
We have received orders of assessment from the VAT, service tax and GST authorities, demanding payment of ₹244.1 million ($2.9 million based on the exchange rate on March 31, 2024) towards VAT, service tax and GST for the period April 1, 2014 to March 31, 2020. The tax authorities have rejected input tax credit on certain types of input services. Based on consultations with our tax advisors, we believe these orders of assessments will more likely than not be vacated by the higher appellate authorities and we intend to dispute the orders of assessments.
In 2016, we also received an assessment order from the Sri Lankan Tax Authority, demanding payment of LKR 25.2 million ($0.1 million based on the exchange rate on March 31, 2024) in connection with the review of our tax return for fiscal year 2012. The assessment order challenges the tax exemption that we have claimed for export business. We have filed an appeal against the assessment order with the Sri Lankan Tax Appeal Commission in this regard.
Based on consultations with our tax advisors, we believe this order of assessment will more likely than not be vacated by the higher appellate authorities and we intend to dispute the order of assessment. No assurance can be given, however, that we will prevail in our tax disputes. If we do not prevail, payment of additional taxes, interest and penalties may adversely affect our results of operations, financial condition and cash flows. There can also be no assurance that we will not receive similar or additional orders of assessment in the future.
Liquidity and Capital Resources
Our capital requirements are principally for the establishment of operating facilities to support our growth and acquisitions, to fund our debt repayment obligations, to fund our acquisitions and to fund the repurchase of ordinary shares under our share repurchase programs, as described in further detail below, see “— Share Repurchases.” Our sources of liquidity include cash and cash equivalents and cash flow from operations, supplemented by equity and debt financing and bank credit lines as required.
As at March 31, 2024, we had cash and cash equivalents of $87.4 million which were primarily held in Indian rupees, pound sterling, Sri Lankan Rupees, Philippine pesos, Romanian leu, US dollars, Australian dollars and South African rand. We typically seek to invest our available cash on hand in bank deposits and money market instruments. Our investments include primarily bank deposits, mutual funds which totaled $156.8 million as at March 31, 2024.
As at March 31, 2024, we had $139.2 million debt outstanding. We also had available lines of credit amounting to $174.1 million, and $40.0 million were drawn under these lines of credit, as discussed below. These limits can be utilized in accordance with the agreed terms and prevailing interest rates at the time of borrowing.
In July 2022, WNS (Mauritius) Limited obtained a term loan facility of $80.0 million from The Hongkong and Shanghai Banking Corporation Limited, Hong Kong and Citibank N.A., Hong Kong Branch for general corporate purposes. The loan bears interest at a rate equivalent to the SOFR plus a margin of 1.20% per annum. WNS (Mauritius) Limited’s obligations under the term loan are guaranteed by WNS. The term loan is secured by a pledge of shares of WNS (Mauritius) Limited held by WNS. The facility agreement for the term loan contains certain covenants, including restrictive covenants relating to our indebtedness and financial covenants relating to our EBITDA to debt service ratio and total net borrowings to EBITDA ratio, each as defined in the facility agreement. The loan matures in July 2027 and the principal is repayable in 10 semi-annual installments of $8.0 million each. On January 9, 2023, July 11, 2023 and January 11, 2024 the Company made scheduled repayment of $8.0 million each.
134
In December 2022, WNS UK obtained a term loan facility of £83.0 million ($102.4 million based on the exchange rate on March 31, 2023) from The Hongkong and Shanghai Banking Corporation Limited, Hong Kong and Citibank N.A., UK Branch to fund our acquisition of The Smart Cube. The loan bears interest at a rate equivalent to the pound sterling overnight index average (“SONIA”) plus a margin of 1.25% per annum. WNS UK’s obligations under the term loan are guaranteed by WNS. The term loan is secured by a pledge of shares of WNS (Mauritius) Limited held by WNS. The facility agreement for the term loan contains certain covenants, including restrictive covenants relating to our indebtedness and financial covenants relating to our EBITDA to debt service ratio and total net borrowings to EBITDA ratio, each as defined in the facility agreement. The loan matures in December 2027 and the principal is repayable in 10 semi-annual installments of £8.3 million each. On June 16, 2023 and December 18,2023 the Company made scheduled repayment of £8.3 million each.
• | As at March 31, 2024, our Indian subsidiary, WNS Global, had an unsecured line of credit of ₹840 million ($10.1 million based on the exchange rate on March 31, 2024) from The Hongkong and Shanghai Banking Corporation Limited, ₹600 million ($7.2 million based on the exchange rate on March 31, 2024) from JP Morgan Chase Bank, N.A., ₹800 million ($9.6 million based on the exchange rate on March 31, 2024) from Citibank N.A., ₹750 million ($9.0 million based on the exchange rate on March 31, 2024) from Axis Bank, ₹600 million ($7.2 million based on the exchange rate on March 31, 2024) from DBS Bank, ₹600 million ($7.2 million based on the exchange rate on March 31, 2024) from HDFC Bank, ₹600 million ($7.2 million based on the exchange rate on March 31, 2024) from ICICI Bank and ₹600 million ($7.2 million based on the exchange rate on March 31, 2024) from Standard Chartered Bank for working capital purposes. Interest on these lines of credit would be determined on the date of the borrowing. These lines of credit generally can be withdrawn by the relevant lender at any time. As at March 31, 2024, there was no outstanding amount under this facility. |
• | As at March 31, 2024 WNS UK had a working capital facility of £30.0 million ($37.9 million based on the exchange rate on March 31, 2024) from HSBC Bank plc. The working capital facility bears interest at Bank of England base rate plus a margin of 2.00% per annum. Interest is payable on a quarterly basis. The facility is subject to conditions to drawdown and can be withdrawn by the lender at any time by notice to the borrower. As at March 31, 2024, there was no outstanding amount under this facility. |
• | As at March 31, 2024 our South African subsidiary, WNS Global Services SA (Pty) Ltd., had an unsecured line of credit of ZAR 30.0 million ($1.6 million based on the exchange rate on March 31, 2024) from The HSBC Bank plc. for working capital purposes. This facility bears interest at prime rate less a margin of 2.25% per annum. This line of credit can be withdrawn by the lender at any time. As at March 31, 2024, there was no outstanding amount under this facility. |
• | As at March 31, 2024, WNS North America Inc., had an unsecured line of credit of $55.0 million from The HSBC Bank plc. for working capital purposes. This facility bears interest at prime rate or SOFR plus a margin of 1.65% per annum. This line of credit can be withdrawn by the lender at any time. As at March 31, 2024, $40.0 million was utilized under this facility. |
• | As at March 31, 2024, WNS Global Services Philippines Inc. had an unsecured line of credit of $15.0 million from The HSBC Bank plc. for working capital purposes. This line of credit can be withdrawn by the lender at any time. As at March 31, 2024, there was no outstanding amount under this facility. |
In March 2017, our Mauritius subsidiary, WNS (Mauritius) Limited, obtained a term loan facility for $84.0 million from HSBC Bank (Mauritius) Ltd. and Standard Chartered Bank, UK. The proceeds from this loan facility were used to finance our acquisition of HealthHelp. The loan bore interest at a rate equivalent to the three-month US dollar LIBOR plus a margin of 0.95% per annum. In connection with the term loan, we entered into interest rate swaps with banks to swap the variable portion of the interest based on the three-month US dollar LIBOR to a fixed rate of 1.9635%. WNS (Mauritius) Limited’s obligations under the term loan were guaranteed by WNS. The term loan was secured by a pledge of shares of WNS (Mauritius) Limited held by WNS. The facility agreement for the term loan contained certain covenants, including restrictive covenants relating to our indebtedness and financial covenants relating to our EBITDA to debt service ratio and total borrowings to EBITDA ratio, each as defined in the facility agreement. The loan matured in March 2022 and the principal was repayable in 10 semiannual installments of $8.4 million each. On September 14, 2017, March 14, 2018, September 17, 2018, March 14, 2019, September 16, 2019, March 16, 2020, September 14, 2020, March 15, 2021, September 14, 2021 we made scheduled repayments of $8.4 million each and on March 14, 2022 we repaid the final installment of $8.4 million. As a result of our repayment of the final instalment, HSBC Bank (Mauritius) Limited released the pledge on shares of WNS (Mauritius) Limited.
As at March 31, 2024, bank guarantees amounting to $0.9 million were provided on behalf of certain of our subsidiaries to regulatory authorities and other third parties.
135
Based on our current level of operations, we expect that our anticipated cash generated from operating activities, cash and cash equivalents on hand, and use of existing credit facilities will be sufficient to fund our estimated capital expenditures, share repurchases and working capital needs for the next 12 months. However, if our lines of credit were to become unavailable for any reason, we would require additional financing to fund our capital expenditures, share repurchases and working capital needs. We currently expect our capital expenditures needs in fiscal 2025 to be approximately $65.0 million. The geographical distribution, timing and volume of our capital expenditures in the future will depend on new client contracts we may enter into or the expansion of our business under our existing client contracts. Our capital expenditure in fiscal 2024 amounted to $54.3 million and our capital commitments (net of capital advances) as at March 31, 2024 were $8.0 million. Of the capital expenditure incurred in fiscal 2024, approximately $26.4 million was incurred in India, approximately $12.1 million was incurred in South Africa, approximately $9.1 million was incurred in the Philippines, approximately $4.8 million was incurred in the US, approximately $0.7 million was incurred in UK, approximately, $1.2 million was incurred in the rest of the world. Of the capital commitments of $8.0 million, we plan to spend approximately $3.0 million in India, approximately $1.4 million in the Philippines, approximately $1.9 million in South Africa, approximately $1.7 million in the rest of the world.
Further, under the current challenging economic and business conditions as discussed under “— Global Economic Conditions” above, there can be no assurance that our business activity would be maintained at the expected level to generate the anticipated cash flows from operations. If the current market conditions deteriorate, we may experience a decrease in demand for our services, resulting in our cash flows from operations being lower than anticipated. If our cash flows from operations are lower than anticipated, including as a result of the ongoing downturn in the market conditions or otherwise, we may need to obtain additional financing to meet our debt repayment obligations and pursue certain of our expansion plans. Further, we may in the future make further acquisitions. If we have significant growth through acquisitions or require additional operating facilities beyond those currently planned to service new client contracts, we may also need to obtain additional financing. We believe in maintaining maximum flexibility when it comes to financing our business. We regularly evaluate our current and future financing needs. Depending on market conditions, we may access the capital markets to strengthen our capital position, and provide us with additional liquidity for general corporate purposes, which may include capital expenditures acquisitions, refinancing of indebtedness and working capital. If current market conditions deteriorate, we may not be able to obtain additional financing or any such additional financing may be available to us on unfavorable terms. An inability to pursue additional opportunities will have a material adverse effect on our ability to maintain our desired level of revenue growth in future periods.
The following table shows our cash flows in fiscal 2024 and 2023:
Year ended March 31, | ||||||||
2024 | 2023 | |||||||
(US dollars in millions) | ||||||||
Net cash provided by operating activities |
$ | 229.2 | $ | 205.0 | ||||
Net cash used in investing activities |
$ | (26.5 | ) | $ | (233.2 | ) | ||
Net cash provided by / (used in) financing activities |
$ | (238.0 | ) | $ | 63.0 |
Cash Flows from Operating Activities
Net cash provided by operating activities increased to $229.2 million in fiscal 2024 from $205 million in fiscal 2023. The increase in net cash provided by operating activities was attributable to an increase in profit as adjusted for non-cash and other items by $34.0 million and an increase in cash inflow on account of working capital changes by $11.3 million, which was partially offset by an increase in interest paid on our long-term debt and lease liabilities by $11.9 million, an increase in taxes paid by $7.1 million and a decrease in interest received by $1.9 million.
The profit after tax as adjusted for non-cash and other items, primarily comprised the following: (i) profit after tax of $140.1 million in fiscal 2024 as compared to $137.3 million in fiscal 2023; (ii) impairment of intangible assets of $30.9 million in fiscal 2024 as compared to $nil in fiscal 2023; (iii) depreciation and amortization expense of $89.7 million in fiscal 2024 as compared to $73.8 million in fiscal 2023; (iv) interest expense of $28.7 million in fiscal 2024 as compared to $18.6 million in fiscal 2023; (v) unrealized loss on derivative instruments of $1.5 million in fiscal 2024 as compared to an unrealized gain of $2.4 million on derivative instruments in fiscal 2023; (vi) share-based compensation expense of $51.7 million in fiscal 2024 as compared to $49.7 million in fiscal 2023; (vii) interest income of $3.5 million for fiscal 2024 as compared to $5.3 million for fiscal 2023; (viii) allowances for expected credit losses of $0.2 million for fiscal 2024 as compared to a reversal of allowance for expected credit losses of $0.8 million for fiscal 2023 (ix) income from mutual fund of $10.5 million in fiscal 2024 as compared to $8.0 million in fiscal 2023; (x) income tax expense (current tax and deferred tax) of $23.5 million in fiscal 2023 as compared to $27.2 million in fiscal 2023; (xi) unrealized exchange gain of $3.9 million in fiscal 2024 as compared to an unrealized exchange loss of $2.2 million in fiscal 2023; (xii) reversal of contingent consideration of $22.5 million in fiscal 2024 as compared to $nil in fiscal 2023.
Cash outflow on account of working capital changes was $28.6 million in fiscal 2024 as compared to $39.9 million in fiscal 2023.
136
This was primarily on account of a decrease in cash outflow in relation to other assets by $22.7 million, a decrease in relation to trade payables by $7.3 million and a decrease in cash outflow in relation to contract liabilities by $2.7 million, partially offset by a decrease in cash inflow in relation to other liabilities by $14.1 million and an increase in cash outflow from trade receivables by $7.3 million.
Cash Flows from Investing Activities
Net cash used in investing activities decreased to $26.5 million in fiscal 2024 from $233.2 million in fiscal 2023. This was primarily on account of net cash outflow of $nil towards our acquisitions and business transfer made in fiscal 2024 as compared to $312.8 million in fiscal 2023, partially offset by a cash outflow of $54.3 million in fiscal 2024 towards the purchase of property and equipment (comprising mainly leasehold improvements, furniture and fixtures, office equipment and information technology equipment) and intangible assets (comprising computer software), as compared to $45.0 million in fiscal 2023 and a net cash inflow of $27.2 million from sale of mutual fund in fiscal 2024 as compared to a net cash inflow of $66.3 million in fiscal 2023; and a net cash ouflow (placement of fixed deposits, net of maturities) towards our fixed deposit investments of $2.5 million in fiscal 2024 as compared to net cash inflow (maturity of fixed deposits, net of placements) of $37.5 million in fiscal 2023 and profit of sale of mutual fund of $3.8 million in fiscal 2024 as compared to $7.7 million in fiscal 2023, and proceeds from redemption of investment in mutual fund of $nil in fiscal 2024 as compared to $12.3 million in fiscal 2023.
Cash Flows from Financing Activities
Net cash used in financing activities was $238.0 million in fiscal 2024 as compared to a net cash provided by financing activities of $63.0 million in fiscal 2023. This was primarily on account of cash outflow of $215.3 million towards share repurchases in fiscal 2024 as compared to $81.6 million in fiscal 2023 and a cash outflow of $37.1 million towards repayment of long term debt in fiscal 2024 as compared to a cash inflow due to proceeds from long term debt (net of repayment of $8.0 million) of $172.9 million in fiscal 2023 partially offset by a cash inflow from availment of short term line of credit of $40.3 million (net of repayment of $67.3 million) in fiscal 2024 as compared to availment of short term line of credit of $0.3 million (net of repayment of $31.4 million) in fiscal 2023 and a cash outflow of $26.5 million towards the principal payment of lease liabilities in fiscal 2024 as compared to $28.1 million in fiscal 2023.
Contractual Obligations
Our principal commitments consist of expected principal cash payments relating to our obligations under operating leases for office space, which represent minimum lease payments for office space, and purchase obligations for property and equipment. The following table sets out our total future contractual obligations as at March 31, 2024 on a consolidated basis:
Payments Due By Period | ||||||||||||||||||||
Total | Less than 1 year |
1-3 years | 3-5 years | More than 5 years |
||||||||||||||||
(US dollars in millions) | ||||||||||||||||||||
Trade payables |
$ | 25.0 | $ | 25.0 | $ | — | $ | — | $ | — | ||||||||||
Short-term line of credit |
40.0 | 40.0 | — | — | — | |||||||||||||||
Long term debt (before netting off debt issuance costs) |
139.8 | 37.0 | 73.9 | 29.0 | — | |||||||||||||||
Estimated interest payments (1) |
17.3 | 7.9 | 8.5 | 0.9 | — | |||||||||||||||
Lease liabilities |
250.0 | 42.3 | 74.7 | 58.8 | 74.2 | |||||||||||||||
Purchase obligations (net of capital advances) |
8.0 | 8.0 | — | — | — | |||||||||||||||
|
|
|
|
|
|
|
|
|
|
|||||||||||
Total |
$ | 480.1 | $ | 160.2 | $ | 157.1 | $ | 88.7 | $ | 74.2 | ||||||||||
|
|
|
|
|
|
|
|
|
|
(1) | Interest payments are based on effective interest rates as of March 31, 2024. |
Research and Development
We have committed, and expect to continue to commit in the future, a portion of our resources to research and development. We are investing substantially in Triange, our “research, data, analytics and AI” practice, to strengthen our offerings to enable business growth and digital transformation for our clients. We collobarate with clients on their data driven transformation journey and enhance the returns on their analytics investments through our cloud-based AI/ML driven offerings and platforms with next-gen technologies.
Trend Information
Please refer to “—Results of Operations” for a discussion of the most recent trends in our services, sales and expenses by the end of fiscal 2024. In addition, please refer to discussions included therein for a discussion of known trends, uncertainties, demands, commitments or events that we believe are reasonably likely to have a material effect on our net sales or revenues, income from continuing operations, profitability, liquidity or capital resources, or that would cause reported financial information to be not necessarily indicative of our future operating results or financial condition.
137
Critical Accounting Estimates
The discussion and analysis of our financial condition and results of operations are based on our consolidated financial statements included elsewhere in this annual report which have been prepared in accordance with IFRS, as issued by the IASB. Note 2 to our consolidated financial statements included elsewhere in this annual report describes our significant accounting policies and is an essential part of our consolidated financial statements.
We believe the following to be critical accounting estimates. By “critical accounting estimates,” we mean policies that are both important to our financial condition and financial results and require critical management judgments and estimates. Although we believe that our judgments and estimates are appropriate, actual future results may differ from our estimates.
i. | Revenue recognition |
Our determination of whether BPM services are considered distinct performance obligations that should be accounted for separately versus together may require significant judgment.
We provide automobile claims handling services, wherein we enter into contracts with its clients to process all their claims over the contract period and the fees are determined either on a per claim basis or as a fixed payment for the contract period. Where the contracts are on a per claim basis, we invoice the client at the inception of the claim process. We estimate the processing period for the claims and recognize revenue over the estimated processing period. This processing period generally ranges between one to two months. The processing time may be greater for new clients and the estimated service period is adjusted accordingly. The processing period is estimated based on historical experience and other relevant factors, if any.
ii. | Current income taxes |
The major tax jurisdictions for us are India, the Philippines, South Africa, UK, and US, though we also file tax returns in other foreign jurisdictions. Significant judgments are involved in determining the provision for income taxes including judgment on whether tax positions are probable of being sustained in tax assessments. A tax assessment can involve complex issues, which can only be resolved over extended time periods. The recognition of taxes that are subject to certain legal or economic limits or uncertainties is assessed individually by management based on the specific facts and circumstances.
iii. | Deferred income taxes |
The assessment of the probability of future taxable profit in which deferred tax assets can be utilized is based on our latest approved budget forecast, which is adjusted for significant non-taxable profit and expenses and specific limits to the use of any unused tax loss or credit. The tax rules in the numerous jurisdictions in which we operate are also carefully taken into consideration. If a positive forecast of taxable profit indicates the probable use of a deferred tax asset, especially when it can be utilized without a time limit, that deferred tax asset is usually recognized in full. The recognition of deferred tax assets that are subject to certain legal or economic limits or uncertainties is assessed individually by management based on the specific facts and circumstances.
iv. | Impairment |
An impairment loss is recognized for the amount by which an asset’s or cash-generating unit’s carrying amount exceeds its recoverable amount. To determine the recoverable amount, management estimates expected future cash flows from each asset or cash-generating unit and determines a suitable interest rate in order to calculate the present value of those cash flows. In the process of measuring expected future cash flows management makes assumptions about future operating results. These assumptions relate to future events and circumstances. The actual results may vary, and may cause significant adjustments to our assets within the next financial year. The calculation of impairment loss involves significant estimates and assumptions which include revenue and earnings multiples, growth rates and net margins used to calculate projected future cash flows, risk-adjusted discount rate and future economic and market conditions.
In most cases, determining the applicable discount rate involves estimating the appropriate adjustment to market risk and the appropriate adjustment to asset-specific risk factors.
138
v. | Valuation of derivative financial instruments |
Management uses appropriate valuation techniques, such as binomial lattice model, in measuring the fair value of derivative financial instruments, where active market quotes are not available. In applying the valuation techniques, management makes maximum use of market inputs, and uses estimates and assumptions that are, as far as possible, consistent with observable data that market participants would use in pricing the instrument. Where applicable data is not observable, management uses its best estimate about the assumptions that market participants would make. These estimates may vary from the actual prices that would be achieved in an arm’s length transaction at the reporting date.
vi. | Accounting for defined benefit plans |
In accounting for pension and post-retirement benefits, several statistical and other factors that attempt to anticipate future events are used to calculate plan expenses and liabilities. These factors include expected return on plan assets, discount rate assumptions and rate of future compensation increases. To estimate these factors, actuarial consultants also use estimates such as withdrawal, turnover, and mortality rates which require significant judgment. The actuarial assumptions used by us may differ materially from actual results in future periods due to changing market and economic conditions, regulatory events, judicial rulings, higher or lower withdrawal rates, or longer or shorter participant life spans.
vii. | Share-based compensation expense |
The share-based compensation expense is determined based on our estimate of equity instruments that will eventually vest and valuation using the Monte-Carlo simulation and the binomial lattice model.
viii. | Business combinations |
Business combinations are accounted for using the acquisition method under the provisions of IFRS 3 (Revised), “Business Combinations.”
The cost of an acquisition is measured at the fair value of the assets transferred, equity instruments issued, and liabilities incurred at the date of acquisition. The cost of the acquisition also includes the fair value of any contingent consideration. Identifiable tangible and intangible assets acquired, and liabilities and contingent liabilities assumed in a business combination are measured initially at their fair value on the date of acquisition. Significant estimates are required to be made in determining the value of contingent consideration and intangible assets.
Contingent consideration liability is remeasured to fair value at each reporting date until the contingency is resolved, any changes in fair value are recognized in consolidated statement of income.
ix. | Impairment of non-derivative financial assets |
We apply the forward-looking ECL model for recognizing impairment loss on financial assets that are measured at amortized cost or at fair value through other comprehensive income (“FVOCI”). Loss allowance for trade receivables and unbilled revenue with no significant financing component are measured at an amount equal to lifetime ECL. We apply the simplified approach for determining the lifetime ECL allowance using our historical credit loss experience adjusted for factors that are specific to the debtor.
For all other financial assets, we recognize lifetime ECL when there has been a significant increase in credit risk since initial recognition. However, if the credit risk on the financial instruments has not increased significantly since the initial recognition, we measure the loss allowance for that financial instrument equal to 12-month ECL. The impairment assessment is performed annually and the amount of ECL (or reversal) that is required to adjust the loss allowance at the reporting date is recognized as an impairment gain/loss under “General and administrative expenses” in the consolidated statement of income.
x. | Leases |
We determine the lease term as the non-cancellable period of a lease including any option to extend or terminate the lease, if the use of such option is reasonably certain. We make an assessment on the expected lease term on a lease-by-lease basis and thereby assesses whether it is reasonably certain that any options to extend or terminate the contract will be exercised. In evaluating the lease term, we consider factors such as any significant leasehold improvements undertaken over the lease term, costs relating to the termination of the lease and the importance of the underlying asset to operations, taking into account the location of the underlying asset and the availability of suitable alternatives. The lease term in future periods is reassessed to ensure that the lease term reflects the current economic circumstances. We have applied an incremental borrowing rate for the purpose of computing lease liabilities based on the rate prevailing in respective geographies.
xi. | Property and equipment |
We depreciate property and equipment on a straight-line basis over the estimated useful lives of assets. The useful lives are based on historical experience with similar assets as well as anticipation of future events, which may impact their useful lives.The estimated useful lives of assets are reviewed at least annually.
139
Share Repurchases
In fiscal 2021, our shareholders authorized a share repurchase program for the repurchase of up to 3,300,000 ADSs, at a price range of $10 to $110 per ADS. Pursuant to the terms of the repurchase program, our ADSs may be purchased in the open market from time to time for 36 months from April 1, 2021, the date the shareholders resolution approving the repurchase program was passed. We were not obligated under the repurchase program to repurchase a specific number of ADSs, and the repurchase program may be suspended at any time at our discretion. We held the shares underlying any such repurchased ADSs as treasury shares.
In fiscal 2022, we purchased 1,100,000 ADSs in the open market for a total consideration of $85.0 million (including transaction costs) under the above-mentioned share repurchase program. We funded the repurchases under the repurchase program with cash on hand. In fiscal 2022, we cancelled 2,200,000 ADSs that were held as treasury shares for an aggregate cost of $163.7 million (including share cancellation charges $0.1 million). The effect of the cancellation of these treasury shares was recognized in share capital amounting to $0.3 million and in share premium amounting to $163.4 million, in compliance with Jersey law. There was no effect on the total shareholders’ equity as a result of this cancellation.
In fiscal 2023, we purchased 1,100,000 ADSs in the open market for a total consideration of $81.6 million (including transaction costs) under the above-mentioned share repurchase program. We funded the repurchases under the repurchase program with cash on hand. In fiscal 2023, based on authorization from the Board of Directors, we cancelled 1,100,000 ADSs that were held as treasury shares for an aggregate cost of $81.7 million (including share cancellation charges $0.1 million). The effect of the cancellation of these treasury shares was recognized in share capital amounting to $0.1 million and in share premium amounting to $81.6 million, in compliance with Jersey law. There was no effect on the total shareholders’ equity as a result of this cancellation.
In fiscal 2024, we purchased 1,100,000 ADSs in the open market for a total consideration of $85.6 million (including transaction costs) under the above-mentioned share repurchase program and concluded the program. We funded the repurchases under the repurchase program with cash on hand. In fiscal 2024, we received authorization from the Board of Directors to cancel, and cancelled, 1,100,000 ADSs that were held as treasury shares for an aggregate cost of $85.7 million (including share cancellation charges). The effect of the cancellation of these treasury shares was recognized in share capital amounting to $0.1 million and in share premium amounting to $85.5 million, in compliance with Jersey law. There was no effect on the total shareholders’ equity as a result of this cancellation.
In fiscal 2024, our shareholders authorized a new share repurchase program for the repurchase of up to 3,300,000 of our ADSs, each representing one ordinary share, at a price range of $10 to $180 per ADS. Pursuant to the terms of the repurchase program, our ADSs may be purchased in the open market from time to time for 42 months from October 1, 2023 to March 31, 2027. We are not obligated under the repurchase program to repurchase a specific number of ADSs, and the repurchase program may be suspended at any time at our discretion. We may fund the repurchases with internal or external sources.
In fiscal 2024, we purchased 2,200,000 ADSs in the open market for a total consideration of $129.7 million (including transaction costs) under the above-mentioned share repurchase program. In fiscal 2024, we received authorization from the Board of Directors to cancel, and cancelled, 2,200,000 ADSs that were held as treasury shares for an aggregate cost of $129.8 million (including share cancellation charges $0.1 million). The effect of the cancellation of these treasury shares was recognized in share capital amounting to $0.3 million, in share premium amounting to $41.1 million and in retained earnings amounting to $88.4 million, in compliance with Jersey law. There was no effect on the total shareholders’ equity as a result of this cancellation.
From February 8, 2024 to May 10, 2024, we purchased 1,200,000 ADSs in the open market for a total consideration of $71.5 million (including transaction costs) under the above-mentioned share repurchase program pursuant to a repurchase plan under Rule 10b5-1 of the Exchange Act that we entered into on February 2, 2024.
In March 2024, we terminated our ADS facility and exchanged outstanding ADSs for ordinary shares. Due to this termination, the remaining 1.1 million ADSs yet to be repurchased under the above share repurchase program have become unavailable for repurchase until we obtain an approval from our shareholders for repurchasing of an equivalent amount of ordinary shares. We will hold an extraordinary general meeting on May 30, 2024, at which shareholders will be requested to authorize the purchase of the remaining 1.1 million ordinary shares.
140
ITEM 6. DIRECTORS, SENIOR MANAGEMENT AND EMPLOYEES
A. Directors and Executive Officers
Our Board of Directors consists of nine directors. The following table sets forth the name, age (as at March 31, 2024) and position of each of our directors and executive officers as at the date hereof.
Name |
Age | |||||||
Directors |
||||||||
Timothy L. Main (1)(2) |
66 | Non-Executive Chairman | ||||||
Jason Liberty (3) |
48 | Director | ||||||
Keshav R. Murugesh |
60 | Director and Group Chief Executive Officer | ||||||
Françoise Gri (1)(4) |
66 | Director | ||||||
Keith Haviland (5) |
65 | Director | ||||||
Mario P. Vitale (5) |
68 | Director | ||||||
Lan Tu(2)(6) |
57 | Director | ||||||
Diane de Saint Victor(1)(2) |
69 | Director | ||||||
Judy Marlinski(5) |
60 | Director | ||||||
Executive Officers |
||||||||
Keshav R. Murugesh |
60 | Group Chief Executive Officer | ||||||
Sanjay Puria |
50 | Group Chief Financial Officer | ||||||
Swaminathan Rajamani |
47 | Chief People Officer |
Notes:
(1) | Member of our Compensation Committee. |
(2) | Member of our NCG &ESG Committee. |
(3) | Chairman of our Audit Committee. |
(4) | Chairperson of our NCG & ESG Committee. |
(5) | Member of our Audit Committee. |
(6) | Chairperson of our Compensation Committee. |
Summarized below is relevant biographical information covering at least the past five years for each of our directors and executive officers.
Directors
Timothy L. Main was appointed to our Board of Directors in June 2021, and he also serves on our Compensation and NCG & ESG Committee. In September 2021, he was appointed as a Non-Executive Chairman of the Board. He serves on the Board of Quest Diagnostics as a Director, Chair of the Cybersecurity Committee and a member of the Audit & Finance and Governance committees. He also serves on the Board of Utopic Software. Most recently, he was a Trustee in Shorecrest Preparatory School. He has spent his entire career in the B2B services or outsourcing environment, including more than 25 years at Jabil, a leading provider of manufacturing services with a global operational footprint. He was the non-executive Chairman of the Board of Directors and a member of the Cyber Committee at Jabil Inc. During his tenure as Chief Executive Officer of Jabil, he led the company’s transformation and growth through organic growth and strategic acquisitions. He has rich experience and a distinguished track record in international operations, corporate governance, vision and strategy, and technology-led growth. Mr. Main holds degrees from Michigan University and the Thunderbird School of Global Management. The business address of Mr. Main is 515, Madison Avenue, 8th Floor, New York, NY 10022, United States.
141
Françoise Gri was appointed to our Board of Directors in May 2015 and is the Chairperson of our NCG & ESG committee and a Member of Compensation Committee. She brings over 32 years of international business experience to WNS. She is a Board Member of Omnes Education (formerly INSEEC U), a private multidisciplinary higher education and research institution. She also serves as the Chairperson on Board of Maisons du Monde and a Director of Francaise Des Jeux. Most recently, she served as a Director on the Boards of Edenred, Credit Agricole & Credit Agricole Corporate & Investment Bank and as a chairperson of the Risk Committee at Crédit Agricole. She also served as Chief Executive Officer of Pierre & Vacances-Center Parcs Group, a European leader in local tourism. In her previous roles, she was Executive Vice President – France, and then for all of Southern Europe, at Manpower, Inc., a workforce solutions company which she joined in 2007. During her 26-year career at IBM, she served in various executive positions, being at last as the President and Country GM for IBM France. Ms. Gri has a Master of Science degree in computer engineering from Ecole Nationale Superieure d’Informatique et Mathematiques Appliquees in Grenoble, France. The business address of Ms. Gri is Malta House, 36-38 Piccadilly, London, W1J 0DP.
Keith Haviland was appointed to our Board and Audit Committee in July 2017. He brings significant global technology and business experience to WNS, including strategic vision, executive leadership, operational execution and C-suite relationships. He spent 23 years with Accenture where he was a key founder of their offshore business model and technology global delivery network, establishing Accenture’s centers in India and other locations. He later became responsible for all client –facing technology services including consulting, systems integration and outsourcing. He finished his tenure at Accenture in 2013 as Senior Managing Director of Technology Services and a member of their Global Leadership Council. Currently, Keith is an Emmy nominated and award winning film producer and the founder of Haviland Digital Limited, a company dedicated to creating award-winning intelligent film, television and digital media. He also serves on the board of several private companies, namely,Mission Control Productions Limited, Caravan Media Limited, 35 Yard Development Limited, Tin Goose Films Ltd and as the sole Director of Spacewoman Films Limited. He is also a limited partner at Space Capital Partners GP LLC, Space Capital II LP & Space Capital III. Mr. Haviland received a Master of Arts degree from Gonville and Caius College,Cambridge University in Mathematics and Management Science and is Fellow of the British Computer Society, a Fellow of the Institution of Engineering and Technology and a Liveryman of the Worshipful Company of Information Technologists. The business address of Mr. Haviland is Malta House, 36-38 Piccadilly, London, W1J 0DP.
Mario P. Vitale was appointed to the WNS’s Board and Audit Committee in October 2017. He has over 42 years of experience in the insurance industry. Currently, Mr. Vitale serves as the Chief Executive Officer of Resilience Cyber Insurance Solutions, a startup of a cyber-insurance platform for insurance. He also serves as a CEO of Vitality Risk, LLC and as a Board Chairman of Resilience Bermuda (wholly subsidiary entity of Resilience Cyber Insurance Solutions). Most recently, he was also a member of the advisory board of Kalepa Insurance and Director on the Board of Broad Street Partners, an insurance brokerage Services Company. He also served as the Trustee of St John’s University College of Insurance and as a Director of Growth source Academy, a non-profit organization. He was the Chief Executive Officer of Aspen Insurance, a leading specialty insurer. In his previous roles, he has been the Chief Executive Officer of Zurich Insurance Group’s Global Corporate business in North America from October 2006 to March 2011 and the Chief Executive Officer of Willis North America from January 2000 to October 2006. He was the Chairman of the Board of Blue Marble, a micro-insurance company from February 2016 to April 2017. Mr. Vitale has a Bachelor of Arts degree in Risk Management from St. John’s University — The Peter J. Tobin College of Business. The business address of Mr. Vitale is 515 Madison Avenue, 8th Floor, New York, NY 10022.
Jason Liberty was appointed to our Board of Directors in February 2020. Mr. Liberty is the Chairman of our Audit Committee. Mr. Liberty has over 26 years of finance experience and deep domain expertise in the travel and leisure vertical. Currently, Mr. Liberty is the Director, President and Chief Executive Officer for Royal Caribbean Cruises Ltd (“Royal Caribbean”). Since joining Royal Caribbean in 2005, Mr. Liberty has had many roles, most recently as Executive Vice President and Chief Financial Officer. In his former role he was responsible for overseeing their finance and accounting, strategy, shared service operations, technology, supply chain, port operations, legal and risk management functions. Before joining Royal Caribbean Cruises Ltd., he was a senior manager with KPMG, LLP. Mr. Liberty earned his Master of Business Administration degree from University of North Carolina at Chapel-Hill, Kenan-Flagler Business School. The business address of Mr. Liberty is 515 Madison Avenue, 8th Floor, New York, NY 10022.
Lan Tu was appointed to our Board in February 2022 and serves as the Chairperson of our Compensation and member of our NCG & ESG Committees. Currently, Ms. Tu is the Senior Independent Director on the board of Shawbrook Bank Ltd. and Shawbrook Group PLC and a member of the Nominations, Remuneration, Risk and Audit committees.She also serves as a Non-Executive Director on the Board of PayPoint Group plc and is a member of the Nomination and Remuneration committees together with the Audit committee. She serves as the Vice-Chair and Independent Lay member (director) on the Council/ Board of King’s College London and is a member of its Remuneration, Audit and Risk committee and Staff and Culture Strategy committee. Ms.Tu is also a Director in Lonsdale Road Management Company Ltd. Ms. Tu brings more than 32 years of diverse business experience to WNS, especially in strategic growth and financial services. She also served as the first chief executive officer of Virgin Money Investments and as a Non-Executive Director at Arrow Global Group plc. Ms. Tu’s prior experience includes serving as the Chief Strategy Officer at Abrdn plc. She spent 12 years at American Express in a variety of roles. She began her career at McKinsey & Company in its London office. Ms. Tu holds a Master of Business Administration degree from Harvard Business School and a Joint Honors Bachelor of Science degree from King’s College London. The business address of Ms. Tu is Malta House, 36-38 Piccadilly, London, W1J 0DP.
142
Diane de Saint Victor was appointed to our Board in April 2023. Ms. De Saint Victor also serves on WNS’ Compensation and NCG & ESG committees. She brings decades of transformative business experience to WNS, including deep expertise in ESG and digital compliance, international law, talent management, and government relations. She has held senior-level roles with companies across varied industries during her career including global industrial, consumer goods, and financial services firms. Ms. De Saint Victor currently serves as a non-executive director on the boards of Imperial Brands, C&A BV, and as a Board Member of Global Center for Risk and Innovation (GCRI). Most recently, Ms. De Saint Victor served as a Director on Board of Transocean. She also served as an Executive Committee Member of ABB, a Switzerland based technology leader in electrification and automation, where she led the global legal function as General Counsel. Prior to joining ABB, she held executive positions at Airbus Group, SCA Hygiene, Honeywell International, General Electric, and GE Healthcare. She has previously held the position of non-executive director on the Barclays board. She holds a Business Law and an International Law degree from Paris, France Law School’. The business address of Ms. De Saint Victor is Malta House, 36-38 Piccadilly, London, W1J 0DP
Judy Marlinski was appointed to our Board in December 2023 and serves on our Audit Committee. She has over 35 years of experience in financial services and international markets, having held executive-level positions in the investment management and wealth management industries. Currently, she serves as the Chair of the Board of Independent Directors for Newton Investment Management, a subsidiary of BNY Mellon Investment Management, in North America and the UK. Most recently, Judy was the Head of Fidelity Investments Institutional Product and Advisory Solutions Group from 2020 to 2021. Previously, she served as President of Fidelity Institutional Asset Management (FIAM) from 2017 to 2020, Head of Fidelity Investments Product Solutions and Innovation from 2016-2017, and President and CEO of Fidelity International (FIL), Japan from 2011 to 2016. She holds a Master of Business Administration from Boston University and a Bachelor of Science from Cornell University. The business address of Ms. Marlinski is 515 Madison Avenue, 8th Floor, New York, NY 10022
Keshav R. Murugesh was appointed our Group Chief Executive Officer and director in February 2010. As CEO he leads the transformation of WNS’ business model throughout the years, resulting in the WNS’ leadership in digital-led business transformation, with clients investing heavily in Domain, Digital and Data to Insights. He also serves on the Board of WNS Cares Foundation, a company that focuses on WNS’s CSR arm and sustainability initiatives. Prior to joining WNS, Mr. Murugesh was the Chief Executive Officer of Syntel Inc., a Nasdaq-listed information technology company. He holds a Bachelor of Commerce degree and is a Fellow of The Institute of Chartered Accountants of India. Prior to Syntel, he worked in various capacities with ITC Limited, an affiliate of BAT Plc. between 1989 and 2002. Keshav also serves as the Chairperson of Confederation of Indian Industry (CII) UK which is a pivotal entity for Indian industries and the global business community that offers proactive and strategic assistance to Indian companies in UK. He also serves as Honorary Co-Chief Mentor and Non-executive member of Project Management Committee for the Kalpataru Center of Entrepreneurship on the “Industry 4.0” domain. Presently, he is an Executive Council member of the National Association of Software and Service Companies (“NASSCOM”), an industry association for the IT-BPM sector in India. He is also a Charter Member of the Board of Trustees for TiE Mumbai, which is a non-profit organization focused on fostering entrepreneurship though mentoring, networking, funding and incubation and a member on advisory board of Atlas Skilltech University, a self-financed academic university. Previously, he held the position of Director at the Data Security Council of India, a not-for-profit, industry body on data protection in India set up by NASSCOM (from 2019 to 2020) and Vice-Chairman of the Executive Council of NASSCOM. He was the Chairman of the Audit Committee of NASSCOM (from 2017 to 2018) of which he stepped off on being elected Vice Chairman of NASSCOM. He was the Honorary Chairman of The Confederation of Indian Industry – Western India’s Education Committee (from 2017 to 2018). He also served as a former chairman of the BPM Council at NASSCOM. From 2005 to 2011, he was the Chairman of Students in Free Enterprise, which is non-profit organization in India involved in educational outreach projects in partnership with businesses across the globe. Mr. Murugesh has been based in the UK since March 18, 2022. The business address of Mr. Murugesh is Malta House, 36-38 Piccadilly, W1J 0DP, London, United Kingdom.
143
Executive Officers
Keshav R. Murugesh is our Group Chief Executive Officer. Please see “— Directors” above for Mr. Murugesh’s biographical information.
Sanjay Puria serves as our Group Chief Financial Officer. He is based in Mumbai, India and leads WNS’s global finance, information technology and procurement services functions. Presently, he serves on the Board of WNS Cares Foundation. Mr. Puria has over 26 years of experience, out of which over 22 years have been in the offshore services industry. He is a veteran at WNS, having managed several key finance functions including corporate strategy, mergers and acquisitions, financial planning and analysis, and strategic business development before taking over as the Group Chief Financial Officer. Prior to WNS, he was at the helm of operations for a global provider of integrated information technology and knowledge process outsourcing solutions, where his role focuses on managing acquisitions, joint ventures, complex and multi-year contracts, strategizing on geographical expansion, revenue and cost management, pricing and commercials and implementation of LEAN initiatives. Mr. Puria is also a member of NASSCOM BPM Council, a not-for-profit industry association for IT-BPM sector in India. Mr. Puria is a Chartered Accountant from the Institute of Chartered Accountants of India and has passed the Certified Public Accountant examination from the American Institute of Certified Public Accountants. The business address of Mr. Puria is Gate 4, Godrej & Boyce Complex, Pirojshanagar, Vikhroli, (West) Mumbai 400 079, India. In April 2024, we announced that Mr. Puria will step down from his role as Chief Financial Officer effective July 25, 2024. We have appointed Mr. Arijit Sen, our corporate finance controller as our Group Chief Financial Officer effective the same date, succeeding Mr. Puria.
Swaminathan Rajamani is our Chief People Officer. Presently, he serves on the Board of WNS Cares Foundation. He leads WNS’s Human Resources function and is responsible for the entire gamut of people-oriented processes. Prior to joining WNS, he was with CA Technologies, where he served as Vice President — Human Resources and was the Country Head — HR for India. He has also served as Head of HR Operations at Syntel and thereafter, for a short while, was its Global HR Head. Prior to Syntel, he had a long tenure at GE spanning multiple roles such as Master Black Belt — HR and Assistant Vice President and Head — Operations for HR, Customer Research and Operational Analytics, apart from other roles in mergers and acquisitions. He is a certified Change Acceleration Coach and a keen practitioner of Six Sigma. He has a Masters in Social Work degree from the University of Madras. The business address of Mr. Rajamani is Gate 4, Godrej & Boyce Complex, Pirojshanagar, Vikhroli, (West) Mumbai 400 079, India.
144
B. Compensation
Compensation Discussion and Analysis
Compensation Objectives
Our compensation philosophy is to align employee compensation with our business objectives, so that compensation is used as a strategic tool that helps us recruit, motivate and retain highly talented individuals who are committed to our core values: clients first, integrity, respect, collaboration, learning and excellence. We believe that our compensation programs are integral to achieving our goal of “One WNS One Goal — Outperform!”
Our Compensation Committee is responsible for reviewing the overall goals and objectives of our executive compensation programs, as well as our compensation plans, and making changes to such goals, objectives and plans. Our Compensation Committee bases our executive compensation programs on the following objectives, which guide us in establishing and maintaining all of our compensation programs:
• | Pay Differentiation: Based on the Job Responsibility, Individual Performance and Company Performance. As employees progress to higher levels in our company, their ability to directly impact our results and strategic initiatives increases. Therefore, as employees progress, an increasing proportion of their pay is linked to company performance and tied to creation of shareholder value. |
• | Pay for Performance. Our compensation is designed to pay for performance and thus we provide higher compensation for strong performance and, conversely, lower compensation for poor performance and/or where company performance falls short of expectations. Our compensation programs are designed to ensure that successful, high-performing employees remain motivated and committed during periods of temporary downturns in our performance. |
• | Balanced in Focus on Long-Term versus Short-Term Goals. As part of our compensation philosophy, we believe that equity-based compensation should be higher for employees with greater levels of responsibility and influence on our long-term results. Therefore, a significant portion of these individuals’ total compensation is dependent on our long-term share price appreciation. In addition, our compensation philosophy seeks to incentivize our executives to focus on achieving short-term performance goals in a manner that supports and encourages long-term success and profitability. |
• | Competitive Value of the Job in the Marketplace. In order to attract and retain a highly skilled work force in a global market space, we remain competitive with the pay of other employers who compete with us for talent in relevant markets. |
• | Easy to understand. We believe that all aspects of executive compensation should be clearly, comprehensibly and promptly disclosed to employees in order to effectively motivate them. Employees need to easily understand how their efforts can affect their pay, both directly through individual performance accomplishments and indirectly through contributions to achieving our strategic, financial and operational goals. We also believe that compensation for our employees should be administered uniformly across our company with clear-cut objectives and performance metrics to eliminate the potential for individual supervisor bias. |
Our Compensation Committee also considers risk when developing our compensation programs and believes that the design of our compensation programs should not encourage excessive or inappropriate risk taking.
145
Components of Executive Compensation
The compensation of our executive officers consists of the following five primary components:
• | Base salary or, in the case of executive officers based in India, fixed compensation; |
• | Cash bonus or variable incentive; |
• | Equity incentive grants of RSUs; |
• | Other benefits and perquisites; and |
• | Severance benefits. |
The following is a discussion of our considerations in determining each of the compensation components for our executive officers.
Base Salary or Fixed Compensation
Base salary is a fixed element of our executives’ annual cash compensation, which is not tied to any performance criteria. We consider base salary an important part of an executive’s compensation and our Compensation Committee reviews each executive officer’s base salary annually as well as at the time of a promotion or other change in responsibility. Any base salary adjustments are usually approved early in the fiscal year, effective as at April 1, or as set out in the relevant employment agreement. The specific amount of base salary for each executive officer depends on the executive’s role, scope of responsibilities, experience and skills. Market practices are also considered in setting base salaries. Base salaries are intended to assist us in attracting executives and recognizing differing levels of responsibility and contribution among executives.
Cash Bonus or Variable Incentive
In addition to base salary, annual cash bonuses are another important piece of total compensation for our executive officers. Annual bonus opportunities are intended to support the achievement of our business strategies by tying a meaningful portion of compensation to the achievement of established objectives for the year. These objectives are discussed in more detail below. Annual bonus opportunities also are a key tool in attracting highly sought-after executives, and cash bonuses add a variable component to our overall compensation structure.
146
Equity Incentive Grants of RSUs
Our equity-based incentive program, through which we grant RSUs, is a key element of the total compensation for our executive officers. This equity-based incentive program is intended to attract and retain highly qualified individuals, align their long-term interests with those of our shareholders, avoid short-term focus and effectively execute our long-term business strategies. Our equity-based compensation is subject to multi-year vesting requirements by which executives’ gains can either be realized through (i) the achievement of set performance criteria and continued employment through the vesting period, or, simply, (ii) continued employment through the vesting period.
We believe that our executive officers should also own and hold our equity to further align their interests with the long-term interests of our shareholders and further promote our commitment to sound corporate governance practices. To achieve this, we have adopted share ownership guidelines, pursuant to which each executive officer is required to achieve their respective target share ownership level over a period of five years. For further details see “Part I — Item 6E. Share Ownership — Share Ownership Guidelines.”
Other Benefits and Perquisites
We provide benefits and perquisites to our executive officers that are generally available to and consistent with those provided to our other employees in the country in which the executive officer is located. We believe these benefits are consistent with the objectives of our compensation philosophy and allow our executive officers to work more efficiently. Such benefits and perquisites are intended to enhance the competitiveness of our overall compensation program. Such benefits normally include medical, accidental and life insurance coverage, retirement benefits, club membership, reimbursement of telephone expenses, a car and related maintenance expenses, leased residential accommodation and other miscellaneous benefits which are customary in the location where the executive officer resides and are generally available to other employees in the country. All executive officers are covered by the directors’ and officers’ liability insurance policy maintained by us.
Severance Benefits
Under the terms of our employment agreements, we are sometimes obligated to pay severance or other enhanced benefits to our executive officers upon termination of their employment.
Our executive officers globally have enhanced levels of benefits based on their job level, seniority and probable loss of employment after a change in control. Executive officers generally are paid severance for a longer period as compared to other employees.
• | Accelerated vesting of equity awards. All granted but unvested share options and RSUs would vest immediately and become exercisable (in the case of share options) by our executive officers subject to certain conditions set out in the applicable equity incentive plans or their individual employment agreements. |
• | Severance and notice payment. Eligible terminated executive officers would receive severance and notice payments as reflected in their individual employment agreements. |
• | Benefit continuation. Eligible terminated executive officers would receive basic employee benefits such as medical and life insurance and other perquisites as reflected in their individual employment agreements. |
In addition, we provide change in control severance protection to certain executive officers. Our Compensation Committee believes that such protection is intended to preserve employee morale and productivity and encourage retention in the face of the disruptive impact of an actual or rumored change in control. In addition, for executive officers, the program is intended to align executive officers’ and shareholders’ interests by enabling executive officers to consider corporate transactions that are in the best interests of our shareholders and other constituents without undue concern over whether the transactions may jeopardize the executive officers’ own interest or employment.
147
Our Assessment Process
Our Compensation Committee has established a number of processes to assist it in ensuring that our executive compensation programs are achieving their objectives. Our Compensation Committee typically reviews each component of compensation at least every 12 months with the goal of allocating compensation between long-term and currently paid compensation and between cash and non-cash compensation, and combining the compensation elements for each executive in a manner we believe best fulfills the objectives of our compensation programs.
Our Compensation Committee is responsible for reviewing the performance of each of our executive officers, approving the compensation level of each of our executive officers, establishing criteria for the grant of equity awards for each of our executive officers and approving such equity grants. Each of these tasks is generally performed annually by our Compensation Committee.
There are no predetermined individual or corporate performance factors or goals that are used by our Compensation Committee to establish the amounts or mix of any elements of compensation for the executive officers. Our Compensation Committee works closely with our Group Chief Executive Officer, discussing with him our company’s overall performance and his evaluation of and compensation recommendations for our executive officers. From time to time, our Compensation Committee also seeks the advice and recommendations of an external compensation consultant to benchmark certain components of our compensation practices against those of its peers. The companies selected for such benchmarking include companies in similar industries and generally of similar sizes and market capitalizations. Where compensation information is not available for any specific position an executive officer holds for companies that provide business and technology services, our Compensation Committee reviews data corresponding to the most comparable position and also considers the comparative experience of executives.
Our Compensation Committee then utilizes its judgment and experience in making all compensation determinations. Our Compensation Committee’s determination of compensation levels is based upon what the members of the committee deem appropriate, considering information such as the factors listed above, as well as input from our Group Chief Executive Officer and, from time to time, information and advice provided by an independent compensation consultant.
Other processes that our Compensation Committee has established to assist in ensuring that our compensation programs operate in line with their objectives are:
• | Assessment of Company Performance: Our Compensation Committee uses financial performance measures to determine a significant portion of the size of payouts under our cash bonus program. The financial performance measures, adopted on improving both top line (which refers to our revenue less repair payments (non-GAAP) as described in “Part I — Item 5. Operating and Financial Review and Prospects — Overview”) and bottom line (which refers to our adjusted net income (“ANI”) (non-GAAP), which is calculated as our profit excluding goodwill & intangible impairment, share-based compensation expense, acquisition-related expenses or benefits, costs related to the termination of ADS program and listing of ordinary shares, costs related to the transition to voluntarily reporting on US domestic issuer forms and amortization of intangible assets and including the tax effect thereon, and other measures, such as our adjusted operating margin are pre-established by our Compensation Committee annually. When the pre-determined financial measures are achieved, executive officers receive amounts that are set for these targets. These measures reflect targets that are intended to be aggressive but attainable. The remainder of an individual’s payout under our cash bonus program is determined by the achievement of individual performance objectives. |
• | Assessment of Individual Performance: Individual performance has a strong impact on the compensation of all employees, including our executive officers. The evaluation of an individual’s performance determines a portion of the size of payouts under our cash bonus program and also influences any changes in base salary. Our Compensation Committee, along with our Group Chief Executive Officer, set the respective performance objectives for the fiscal year for the executive officers. The performance objectives are initially proposed by our Group Chief Executive Officer and modified, as appropriate, by our Compensation Committee based on the performance assessment conducted for the preceding fiscal year and also looking at goals for the current fiscal year. Every evaluation metric is supplemented with key performance indicators. At the end of the fiscal year, our Group Chief Executive Officer discusses individuals’ respective achievement of the pre-established objectives as well as their contribution to our company’s overall performance and other leadership accomplishments. This evaluation is shared with our Compensation Committee. After the discussion, our Compensation Committee, in discussion with our Group Chief Executive Officer, assigns a corresponding numerical performance rating that translates into specific payouts under our cash bonus program and also influences any changes in base salary. |
148
The Compensation Committee approves awards under our cash bonus or variable incentive program consistent with the achievement of applicable goals.
The Committee on occasion makes exceptions to payments in strict accordance with achievement of goals based on unusual or extraordinary circumstances. Executive officers must be on the payroll of our company on the last day of the fiscal year, March 31, to be eligible for payment under our cash bonus or variable incentive program.
Compensation decisions are designed to promote our fundamental business objectives and strategy. Our Compensation Committee periodically reviews matters such as succession planning, management performance and the business environment and considers such matters in making compensation decisions.
Benchmarking and Use of Compensation Consultant in Fiscal 2024
During fiscal 2024, our Compensation Committee reviewed compensation programs for our executive officers against publicly available compensation data, which was compiled directly by our external compensation consultant. The companies selected by our external compensation consultant for its survey for benchmarking our executive officers’ compensation included companies in similar industries and generally of similar sizes and market capitalizations.
The list of peer companies against which we benchmarked the compensation of our Group Chief Executive Officer and named executive officers in fiscal 2024 included the following:
Peer Group Companies for Named Executive Officers other than the Group Chief Executive Officer* | ||||
Accenture | Genpact | Wipro | ||
Cognizant | HCL Technologies | |||
EXL Services | Infosys | |||
Peer Group Companies for the Group Chief Executive Officer | ||||
Cognizant | Genpact | Wipro | ||
Conduent | HCL Technologies | |||
EXL Services | Teleperformance |
* | Different subsets of the peer group were used for different named executive officers depending on the officer’s position and geographic location. |
149
Our Compensation Committee used the data derived by our external compensation consultant primarily to ensure that our executive compensation programs are competitive. A selected subset of peer companies from those listed above that were found most closely comparable as benchmark for a particular position were considered to arrive at the compensation benchmark review of individual executive officers. Where compensation information was not publicly disclosed for a specific management position in the relevant industry, our Compensation Committee reviewed data corresponding to the most comparable position and also considered the comparative experience of the relevant executive officers.
There is enough flexibility in the existing compensation programs to respond and adjust to the evolving business environment. Accordingly, an individual’s compensation elements could be changed by our Compensation Committee based on changes in job responsibilities of the executive. In addition to input from our external compensation consultant’s survey, our Compensation Committee also took into consideration our performance and industry indicators in deciding our compensation for fiscal 2024.
Based on the elements listed above and in line with our compensation philosophy, in fiscal 2024 our Compensation Committee adjusted our executive officers compensation as described in “—Executive Compensation for Fiscal 2024” below.
Executive Compensation for Fiscal 2024
Total Compensation of Executive Officers
The following table sets forth the total compensation paid or proposed to be paid to each of our Group Chief Executive Officer, Group Chief Financial Officer and other named executive officers for services rendered in fiscal 2024 (excluding grants of RSUs which are described below).
Name |
Base Salary (1) | Benefits | Bonus | Other Payments (2) |
Total | |||||||||||||||
Keshav Murugesh |
$ | 958,157 | $ | 543,010 | $ | 1,234,958 | $ | — | $ | 2,736,125 | ||||||||||
Sanjay Puria |
$ | 460,289 | $ | 59,304 | $ | 497,264 | $ | — | $ | 1,016,857 | ||||||||||
Gautam Barai |
$ | — | $ | 34,611 | $ | — | $ | 593,875 | $ | 628,486 | ||||||||||
R Swaminathan |
$ | 443,036 | $ | 56,148 | $ | 478,616 | $ | — | $ | 977,800 | ||||||||||
|
|
|
|
|
|
|
|
|
|
|||||||||||
Total |
$ | 1,861,482 | $ | 693,073 | $ | 2,210,838 | $ | 593,875 | $ | 5,359,268 | ||||||||||
|
|
|
|
|
|
|
|
|
|
Note:
(1) | Base salary does not include amount contributed towards provident fund which is set out in the table under “—Other Benefits and Perquisites.” |
(2) | Other payments include one-time ex-gratia payment made to Gautam Barai upon his separation from the company. |
Base Salary or Fixed Compensation
In reviewing base salaries for executive officers, our Compensation Committee reviewed compensation programs for our executive officers against publicly available compensation data compiled by our external compensation consultant and considered local market conditions, market data, the executive officer’s experience and responsibilities, the perceived risk of having to replace the named executive officer and the fact that the executive officers in fiscal 2024 had satisfactorily performed against their prior year’s individual performance objectives.
150
Our Compensation Committee has made the following determinations on the executive officers base salary:
• | Mr. Keshav R. Murugesh’s base salary was $ 933,025. The salary revision was effective February 19, 2023. |
• | Mr. Sanjay Puria’s base salary (including employer contribution towards Provident Fund (Retirement Benefit)) was $ 398,725 to $ 483,303 in fiscal 2024. The salary revision was effective April 1, 2023. |
• | Mr. Swaminathan Rajamani’s base salary (including employer contribution towards Provident Fund (Retirement Benefit) was revised from $ 380,601 to $ 465,180 in fiscal 2024. The salary revision effective April 1, 2023. |
Cash Bonus or Variable Incentive
Our Compensation Committee believes that the executive officers must work as a team and focus primarily on company goals rather than solely on individual goals. Our Compensation Committee believes that enhancing the long-term value of our company requires increased revenue (both from existing and new clients), improved contribution and increased ANI (non-GAAP). Finally our Compensation Committee believes it must also reward and encourage individual performance and therefore assigned certain weightages of the variable incentive to company and individual objectives, including achievement of targets for our revenue less repair payments (non-GAAP), ANI (non-GAAP) and certain individual goals for various executive officers. Such bonuses are typically paid in April and/or May each year. The aggregate amount of all cash bonuses to be paid for fiscal 2024 does not exceed the aggregate cash bonus pool approved by our Compensation Committee for fiscal 2024. Each of our executive officers’ variable incentive packages for fiscal 2024 are as described below:
Our Compensation Committee set Mr. Murugesh’s target variable incentive, or cash bonus, at $ $1,166,281 for 100% achievement of objectives. Our Compensation Committee assigned as Mr. Murugesh’s performance objectives the achievement of targets for our revenue less repair payments (non-GAAP) and ANI (non-GAAP), and individual performance objectives. Mr. Murugesh earned 105.9% of his target variable incentive amount on an overall basis.
Our Compensation Committee set Mr. Puria’s target variable incentive for 2024 at $ 483,303 for 100% achievement of objectives. Our Compensation Committee assigned as Mr. Puria’s performance objectives the achievement of targets for our revenue less repair payments (non-GAAP) and ANI (non-GAAP), and individual performance objectives. Based on actual performance against these various objectives, Mr. Puria earned 102.9% of his target variable incentive amount on an overall basis.
Our Compensation Committee set Mr. Swaminathan’s target variable incentive for 2024 at $ $465,180 for 100% achievement of objectives. Our Compensation Committee assigned as Mr. Swaminathan’s performance objectives the achievement of targets for our revenue less repair payments (non-GAAP) and ANI (non-GAAP), and individual performance objectives. Based on actual performance against these various objectives, Mr. Swaminathan earned 102.9% of his target variable incentive amount on an overall basis.
151
Equity Incentive Grants of RSUs
During fiscal 2024, we continued the equity incentive scheme which has a vesting schedule linked to continued employment with our company through vesting date, achievement of financial performance targets and achievement of total shareholder return performance targets.
Consistent with our philosophy on equity grants to our executive offiers, we awarded the following number of RSUs to our executive officers during fiscal 2024:
Name |
Date of Grant | Total RSUs granted for fiscal 2024 |
Grant date fair value (1) ($) |
|||||||||
Keshav Murugesh |
25-Apr-23 | 180,750 | (2) | 90.18 | ||||||||
Sanjay Puria |
25-Apr-23 | 26,250 | (3) | 90.18 | ||||||||
R Swaminathan |
25-Apr-23 | 23,100 | (3) | 90.18 |
Notes:
(1) | The amounts shown under this column reflect the dollar amount of the weighted average grant date fair value of equity-based RSUs granted during the year. |
(2) | The RSUs granted (comprising a base award and an additional award of up to 50% of the base award granted for the achievement of specified performance criteria) vests according to the following schedule: 3.75% of the base award vests quarterly on the completion of each of the first eight quarters following the grant date, subject to the grantee’s continued employment with our company through the vesting date; 2.50% of the base award vests quarterly on the completion of each of the following four quarters, subject to the grantee’s continued employment with our company through the vesting date; and 60% of the base award vests on the third anniversary of the grant date, subject to the grantee’s continued employment with our company through the vesting date and the achievement of conditions relating to our Company’s financial and total shareholder’s return performance as determined by our Compensation Committee. The grantee will be eligible for additional RSUs of up to 50% of the base award on the third anniversary of the grant date, subject to the grantee’s continued employment with our company through the vesting date and the achievement of conditions relating to our Company’s financial and total shareholder’s return performance as determined by our Compensation Committee. The fair value of RSUs based on service and achievement of financial performance is generally the market price of our shares on the date of grant and for total shareholder’s return performance based RSUs, it is determined using the Monte-Carlo simulation. |
(3) | The RSUs granted (comprising a base award and an additional award of up to 50% of the base award granted for the achievement of specified performance criteria) vest according to the following schedule: 3.33% of the base award vests quarterly on the completion of each of the first twelve quarters following the grant date, subject to the grantee’s continued employment with our company through the vesting date; and 60% of the base award vests on the third anniversary of the grant date, subject to the grantee’s continued employment with our company through the vesting date and the achievement of conditions relating to our Company’s financial and total shareholder’s return performance as determined by our Compensation Committee. The grantee will be eligible for additional RSUs of up to 50% of the base award on the third anniversary of the grant date, subject to the grantee’s continued employment with our company through the vesting date and the achievement of conditions relating to our Company’s financial and total shareholder’s return performance as determined by our Compensation Committee. The fair value of RSUs based on service and achievement of financial performance is generally the market price of our shares on the date of grant and for total shareholder’s return performance based RSUs, it is determined using the Monte-Carlo simulation. |
152
Other Benefits and Perquisites
The retirement plans, health and welfare benefits provided to executive officers are the same plans and benefits available to all other employees of our company.
All directors and officers, including executive officers, are covered by the directors’ and officers’ liability insurance policy maintained by our company.
Additional perquisites provided to our executive officers in fiscal 2024 are summarized below:
Name |
Social Security |
Insurance benefits |
Tax Reimbursement |
Club Membership |
Other Benefits |
Total | ||||||||||||||||||
Keshav Murugesh |
$ | 370,711 | $ | 82,871 | $ | 34,861 | $ | 9,904 | $ | 44,663 | $ | 543,010 | ||||||||||||
Sanjay Puria |
$ | 23,199 | $ | 33,084 | $ | 3,021 | $ | — | $ | — | $ | 59,304 | ||||||||||||
Gautam Barai |
$ | — | $ | 31,590 | $ | 3,021 | $ | — | $ | — | $ | 34,611 | ||||||||||||
R Swaminathan |
$ | 22,329 | $ | 30,798 | $ | 3,021 | $ | — | $ | — | $ | 56,148 | ||||||||||||
|
|
|
|
|
|
|
|
|
|
|
|
|||||||||||||
Total |
$ | 416,239 | $ | 178,343 | $ | 43,924 | $ | 9,904 | $ | 44,663 | $ | 693,073 | ||||||||||||
|
|
|
|
|
|
|
|
|
|
|
|
153
Non-executive Director Compensation for Fiscal 2024
Total Compensation of Non-executive Directors
The following table sets forth the compensation paid or proposed to be paid to our non-executive directors for services rendered in fiscal 2024 (excluding grants of RSUs which are described below):
Name |
Retainership Fees (1) |
Retainership fees for Board/Committee Chairman |
Total | |||||||||
John Freeland |
$ | 31,960 | (2) | $ | — | $ | 31,960 | |||||
Françoise Gri |
$ | 78,627 | $ | 16,783 | (3)(4) | $ | 95,410 | |||||
Keith Haviland |
$ | 78,627 | $ | — | $ | 78,627 | ||||||
Mario P. Vitale |
$ | 78,627 | $ | — | $ | 78,627 | ||||||
Jason Liberty |
$ | 78,627 | $ | 30,000 | (5) | $ | 108,627 | |||||
Timothy L Main |
$ | — | $ | 160,000 | $ | 160,000 | ||||||
Lan Tu |
$ | 78,627 | $ | 23,552 | (6)(7) | $ | 102,179 | |||||
Diane de Saint Victor |
$ | 78,627 | $ | — | $ | 78,627 | ||||||
Judy Marlinski |
$ | 26,667 | $ | — | $ | 26,667 | ||||||
|
|
|
|
|
|
|||||||
Total |
$ | 530,389 | $ | 230,335 | $ | 760,724 | ||||||
|
|
|
|
|
|
Notes:
(1) | Retainership fees for Board of Directors revised to $80,000 from earlier $75,000 per annum w.e.f July 18, 2023. (The above calculation is based on prorate basis as per revision in fees) |
(2) | Fees paid to Mr. John Freeland as a Director till August 31, 2023 in fiscal 2024. He retired as a Director effective end of day August 31, 2023. |
(3) | Fee paid to Ms. Françoise Gri for serving as Chairperson of our NCG & ESG Committee in fiscal 2024. |
(4) | Retainership fees for the Chairperson of NCG & ESG Committee revised to $17,500 from earlier $15,000 per annum w.e.f July 18, 2023. (The above calculation is based on prorate basis as per revision in fees) |
(5) | Fee paid to Mr. Jason Liberty for serving as Chairman of our Audit Committee in fiscal 2024. |
(6) | Fees paid to Ms. Lan Tu for serving as Chairperson of our Compensation Committee in fiscal 2024. |
(7) | Retainership fees for the Chairperson of Compensation Committee revised to $25,000 from earlier $20,000 per annum w.e.f July 18, 2023. (The above calculation is based on prorate basis as per revision in fees) |
154
Equity Incentive Grants of RSUs to Non-executive Directors
The following table sets forth information concerning RSUs awarded to our non-executive directors in fiscal 2024 with a vesting period of one year. No options were granted in fiscal 2024.
Name |
Date of Grant |
Total RSUs granted for fiscal 2024 |
Grant date fair value (1) ($) |
|||||||||
Diane de Saint Victor |
25-Apr-23 | 1,710 | 90.18 | |||||||||
Timothy Main |
18-Jul-23 | 4,420 | 72.38 | |||||||||
John Freeland |
18-Jul-23 | 2,760 | 72.38 | |||||||||
Francoise Gri |
18-Jul-23 | 2,760 | 72.38 | |||||||||
Keith Haviland |
18-Jul-23 | 2,760 | 72.38 | |||||||||
Mario Vitale |
18-Jul-23 | 2,760 | 72.38 | |||||||||
Jason Liberty |
18-Jul-23 | 2,760 | 72.38 | |||||||||
Thi Nhuoc Lan Tu |
18-Jul-23 | 2,760 | 72.38 | |||||||||
Diane de Saint Victor |
18-Jul-23 | 2,760 | 72.38 | |||||||||
Judy Marlinski |
16-Jan-24 | 3,035 | 65.97 |
Note:
(1) | The amounts shown under this column reflect the dollar amount of the aggregate grant date fair value of equity-based RSUs granted during the year. The fair value of RSUs is generally the market price of our shares on the date of grant. |
Future grants of awards will continue to be determined by our Board of Directors or our Compensation Committee under the 2016 Incentive Award Plan.
155
Employment Agreement of our Executive Director
We entered into an employment agreement with Mr. Keshav R. Murugesh in February 2010, to serve as our Group Chief Executive Officer. The agreement was amended with effect from February 19, 2013, February 19, 2014, February 19, 2017 and March 18, 2022, in each case to revise Mr. Murugesh’s compensation (including share grants). The agreement provides for Mr. Murugesh’s appointment for an initial five-year term, which is renewed automatically for three additional successive terms of three years each (up to Mr. Murugesh attains the age of 60 years), unless either we or Mr. Murugesh elects not to renew the term. Mr. Murugesh’s term of appointment under the current agreement expires in August 2023 when Mr. Murugesh attains the age of 60 years.
We entered into a new employment agreement with Mr. Murugesh effective April 1, 2022 and his employment shall continue, until August 17, 2025.
Under the terms of the current agreement, Mr. Murugesh is entitled to receive compensation, health and other benefits and perquisites commensurate with his position. Pursuant to the current agreement, Mr. Murugesh will be eligible to receive annually such number of RSUs to be computed based on our average share price (taking the daily US dollar closing price) during March of the fiscal year preceding the date of such determination and the value of such grant shall not be less than eight times the sum of his annual base salary. Mr. Murugesh is entitled to receive additional performance-based grants for meeting additional performance-based criteria, the value of such grant being up to 50% of eight times the sum of his annual base salary. Any grants of RSUs to Mr. Murugesh will be made pursuant to and in accordance with our 2016 Incentive Award Plan.
If Mr. Murugesh’s employment is terminated by us without cause or by Mr. Murugesh for good reason (each as defined in the current agreement) or is terminated for any reason other than those specified in the current agreement (including, without limitation, expiration of his employment period or we elect not to extend his employment), he would be entitled to all accrued and unpaid salary, accrued and unused vacation and any unreimbursed expenses, his base salary for a period of 12 months from the effective date of termination which will be paid in monthly installments and his target bonus for the year in which the termination occurs, both of which will be paid immediately.
Further, where Mr. Murugesh’s employment is terminated for reasons of death, disability or retirement as specified in the current agreement, he would be entitled to all accrued and unpaid salary and bonus, accrued and unused vacation, any unreimbursed expenses and vested benefits and other amounts due to him under our employee benefit plans.
With respect to share options and RSUs:
If Mr. Murugesh’s employment is terminated by us without cause all share options and RSUs granted in the fiscal years 2020-21, 2021-22 and 2022-23 (excluding the grant made in August 2022) would become exercisable on a fully accelerated basis. Further, all share options and RSUs granted in the fiscal years 2023-24 and 2024-25 would vest in accordance with the vesting schedule.
If Mr. Murugesh’s employment is terminated by Mr. Murugesh for good reason (as defined in the employment agreement), all share options and RSUs granted in the fiscal years 2020-21, 2021-22, 2022-23, 2023-24 and 2024-25 would become exercisable on a fully accelerated basis.
If Mr. Murugesh’s employment is terminated due to death, disability all share options and RSUs granted in the fiscal years 2020-21, 2021-22, 2022-23, 2023-24 and 2024-25 would become exercisable on a fully accelerated basis.
If Mr. Murugesh’s employment is terminated by us for cause (as defined in the employment agreement) or by Mr. Murugesh due to resignation (as defined in the employment agreement), no share options and RSUs would be accelerated.
If Mr. Murugesh’s employment is terminated for any other reason other than the one specified above, all share options and RSUs granted in the fiscal years 2020-21, 2021-22, 2022-23, 2023-24 and 2024-25 would become exercisable on a fully accelerated basis.
If we experience a change in control (as defined in our 2006 Incentive Award Plan for awards granted under that plan or as defined in our 2016 Incentive Award Plan for awards granted under that plan) while Mr. Murugesh is employed under the current agreement, all of the share options and RSUs granted to Mr. Murugesh under the current agreement will vest and the share options and RSUs would become exercisable on a fully accelerated basis.
156
Employee Benefit Plans
2006 Incentive Award Plan
We adopted our 2006 Incentive Award Plan on June 1, 2006. The purpose of the 2006 Incentive Award Plan was to promote the success and enhance the value of our company by linking the personal interests of the directors, employees and consultants of our company and our subsidiaries to those of our shareholders and by providing these individuals with an incentive for outstanding performance. The 2006 Incentive Award Plan was further intended to provide us with the ability to motivate, attract and retain the services of these individuals. On February 13, 2009, we adopted the amended and restated 2006 Incentive Award Plan. The amended and restated 2006 Incentive Award Plan reflects, among other changes to our 2006 Incentive Award Plan, an increase in the number of ordinary shares and ADSs available for grant under the plan from 3.0 million to 4.0 million shares/ADSs, subject to specified adjustments under the plan. On September 13, 2011, we adopted the second amended and restated 2006 Incentive Award Plan that reflects an increase in the number of ordinary shares and ADSs available for granted under the plan to 6.2 million shares/ADSs, subject to specified adjustments under the plan. On September 25, 2013, we adopted the third amended and restated 2006 Incentive Award Plan that reflects an increase in the number of ordinary shares and ADSs available for grant under the plan to 8.6 million shares/ADSs, subject to specified adjustments under the plan. On May 31, 2016, our 2006 Incentive Award Plan expired pursuant to its terms.
Shares Available for Awards
Subject to certain adjustments set forth in the 2006 Incentive Award Plan, the maximum number of shares that could be issued or awarded under the 2006 Incentive Award Plan was equal to the sum of (x) 8,600,000 shares, (y) any shares that remained available for issuance under our 2002 Stock Incentive Plan (which was adopted on July 3, 2002 and terminated upon the effective date of our 2006 Incentive Award Plan), and (z) any shares subject to awards under the 2002 Stock Incentive Plan which terminated, expired or lapsed for any reason or were settled in cash on or after the effective date of our 2006 Incentive Award Plan. As at the date of termination of the 2002 Stock Incentive Plan on July 25, 2006, the day immediately preceding the date of pricing of our initial public offering, an aggregate of 6,082,042 of our ordinary shares had been authorized for grant under the 2002 Stock Incentive Plan. The maximum number of shares which could be subject to awards granted to any one grantee during any calendar year was 500,000 shares and the maximum amount that could be paid to a grantee in cash during any calendar year with respect to cash-based awards was $10,000,000. To the extent that an award terminated or was settled in cash, any shares subject to the award would again be available for the grant. Any shares tendered or withheld to satisfy the grant or exercise price or tax withholding obligation with respect to any award would not be available for subsequent grant. Except as described below with respect to independent directors, no determination was made as to the types or amounts of awards that would be granted to specific individuals pursuant to the 2006 Incentive Award Plan.
Administration. The 2006 Incentive Award Plan is administered by our Board of Directors, which may delegate its authority to a committee. We anticipate that our Compensation Committee will administer the 2006 Incentive Award Plan, except that our Board of Directors will administer the plan with respect to awards granted to our independent directors. The plan administrator determined eligibility, the types and sizes of awards, the price and timing of awards and the acceleration or waiver of any vesting restriction, provided that the plan administrator would not have the authority to accelerate vesting or waive the forfeiture of any performance-based awards.
Eligibility. Our employees, consultants and directors and those of our subsidiaries were eligible to be granted awards, except that only employees of our company and our qualifying corporate subsidiaries were eligible to be granted options that are intended to qualify as “incentive share options” under Section 422 of the United States Internal Revenue Code of 1986, as amended (the “Code”).
Awards
Options: The plan administrator was able to grant options on shares. The per share option exercise price of all options granted pursuant to the 2006 Incentive Award Plan would not be less than 100% of the fair market value of a share on the date of grant. No incentive share option could be granted to a grantee who owned more than 10% of our outstanding shares unless the exercise price was at least 110% of the fair market value of a share on the date of grant. To the extent that the aggregate fair market value of the shares subject to an incentive share option became exercisable for the first time by any option holder during any calendar year exceeded $100,000, such excess would be treated as a non-qualified option. The plan administrator would determine the methods of payment of the exercise price of an option, which could include cash, shares or other property acceptable to the plan administrator (and could involve a cashless exercise of the option). The plan administrator designated in the award agreement evidencing each share option grant may decide whether such share option would be exercisable for shares or ADSs. The award agreement could, in the sole discretion of the plan administrator, permit the option holder to elect, at the time of exercise, whether to receive shares or ADSs in respect of the exercised share option or a portion thereof. The term of options granted under the 2006 Incentive Award Plan could not exceed ten years from the date of grant. However, the term of an incentive share option granted to a person who owns more than 10% of our outstanding shares on the date of grant could not exceed five years. Under the 2006 Incentive Award Plan, the number of awards to be granted to our independent directors was determined by our Board of Directors or our Compensation Committee.
157
Restricted Shares. The plan administrator could grant shares subject to various restrictions, including restrictions on transferability, limitations on the right to vote and/or limitations on the right to receive dividends.
Share Appreciation Rights. The plan administrator could grant share appreciation rights representing the right to receive payment of an amount equal to the excess of the fair market value of a share on the date of exercise over the fair market value of a share on the date of grant. The term of share appreciation rights granted could not exceed ten years from the date of grant. The plan administrator could elect to pay share appreciation rights in cash, in shares or in a combination of cash and shares.
Performance Shares and Performance Share Units. The plan administrator could grant awards of performance shares denominated in a number of shares and/or awards of performance share units denominated in unit equivalents of shares and/or units of value, including dollar value of shares. These awards could be linked to performance criteria measured over performance periods as determined by the plan administrator.
Share Payments. The plan administrator could grant share payments, including payments in the form of shares or options or other rights to purchase shares. Share payments could be based upon specific performance criteria determined by the plan administrator on the date such share payments were made or on any date thereafter.
Deferred Shares. The plan administrator could grant awards of deferred shares linked to performance criteria determined by the plan administrator. Shares underlying deferred share awards would not be issued until the deferred share awards have vested, pursuant to a vesting schedule or upon the satisfaction of any vesting conditions or performance criteria set by the plan administrator. Recipients of deferred share awards generally have no rights as shareholders with respect to such deferred shares until the shares underlying the deferred share awards have been issued.
Restricted Share Units. The plan administrator could grant RSUs, subject to various vesting conditions. On the maturity date, we will transfer to the grantee one unrestricted, fully transferable share for each vested RSU scheduled to be paid out on such date. The plan administrator specified the purchase price, if any, to be paid by the grantee for such shares. Generally, a grantee will have to be employed by us on the date of payment of vested RSUs to be eligible to receive the payment of shares issuable upon vesting of the RSUs.
Performance Bonus Awards. The plan administrator could grant a cash bonus payable upon the attainment of performance goals based on performance criteria and measured over a performance period determined appropriate by the plan administrator. Any such cash bonus paid to a “covered employee” within the meaning of Section 162(m) of the Code could be a performance-based award as described below.
Performance-Based Awards. The plan administrator could grant awards other than options and share appreciation rights to employees who are or may be “covered employees,” as defined in Section 162(m) of the Code, that are intended to be performance-based awards within the meaning of Section 162(m) of the Code in order to preserve the deductibility of these awards for federal income tax purposes. Grantees are only entitled to receive payment for performance-based awards for any given performance period to the extent that pre-established performance goals set by the plan administrator for the period are satisfied. The plan administrator determined the type of performance-based awards to be granted, the performance period and the performance goals. Generally, a grantee will have to be employed by us on the date the performance-based award is paid to be eligible for a performance-based award for any period.
Adjustments. In the event of certain changes in our capitalization, the plan administrator has broad discretion to adjust awards, including without limitation, (i) the aggregate number and type of shares that could be issued under the 2006 Incentive Award Plan, (ii) the terms and conditions of any outstanding awards, and (iii) the grant or exercise price per share for any outstanding awards under such plan to account for such changes. The plan administrator also has the authority to cash out, terminate or provide for the assumption or substitution of outstanding awards in the event of a corporate transaction.
Change in Control. In the event of a change in control of our company in which outstanding awards are not assumed by the successor, such awards will generally become fully exercisable and all forfeiture restrictions on such awards will lapse. Upon, or in anticipation of, a change in control, the plan administrator may cause any awards outstanding to terminate at a specific time in the future and give each grantee the right to exercise such awards during such period of time as the plan administrator, in its sole discretion, determines.
158
Vesting of Full Value Awards. Full value awards (generally, any award other than an option or share appreciation right) will vest over a period of at least three years (or, in the case of vesting based upon attainment of certain performance goals, over a period of at least one year). However, full value awards that result in the issuance of an aggregate of up to 5% to the total issuable shares under the 2006 Incentive Award Plan may be granted without any minimum vesting periods. In addition, full value awards may vest on an accelerated basis in the event of a grantee’s death, disability, or retirement, or in the event of our change in control or other special circumstances.
Non-transferability. Awards granted under the 2006 Incentive Award Plan are generally not transferable.
Withholding. We have the right to withhold, deduct or require a grantee to remit to us an amount sufficient to satisfy federal, state, local or foreign taxes (including the grantee’s employment tax obligations) required by law to be withheld with respect to any tax concerning the grantee as a result of the 2006 Incentive Award Plan.
Termination or Amendment. On May 31, 2016, our 2006 Incentive Award Plan expired pursuant to its terms.
Outstanding Awards. As at March 31, 2024, RSUs to purchase an aggregate of 90,188 ordinary shares were outstanding, out of which RSUs to purchase NIL ordinary shares were held by all our directors and executive officers as a group. There is no purchase price for the RSUs.
RSU Grants Outside of our Plans
On June 1, 2016, June 14, 2016 and July 13, 2016, we issued an aggregate of 44,284 restricted share units to certain of our employees and directors pursuant to an exemption from registration under the United States federal securities laws. We did not seek shareholder approval for these issuances as they are not required under the laws of Jersey.
2016 Incentive Award Plan
We adopted our 2016 Incentive Award Plan on September 27, 2016. The purpose of the 2016 Incentive Award Plan is to promote the success and enhance the value of our company by linking the personal interests of the directors, employees, and consultants of our company and our subsidiaries to those of our shareholders and by providing such individuals with an incentive for outstanding performance to generate superior returns to our shareholders. The 2016 Incentive Award Plan is further intended to provide us with flexibility in our ability to motivate, attract, and retain the services of these individuals, upon whose judgment, interest, and special effort the successful conduct of our company’s operation is largely dependent. On September 27, 2018, we adopted the first amended and restated 2016 Incentive Award Plan, which reflects an increase in the number of ordinary shares and ADSs available for grant under the plan from 2.5 million to 3.9 million shares/ADSs, subject to specified adjustments under the plan. On September 24, 2020, we adopted the second amended and restated 2016 Incentive Award Plan which reflects an increase in the number of ordinary shares and ADSs available for grant under the plan from 3.9 million to 6.1 million shares/ADSs subject to specific adjustments under the plan. On July 15, 2021, we adopted the Third amended and restated plan which reflects deletion of reload provisions.
Shares Available for Awards: Subject to certain adjustments set forth in the 2016 Incentive Award Plan, the maximum number of shares and ADSs, in the aggregate, which may be issued or transferred pursuant to awards under the 2016 Incentive Award Plan is equal to the sum of (x) 6,100,000 shares, and (y) any shares or ADSs which immediately prior to the expiration of the 2006 Incentive Award Plan were available for issuance or transfer as new awards under the 2006 Incentive Award Plan, and (z) any shares or ADSs subject to awards under the 2006 Incentive Award Plan which terminate, expire, forfeit, lapse for any reason or are settled in cash on or after the effective date of the 2016 Incentive Award Plan. Immediately prior to the expiration of the 2006 Incentive Award Plan, 1,112,825 shares were available for issuance or transfer as new awards thereunder. To the extent that an award terminates, expires, or lapses for any reason, or is settled in cash, any shares or ADSs subject to the award shall again be available for the grant of an award pursuant to the 2016 Incentive Award Plan. Any shares or ADSs tendered or withheld to satisfy the grant or exercise price or tax withholding obligation pursuant to any award shall not subsequently be available for grant of an award pursuant to the 2016 Incentive Award Plan.
Administration. The 2016 Incentive Award Plan is administered by our Board of Directors, which may delegate its authority to a committee. We anticipate that our Compensation Committee will administer the 2016 Incentive Award Plan, except that our Board of Directors will administer the plan with respect to awards granted to our independent directors. The plan administrator will determine eligibility, the types and sizes of awards, the price and timing of awards and the acceleration or waiver of any vesting restriction, provided that the plan administrator will not have the authority to accelerate vesting or waive the forfeiture of any performance-based awards.
Eligibility. Our employees, consultants and directors and those of our subsidiaries are eligible to be granted awards, except that only employees of our company and our qualifying corporate subsidiaries are eligible to be granted options that are intended to qualify as “incentive share options” under Section 422 of the Code.
159
Awards
Options: The plan administrator may grant options on shares. The per share option exercise price of all options granted pursuant to the 2016 Incentive Award Plan will not be less than 100% of the fair market value of a share on the date of grant. No incentive share option may be granted to a grantee who owns more than 10% of our outstanding shares unless the exercise price is at least 110% of the fair market value of a share on the date of grant. To the extent that the aggregate fair market value of the shares subject to an incentive share option become exercisable for the first time by any option holder during any calendar year exceeds $100,000, such excess will be treated as a non-qualified option. The plan administrator will determine the methods of payment of the exercise price of an option, which may include cash, shares or other property acceptable to the plan administrator (and may involve a cashless exercise of the option). The award agreement may, in the sole discretion of the plan administrator, permit the option holder to elect, at the time of exercise, whether to receive shares in respect of the exercised share option or a portion thereof. The term of options granted under the 2016 Incentive Award Plan may not exceed ten years from the date of grant. However, the term of an incentive share option granted to a person who owns more than 10% of our outstanding shares on the date of grant may not exceed five years. Under the 2016 Incentive Award Plan, the number of awards to be granted to our independent directors will be determined by our Board of Directors or our Compensation Committee.
Restricted Shares. The plan administrator may grant shares subject to various restrictions, including restrictions on transferability, limitations on the right to vote and/or limitations on the right to receive dividends.
Share Appreciation Rights. The plan administrator may grant share appreciation rights representing the right to receive payment of an amount equal to the excess of the fair market value of a share on the date of exercise over the fair market value of a share on the date of grant. The term of share appreciation rights granted may not exceed ten years from the date of grant. The plan administrator may elect to pay share appreciation rights in cash, in shares or in a combination of cash and shares.
Performance Shares and Performance Share Units. The plan administrator may grant awards of performance shares denominated in a number of shares and/or awards of performance share units denominated in unit equivalents of shares and/or units of value, including dollar value of shares. These awards may be linked to performance criteria measured over performance periods as determined by the plan administrator.
Share Payments. The plan administrator may grant share payments, including payments in the form of shares or options or other rights to purchase shares. Share payments may be based upon specific performance criteria determined by the plan administrator on the date such share payments are made or on any date thereafter.
Deferred Shares. The plan administrator may grant awards of deferred shares linked to performance criteria determined by the plan administrator. Shares underlying deferred share awards will not be issued until the deferred share awards have vested, pursuant to a vesting schedule or upon the satisfaction of any vesting conditions or performance criteria set by the plan administrator. Recipients of deferred share awards generally will have no rights as shareholders with respect to such deferred shares until the shares underlying the deferred share awards have been issued.
Restricted Share Units. The plan administrator may grant RSUs, subject to various vesting conditions. On the maturity date, we will transfer to the grantee one unrestricted, fully transferable share for each vested RSU scheduled to be paid out on such date. The plan administrator will specify the purchase price, if any, to be paid by the grantee for such shares. Generally, a grantee will have to be employed by us on the date of payment of vested RSUs to be eligible to receive the payment of shares issuable upon vesting of the RSUs.
Performance Bonus Awards. The plan administrator may grant a cash bonus payable upon the attainment of performance goals based on performance criteria and measured over a performance period determined appropriate by the plan administrator. Any such cash bonus paid to a “covered employee” within the meaning of Section 162(m) of the Code may be a performance-based award as described below.
Performance-Based Awards. The plan administrator may grant awards other than options and share appreciation rights to employees who are or may be “covered employees,” as defined in Section 162(m) of the Code, that are intended to be performance-based awards within the meaning of Section 162(m) of the Code in order to preserve the deductibility of these awards for federal income tax purposes. Grantees are only entitled to receive payment for performance-based awards for any given performance period to the extent that pre-established performance goals set by the plan administrator for the period are satisfied. The plan administrator will determine the type of performance-based awards to be granted, the performance period and the performance goals. Generally, a grantee will have to be employed by us on the date the performance-based award is paid to be eligible for a performance-based award for any period.
160
Adjustments. In the event of certain changes in our capitalization, the plan administrator has broad discretion to adjust awards, including without limitation, (i) the aggregate number and type of shares that may be issued under the 2006 Incentive Award Plan, (ii) the terms and conditions of any outstanding awards, and (iii) the grant or exercise price per share for any outstanding awards under such plan to account for such changes. The plan administrator also has the authority to cash out, terminate or provide for the assumption or substitution of outstanding awards in the event of a corporate transaction.
Change in Control. In the event of a change in control of our company in which outstanding awards are not assumed by the successor, such awards will generally become fully exercisable and all forfeiture restrictions on such awards will lapse. Upon, or in anticipation of, a change in control, the plan administrator may cause any awards outstanding to terminate at a specific time in the future and give each grantee the right to exercise such awards during such period of time as the plan administrator, in its sole discretion, determines.
Vesting of Full Value Awards. Full value awards (generally, any award other than an option or share appreciation right) will vest over a period of at least three years (or, in the case of vesting based upon attainment of certain performance goals, over a period of at least one year). However, full value awards that result in the issuance of an aggregate of up to 5% to the total issuable shares under the 2016 Incentive Award Plan may be granted without any minimum vesting periods. In addition, full value awards may vest on an accelerated basis in the event of a grantee’s death, disability, or retirement, or in the event of our change in control or other special circumstances.
Non-transferability. Awards granted under the 2016 Incentive Award Plan are generally not transferable.
Withholding. We have the right to withhold, deduct or require a grantee to remit to us an amount sufficient to satisfy federal, state, local or foreign taxes (including the grantee’s employment tax obligations) required by law to be withheld with respect to any tax concerning the grantee as a result of the 2016 Incentive Award Plan.
Termination or Amendment. An award of performance shares, performance share units, deferred shares, share payments and RSUs shall only vest or be exercisable or payable while the grantee is an employee, consultant or a member of the Board, as applicable; provided, however , that the Committee in its sole and absolute discretion may provide that an award of performance shares, performance share units, share payments, deferred shares or RSUs may vest or be exercised or paid subsequent to a termination of employment or service, as applicable, or following a change in control of the Company, or because of the grantee’s retirement, death or disability, or otherwise; provided, however , that, to the extent required to preserve tax deductibility under Section 162(m) of the Code, any such provision with respect to performance shares or performance share units that are intended to constitute qualified performance-based compensation shall be subject to the requirements of Section 162(m) of the Code that apply to qualified performance-based compensation.
Outstanding Awards. As at March 31, 2024, RSUs to purchase an aggregate of 3,742,019 ordinary shares were outstanding, out of which RSUs to purchase 1,528,345 ordinary shares were held by all our directors and executive officers as a group. The weighted average grant date fair value of RSUs granted during fiscal 2024, 2023 and 2022 was $80.50, $83.70 and $74.14 per ADS/share, respectively. There is no purchase price for the RSUs.
Other Employee Benefits
We also maintain other employee benefit plans in the form of certain statutory and incentive plans covering substantially all of our employees. In fiscal 2024, the total amount accrued by us to provide for pension, retirement or similar benefits was $20.6 million.
Provident Fund
In accordance with Indian, Philippines and Sri Lankan laws, all of our employees in these countries are entitled to receive benefits under the respective government provident fund, a defined contribution plan to which both we and the employee contribute monthly at a pre-determined rate (for India and Sri Lanka, currently 12% of the employee’s base salary and for the Philippines, 100 Philippine peso per month for every employee). These contributions are made to the respective government provident fund and we have no further obligation under this fund apart from our monthly contributions. We contributed an aggregate of $13.6 million, $12.7 million and $11.6 million in each of fiscal 2024, 2023 and 2022, respectively, to the government provident fund.
US Savings Plan
Eligible employees in the US participate in a savings plan (the “US Savings Plan”), pursuant to Section 401(k) of the Code. The US Savings Plan allows our employees to defer a portion of their annual earnings on a pre-tax basis through voluntary contributions there under. The US Savings Plan provides that we can make optional contributions up to the maximum allowable limit under the Code. We contributed an aggregate of $2.7 million, $2.3 million and $2.1 million in each of fiscal 2024, 2023 and 2022, respectively, to the US Savings Plan.
161
UK Pension Scheme
Eligible employees in the UK contribute to a defined contribution pension scheme operated in the UK. The assets of the scheme are held separately from ours in an independently administered fund. The pension expense represents contributions payable to the fund by us. We contributed an aggregate of $1.8 million, $1.2 million and $0.8 million in each of fiscal 2024, 2023 and 2022, respectively, to the UK pension scheme.
Gratuity
In accordance with Indian, the Philippines, Sri Lankan and Dubai laws, we provide for gratuity liability pursuant to a defined benefit retirement plan covering all our employees in India, the Philippines, Sri Lanka and Dubai. Our gratuity plan provides for a lump sum payment to eligible employees on retirement, death, incapacitation or on termination of employment (provided such employee has worked for at least five years with our company) which is computed on the basis of employee’s salary and length of service with us (subject to a maximum of approximately $23,980 per employee in India). In India, we provide the gratuity benefit through determined contributions pursuant to a non-participating annuity contract administered and managed by the Life Insurance Corporation of India (“LIC”) and Aviva Life Insurance Company Private Limited (“ALICPL”). Under this plan, the obligation to pay gratuity remains with us although LIC and ALICPL administer the plan. We contributed an aggregate of $2.7 million, $2.6 million and $2.4 million in fiscal 2024, 2023 and 2022, respectively, to LIC and ALICPL.
Our Sri Lankan subsidiary, Philippines subsidiary, Dubai branch and two Indian subsidiaries have unfunded gratuity obligations.
Compensated Absence
Our liability for compensated absences, is determined on the basis of an actuarial valuation using the projected unit credit method and is charged to income in the year in which they accrue.
C. Board Practices
Composition of the Board of Directors
Our Memorandum and Articles of Association provide that our Board of Directors consists of not less than three directors and such maximum number as our directors may determine from time to time. Our Board of Directors currently consists of nine directors. Each of Messrs. Main, , Vitale, Haviland , Liberty, Ms. Gri , Ms. Tu, Ms. de Saint Victor and Ms. Marlinski satisfies the “independence” requirements of the NYSE rules.
All directors hold office until the expiry of their term of office, their resignation or removal from office for gross negligence or criminal conduct by a resolution of our shareholders or until they cease to be directors by virtue of any provision of law or they are disqualified by law from being directors or they become bankrupt or make any arrangement or composition with their creditors generally or they become of unsound mind. The term of office of the directors is divided into three classes:
• | Class I, whose term will expire at the annual general meeting to be held in fiscal 2026; |
• | Class II, whose term will expire at the annual general meeting to be held in fiscal 2027; and |
• | Class III, whose term will expire at the annual general meeting to be held in fiscal 2025. |
Our directors are classified as follows:
• | Class I: Mr. Mario P. Vitale , Mr. Timothy Main and Ms. Lan Tu; |
• | Class II: Mr. Keshav R. Murugesh, Mr. Keith Haviland and Ms. Diane de Saint Victor; and |
• | Class III: Ms. Françoise Gri, Mr. Jason Liberty and Ms. Judy Marlinski. |
The appointments of Ms. Judy Marlinski and Mr. Jason Liberty will expire at the next annual general meeting, which we expect to hold in June 2024. Ms. Marlinski and Mr. Liberty have expressed their willingness to be re-elected and, accordingly, we propose to seek shareholders’ approval for their re-election at the next annual general meeting. In addition, Ms. Gri completed her nine-year term as director on May 5, 2024. At its meeting on April 24, 2024, our Board of Directors proposed to extend Ms. Gri’s term as Class III director for an additional period of one year until May 5, 2025, subject to re-election at the next annual general meeting.
162
At each annual general meeting after the initial classification or special meeting in lieu thereof, the successors to directors whose terms will then expire serve from the time of election until the third annual meeting following election or special meeting held in lieu thereof. Any additional directorships resulting from an increase in the number of directors will be distributed among the three classes so that, as nearly as possible, each class will consist of one-third of the directors. This classification of the Board of Directors may have the effect of delaying or preventing changes in control of management of our company.
There are no family relationships among any of our directors or executive officers. The employment agreement governing the services of one of our directors provides for benefits upon termination of employment as described above.
Our Board of Directors held five meetings in fiscal 2024.
Board Leadership Structure and Board Oversight of Risk
Different individuals currently serve in the roles of Chairman of the Board and Group Chief Executive Officer of our company. Our Board believes that splitting the roles of Chairman of the Board and Group Chief Executive Officer is currently the most appropriate leadership structure for our company. This leadership structure will bring in greater efficiency as a result of vesting two important leadership roles in separate individuals and increased independence for the Board of Directors.
Board’s Role in Risk Oversight
Our Board of Directors is primarily responsible for overseeing our risk management processes. The Board of Directors receives and reviews periodic reports from the Head of Risk Management and Audit as considered appropriate regarding our company’s assessment of risks. The Board of Directors focuses on the most significant risks facing our company and our company’s general risk management strategy, and also ensures that risks undertaken by our company are consistent with the Board’s appetite for risk. While the Board oversees our company’s risk management, management is responsible for day-to-day risk management processes. We believe this division of responsibilities is the most effective approach for addressing the risks facing our company and that our Board leadership structure supports this approach.
The Audit Committee has special responsibilities with respect to financial risks, and regularly reports to the full Board of Directors on these issues. Among other responsibilities, the Audit Committee reviews our company’s policies with respect to contingent liabilities and risks that may be material to our company, our company’s policies and procedures designed to promote compliance with laws, regulations, and internal policies and procedures, and major legislative and regulatory developments which could materially impact our company.
The Compensation Committee also plays a role in risk oversight as it relates to our company’s compensation policies and practices. Among other responsibilities, the Compensation Committee designs and evaluates our company’s executive compensation policies and practices so that our company’s compensation programs promote accountability among employees and the interests of employees are properly aligned with the interests of our shareholders.
Committees of the Board
Our Board of Directors has three standing committees: an Audit Committee, a Compensation Committee and a NCG & ESG Committee.
163
Audit Committee
The Audit Committee comprises four directors: Mr. Jason Liberty (Chairman), Mr. Keith Haviland, Mr. Mario P. Vitale and Ms.Judy Marlinski. Each of Messrs. Haviland, Liberty and Vitale and Ms. Marlinski satisfies the “independence” requirements of Rule 10A-3 of the Exchange Act, and the NYSE listing standards. The principal duties and responsibilities of our Audit Committee are as follows:
• | to serve as an independent and objective party to monitor our financial reporting process and internal control systems; |
• | to review and appraise the audit efforts of our independent accountants and exercise ultimate authority over the relationship between us and our independent accountants; and |
• | to provide an open avenue of communication among the independent accountants, financial and senior management and the Board of Directors. |
The Audit Committee has the power to investigate any matter brought to its attention within the scope of its duties. It also has the authority to retain counsel and advisors to fulfill its responsibilities and duties. Mr. Liberty serves as our Audit Committee financial expert, within the requirements of the rules promulgated by the Commission relating to listed-company audit committees.
We have posted our Audit Committee charter on our website at www.wns.com. Information contained in our website does not constitute a part of this annual report.
The Audit Committee held four meetings and two Audit Committee calls in fiscal 2024.
Compensation Committee
The Compensation Committee comprises four directors: Ms. Lan Tu (Chairperson), Messrs. Timothy L Main, Ms Francoise Gri, and Ms. Diane de Saint Victor. Each of Messrs. Main and Ms.Gri, Ms.Tu and Ms.de Saint Victor satisfies the “independence” requirements of the NYSE listing standards. The scope of this committee’s duties includes determining the compensation of our executive officers and other key management personnel. The Compensation Committee also administers the 2006 Incentive Award Plan and the 2016 Incentive Award Plan, reviews performance appraisal criteria and sets standards for and decides on all employee shares options allocations when delegated to do so by our Board of Directors.
We have posted our Compensation Committee charter on our website at www.wns.com. Information contained in our website does not constitute a part of this annual report.
The Compensation Committee held four meetings in fiscal 2024.
NCG & ESG Committee
The NCG & ESG Committee comprises four directors: Ms. Françoise Gri (Chairperson), Ms. Lan Tu, Ms. Diane de Saint Victor and Messrs. Timothy L Main. Each of Ms. Gri, Ms. Tu, Ms. de Saint Victor and Messrs. Main satisfies the “independence” requirements of the NYSE listing standards. The principal duties and responsibilities of the NCG & ESG committee are as follows:
• | to assist the Board of Directors by identifying individuals qualified to become board members and members of board committees, to recommend to the Board of Directors nominees for the next annual meeting of shareholders, and to recommend to the Board of Directors nominees for each committee of the Board of Directors; |
• | to monitor our corporate governance structure; and |
• | to periodically review and recommend to the Board of Directors any proposed changes to the corporate governance guidelines applicable to us. |
164
We have posted our NCG & ESG Committee charter on our website at www.wns.com. Information contained in our website does not constitute a part of this annual report.
The NCG & ESG Committee uses its judgment to identify well qualified individuals who are willing and able to serve on our Board of Directors. Pursuant to its charter, the NCG & ESG Committee may consider a variety of criteria in recommending candidates for election to our board, including an individual’s personal and professional integrity, ethics and values; experience in corporate management, such as serving as an officer or former officer of a publicly held company, and a general understanding of marketing, finance and other elements relevant to the success of a publicly-traded company in today’s business environment; experience in our company’s industry and with relevant social policy concerns; experience as a board member of another publicly held company; academic expertise in an area of our company’s operations; and practical and mature business judgment, including ability to make independent analytical inquiries.
The NCG & ESG Committee considers director nominees with a diverse range of backgrounds, skills, national origins, values, experiences and occupations.
The NCG & ESG Committee held four meetings in fiscal 2024.
Executive Sessions
Our non-executive directors meet regularly in executive session without executive directors or management present. The purpose of these executive sessions is to promote open and candid discussion among the non-executive directors. Our non-executive directors held four executive sessions in fiscal 2024.
Shareholders and other interested parties may communicate directly with the presiding director or with our non-executive directors as a group by writing to the following address: WNS (Holdings) Limited, Attention: Non-Executive Directors, Gate 4, Godrej & Boyce Complex, Pirojshanagar, Vikhroli (W), Mumbai 400 079, India.
D. Employees
For a description of our employees, see “Part I — Item 4. Information on the Company — Business Overview — Human Capital.”
165
E. Share Ownership
The following table sets forth information with respect to the beneficial ownership of our ordinary shares by each of our directors and by all our directors and executive officers as a group as at March 31, 2024. As used in this table, beneficial ownership means the sole or shared power to vote or direct the voting or to dispose of or direct the sale of any security. A person is deemed to be the beneficial owner of securities that can be acquired within 60 days upon the exercise of any option, warrant or right. Ordinary shares subject to options, warrants or rights that are currently exercisable or exercisable within 60 days are deemed outstanding for computing the ownership percentage of the person holding the options, warrants or rights, but are not deemed outstanding for computing the ownership percentage of any other person. The amounts and percentages as at March 31, 2024 are based on an aggregate of 45,684,145 ordinary shares outstanding as at that date.
Number of Ordinary Shares Beneficially Owned |
||||||||
Name |
Number | Percent | ||||||
Directors |
||||||||
Timothy L. Main (1) |
22,780 | 0.05 | ||||||
Françoise Gri |
23,555 | 0.05 | ||||||
Keith Haviland |
17,350 | 0.04 | ||||||
Jason Liberty |
9,384 | 0.02 | ||||||
Mario Vitale |
13,890 | 0.03 | ||||||
Lan Tu (2) |
5,235 | 0.01 | ||||||
Diane de Saint Victor (3) |
5,710 | 0.01 | ||||||
Judy Marlinski |
— | — | ||||||
Keshav R. Murugesh |
661,257 | 1.45 | ||||||
Executive Officers |
||||||||
Sanjay Puria |
34,044 | 0.07 | ||||||
Swaminathan Rajamani |
34,616 | 0.08 | ||||||
All our directors and executive officers as a group (11 persons as at March 31, 2024) |
827,821 | 1.81 |
Notes:
(1) | Of the 22,780 ordinary shares held by Timothy L Main, 15,000 ordinary shares were purchased by him from open market . |
(2) | Of the 5,235 ordinary shares held by Lan Tu, 1,500 ordinary shares were purchased by her from open market. |
(3) | Of the 5,710 ordinary shares held by Diane de Saint Victor, 4,000 ordinary shares were purchased by her from the open market. |
166
As at March 31, 2024, there were no options held by our directors and executive officers. The following table sets forth information concerning RSUs held by our directors and executive officers as at March 31, 2024:
RSU Summary | ||||||||||||||||
Name |
Number of shares underlying unexercised RSUs held that have vested but unexercised |
Number of shares underlying unexercised RSUs to be vested within 60 days after Mar 31, 2024 |
Vesting dates | Number of shares underlying unexercised RSUs held that have not vested |
||||||||||||
Non-executive Directors |
||||||||||||||||
John Freeland |
— | — | — | — | ||||||||||||
Francoise Gri |
— | — | — | 2,760 | ||||||||||||
Keith Haviland |
— | — | — | 2,760 | ||||||||||||
Mario Vitale |
— | — | — | 2,760 | ||||||||||||
Jason Liberty |
— | — | — | 2,760 | ||||||||||||
Timothy L. Main |
— | — | — | 4,420 | ||||||||||||
Thi Nhuoc Lan Tu |
— | — | — | 2,760 | ||||||||||||
Diane de Saint Victor |
— | 1,710 | 25-Apr-24 | 2,760 | ||||||||||||
Judy Marlinski |
— | — | — | 3,035 | ||||||||||||
Executive Officers |
||||||||||||||||
Keshav R. Murugesh |
522,494 | 129,838 | 21-Apr-24 | 538,675 | ||||||||||||
4,406 | 21-Apr-24 | |||||||||||||||
4,519 | 21-Apr-24 | |||||||||||||||
Sanjay Puria |
25,588 | 7,339 | 22-Apr-24 | 72,050 | ||||||||||||
534 | 21-Apr-24 | |||||||||||||||
583 | 21-Apr-24 | |||||||||||||||
Gautam Barai |
75,500 | — | — | — | ||||||||||||
Swaminathan Rajamani |
27,502 | 6,135 | 21-Apr-24 | 65,514 | ||||||||||||
466 | 21-Apr-24 | |||||||||||||||
513 | 25-Apr-24 |
Share Ownership Guidelines
In July 2014, our Board of Directors adopted a share ownership policy, which was amended in January 2015 and effective from April 1, 2015, outlining the share ownership guidelines for, among other employees, our directors and executive officers. Our share ownership policy was further amended for other employees and executive officers effective July 2019. We believe that this policy further aligns the interests of our directors and executive officers with the long-term interests of our shareholders and promotes our commitment to sound corporate governance practices.
167
Under our amended policy, each of our non-executive directors must hold at least the amount of vested shares of our company by the fifth anniversary of such director’s initial election to the Board as shown in the table below:
Position |
Share Ownership Guidelines | |
For Non-Executive Directors (except Chairman of the Board) |
3.0 x value of annual share grant in $ | |
For the Chairman of the Board |
4.0 x value of annual share grant in $ |
In the event a non-executive director holds at least the required valued of our ordinary shares during the required time period, but the value of the director’s shares decreases below the shareholding requirement due to a decline in the price of our ordinary shares, the director shall be deemed to have complied with this policy so long as the director does not sell any shares.
Our amended policy provides that our executive officers are required to hold a multiple of their annual base salary in shares of our company as shown in the table below.
Position |
Share Ownership Guidelines | |
Group Chief Executive Officer |
4.0 x annual base salary | |
Group Chief Financial Officer |
2.0 x annual base salary | |
Chief People Officer |
2.0 x annual base salary |
Executive officers have five years to achieve the specified ownership level according to the following build-up schedule: achieving a share ownership level equivalent to 5%, 15%, 30%, 60% and 100% of their specified ownership level in the first, second, third, fourth and fifth year, respectively.
For our Group Chief Financial Officer, our Compensation Committee changed the share ownership level from 1.5 times to 2 times his annual base salary. The additional ownership level of 0.5 times his annual base salary was to be attained over the period of five years in the same ratio as outlined above.
For our Chief People Officer, our Compensation Committee changed the share ownership level from 1 time to 2 times his annual base salary. The additional ownership level of 1 time his annual base salary was to be attained over the period of five years in the same ratio as outlined above.
Shares owned by immediate family members and any trust for the benefit only of the executive officer/director or his or her family members are included in the determination of such executive officer/director’s share ownership level.
F. Disclosure of a registrant’s action to recover erroneously awarded compensation
Not applicable.
168
ITEM 7. MAJOR SHAREHOLDERS AND RELATED PARTY TRANSACTIONS
A. Major Shareholders
The following table sets forth information regarding beneficial ownership of our ordinary shares as at March 31, 2024 held by each person who is known to us to have a 5.0% or more beneficial share ownership based on an aggregate of 45,684,145 ordinary shares outstanding as at that date. Beneficial ownership is determined in accordance with the rules of the Commission and includes shares over which the indicated beneficial owner exercises voting and/or investment power or receives the economic benefit of ownership of such securities. Ordinary shares subject to options currently exercisable or exercisable within 60 days are deemed outstanding for the purposes of computing the percentage ownership of the person holding the options but are not deemed outstanding for the purposes of computing the percentage ownership of any other person.
Name of Beneficial Owner |
Number of Shares Beneficially Owned |
Percentage Beneficially Owned (1) |
||||||
Nalanda India Fund Limited (2) |
3,790,196 | 8.30 | % | |||||
FMR LLC (3) |
3,147,805 | 6.89 | % | |||||
Macquarie Group Limited (4) |
2,495,612 | 5.46 | % |
Notes:
(1) | Based on an aggregate of 45,684,145 ordinary shares outstanding as at March 31, 2024. |
(2) | Information is based on a Form 13F for the quarter ended December 31, 2024 filed with the Commission on February 14, 2024 by Nalanda India Fund Limited. |
(3) | Information is based on Amendment No. 21 to a report on Schedule 13G jointly filed with the Commission on February 8, 2024 by FMR LLC and Abigail P. Johnson, reporting beneficial ownership of 3,147,805 shares as at December 29, 2023. Abigail P. Johnson is a Director, the Chairman and the Chief Executive Officer of FMR LLC. According to this Amendment No. 21, members of the Johnson family, including Abigail P. Johnson, are the predominant owners, directly or through trusts, of Series B voting common shares of FMR LLC, representing 49% of the voting power of FMR LLC. The Johnson family group and all other Series B shareholders have entered into a shareholders’ voting agreement under which all Series B voting common shares will be voted in accordance with the majority vote of Series B voting common shares. Accordingly, through their ownership of voting common shares and the execution of the shareholders’ voting agreement, members of the Johnson family may be deemed, under the US Investment Company Act of 1940, to form a controlling group with respect to FMR LLC. |
(4) | Information is based on a report on Schedule 13G filed with the Commission on February 14, 2024 by Macquarie Group Limited, reporting beneficial ownership of 2,495,612 ordinary shares as at December 31, 2023. |
169
The following summarizes the significant changes in the percentage ownership held by our major shareholders during the past three years:
• | Waddell & Reed Financial, Inc. (“WDR”) reported its beneficial ownership of our ordinary shares to be 11.6% (based on the then number of our ordinary shares reported as outstanding) in Amendment No. 9 to a report on Schedule 13G filed with the Commission on February 14, 2020 and 10.6% based on the then number of our ordinary shares reported as outstanding at that time) in Amendment No. 10 to a report on Schedule 13G filed with the Commission on February 12, 2021. On April 30, 2021, WDR filed a current report on Form 8-K with the Commission announcing the completion of its acquisition by Macquarie Management Holdings, Inc. and became a wholly owned subsidiary of Macquarie Management Holdings, Inc. |
• | Macquarie Group Limited reported its beneficial ownership of our ordinary shares to be 5.32% (based on the then number of our ordinary shares reported as outstanding) in a report on Schedule 13G filed with the Commission on February 14, 2022 and 0.12% (based on the then number of our ordinary share reported as outstanding) in an amendment to a report on Schedule 13G filed with the Commission on July 11, 2022. Macquarie Management Holdings, Inc., which was described in this report on Schedule 13G as being owned by Macquarie Group Limited and a joint filer of the report, reported that it had no beneficial ownership of our ordinary shares. On February 21, 2023, Macquarie Group Limited filed a Form 13F with the Commission and reported that it had beneficial ownership of 2,467,875 of our ordinary shares as at December 31, 2022, which represented 5.1% of our then ordinary shares. On February 14, 2024, Macquarie Group Limited filed a report on Schedule 13G with the Commission and reported that it had beneficial ownership of 2,495,612 as at December 31, 2023, which represented approximately 5.33% of our then number of outstanding ordinary shares. |
• | Nalanda India Fund Limited reported that it had beneficial ownership of 4,122,196 of our ordinary shares as at December 31, 2018, which represented 8.30% of our then number of outstanding ordinary shares, in Amendment No. 5 to a report on Schedule 13G filed with the Commission on February 14, 2019. On February 14, 2024, Nalanda India Fund Limited filed a Form 13F with the Commission and reported that it had beneficial ownership of 3,790,196 of our ordinary shares as at December 31, 2023, which represented 8.10% of our then number of outstanding ordinary shares. |
• | FMR LLC reported that it had beneficial ownership of (i) 4,872,972 of our ordinary shares as at December 31, 2021, which represented 10.00% of our then number of outstanding ordinary shares in Amendment No. 19 to a report on Schedule 13G filed with the Commission on February 8, 2022; (ii) 4,895,598 of our ordinary shares as at December 30, 2022, which represented 9.97% of our then number of outstanding ordinary shares in Amendment No. 20 to a report on Schedule 13G filed with the Commission on February 9, 2023; and (iii) 3,147,805 of our ordinary shares as at December 29, 2023, which represented 6.63% of our then number of outstanding ordinary shares in Amendment No. 21 to a report on Schedule 13G filed with the Commission on February 8, 2024. |
• | JP Morgan Chase & Co. reported that it had beneficial ownership of (i) 2,405,034 of our ordinary shares as at December 29, 2023, which represented 5.14% of our then number of outstanding ordinary shares, in a report on Schedule 13G filed with the Commission on January 12, 2024; and (ii) 6,592 of our ordinary shares as at March 29, 2024, which represented 0.01% of our then outstanding ordinary shares, in Amendment No. 1 to a report on Schedule 13G filed with the Commission on April 9, 2024. |
• | Grandeur reported its beneficial ownership of our ordinary shares to be 5.15% (based on the then number of our ordinary shares reported as outstanding) in a report on Schedule 13G filed with the Commission on February 17, 2021, 5.88% (based on the then number of ordinary shares reported as outstanding) in a report on Schedule 13G filed with the Commission on February 14, 2022, and 2.58% (based on the then number of ordinary shares reported as outstanding) in a report on Schedule 13G filed with the Commission on February 13, 2023. |
None of our major shareholders have different voting rights from our other shareholders.
Deutsche Bank Trust Company Americas was the holder of record for our ADR program, pursuant to which each ADS represented one ordinary share. Effective 5:00 p.m. Eastern Time on March 27, 2024, our ADR program was terminated. Following such termination, our ADSs were exchanged for ordinary shares. Immediately following the termination of our ADR program, 45,483,669 of our ordinary shares were held by the Depository Trust Company (the “DTC”) were registered in the name of Cede & Co.
As at March 27, 2024, the DTC held 45,483,669 ordinary shares, representing 99.56 % of our outstanding ordinary shares. To our knowledge, as at the same date, 5 record shareholders (not including the DTC) had a registered address in the US. Since certain of these ordinary shares were held by brokers or other nominees, the number of record holders in the US may not be representative of the number of beneficial holders in the US. All holders of our ordinary shares are entitled to the same voting rights.
170
B. Related Party Transactions
(Amounts in thousands)
The following is a description of our related party transactions, determined in accordance with the rules and regulations promulgated under the Exchange Act that were either material to us or the related party.
Mr. Keshav Murugesh is a member of the Executive Council at NASSCOM. During fiscal 2024, we paid membership and subscription charges and sponsorship fees for various events conducted by NASSCOM amounting to $60.
See also “Part I — Item 6. Directors, Senior Management and Employees — B. Compensation — Employment Agreement of our Executive Director” for a description of our employment agreement with Mr. Keshav R. Murugesh, our Group Chief Executive Officer and director.
C. Interests of Experts and Counsel
Not applicable.
171
ITEM 8. FINANCIAL INFORMATION
A. Consolidated Statements and Other Financial Information
Please see “Part III — Item 18. Financial Statements” for a list of the financial statements filed as part of this annual report.
Tax Assessment Orders
Transfer pricing regulations to which we are subject require that any international transaction among the WNS group enterprises be on arm’s-length terms. We believe that the international transactions among the WNS group enterprises are on arm’s-length terms. If, however, the applicable tax authorities determine that the transactions among the WNS group enterprises do not meet arm’s-length criteria, we may incur increased tax liability, including accrued interest and penalties. This would cause our tax expense to increase, possibly materially, thereby reducing our profitability and cash flows. We have signed an advance pricing agreement with the Government of India providing for the agreement on transfer pricing matters over certain transactions covered thereunder for a period of five years starting from April 2018. We have filed an application with the Government of India for the renewal of the advance pricing agreement on similar terms for another five years starting from April 2023. The applicable tax authorities may also disallow deductions or tax holiday benefits claimed by us and assess additional taxable income on us in connection with their review of our tax returns.
From time to time, we receive orders of assessment from the Indian tax authorities assessing additional taxable income on us and/or our subsidiaries in connection with their review of our tax returns. We currently have orders of assessment for fiscal 2003 through fiscal 2020 pending before various appellate authorities. These orders assess additional taxable income that could in the aggregate give rise to an estimated ₹343.8 million ($4.1 million based on the exchange rate on March 31, 2024) in additional taxes, including interest of ₹49.1 million ($0.6 million based on the exchange rate on March 31, 2024).
172
The following sets forth the details of these orders of assessment:
Entity |
Tax year(s) | Amount demanded (including interest) |
Interest on amount Demanded |
|||||||||||||||||
(₹ and US dollars in millions) | ||||||||||||||||||||
Permanent establishment of WNS NA Inc in India |
Fiscal 2003 | ₹ | 0.1 | $ | (0.1 | )(1) | ₹ | — | $ | — | ||||||||||
Permanent establishment of WNS NA Inc and WNS UK in India |
Fiscal 2004 | ₹ | 8.1 | $ | (0.1 | )(1) | ₹ | — | $ | — | ||||||||||
Permanent establishment of WNS NA Inc and WNS UK in India |
Fiscal 2005 | ₹ | 4.1 | $ | (0.1 | )(1) | ₹ | — | $ | — | ||||||||||
WNS Global |
Fiscal 2006 | ₹ | 29.8 | $ | (0.4 | )(1) | ₹ | 7.7 | $ | (0.1 | )(1) | |||||||||
Permanent establishment of WNS NA Inc and WNS UK in India |
Fiscal 2006 | ₹ | 13.2 | $ | (0.2 | )(1) | ₹ | 5.6 | $ | (0.1 | )(1) | |||||||||
Permanent establishment of WNS NA Inc. and WNS UK in India |
Fiscal 2007 | ₹ | 23.1 | $ | (0.3 | )(1) | ₹ | 5.4 | $ | (0.1 | )(1) | |||||||||
WNS Global |
Fiscal 2009 | ₹ | 55.2 | $ | (0.6 | )(1) | ₹ | — | $ | — | ||||||||||
WNS BCS |
Fiscal 2010 | ₹ | 1.0 | $ | (0.1 | )(1) | ₹ | — | $ | — | ||||||||||
Permanent establishment of WNS NA Inc in India |
Fiscal 2011 | ₹ | 31.0 | $ | (0.4 | )(1) | ₹ | 9.9 | $ | (0.1 | )(1) | |||||||||
WNS Global |
Fiscal 2016 | ₹ | 45.2 | $ | (0.4 | )(1) | ₹ | 20.50 | $ | (0.2 | )(1) | |||||||||
WNS Global |
Fiscal 2020 | ₹ | 133.0 | $ | (1.4 | )(1) | ₹ | — | $ | — | ||||||||||
Total |
₹ | 343.8 | $ | (4.1 | )(1) | ₹ | 49.1 | $ | (0.6 | )(1) |
Note:
(1) | Based on the exchange rate as at March 31, 2024. |
The aforementioned orders of assessment allege that the transfer prices we applied to certain of the international transactions between WNS Global or WNS BCS (each of which is one of our Indian subsidiaries), as the case may be, and our other wholly-owned subsidiaries named above were not on arm’s-length terms, disallow a tax holiday benefit claimed by us, deny the set off of brought forward business losses and unabsorbed depreciation and disallow certain expenses claimed as tax deductible by WNS Global or WNS BCS, as the case may be. As at March 31, 2024, we have provided a tax reserve of ₹774.3 million ($9.3 million based on the exchange rate on March 31, 2024) primarily on account of the Indian tax authorities’ denying the set-off of brought forward business losses and unabsorbed depreciation. We have appealed against these orders of assessment before higher appellate authorities.
173
In addition, we currently have orders of assessment pertaining to similar issues that have been decided in our favor by appellate authorities, vacating tax demands of ₹6,907.0 million ($82.8 million based on the exchange rate on March 31, 2024) in additional taxes, including interest of ₹2,457.1 million ($29.5 million based on the exchange rate on March 31, 2024). The income tax authorities have filed or may file appeals against these orders at higher appellate authorities. In case of disputes, the Indian tax authorities may require us to deposit with them all or a portion of the disputed amounts pending resolution of the matters on appeal. Any amount paid by us as deposits will be refunded to us with interest if we succeed in our appeals. We have deposited ₹904.1 million ($10.8 million based on the exchange rate on March 31, 2024) of the disputed amount with the tax authorities and may be required to deposit the remaining portion of the disputed amount with the tax authorities pending final resolution of the respective matters.
As at March 31, 2024, corporate tax returns for fiscal year 2021 and thereafter remain subject to examination by tax authorities in India.
After consultation with our Indian tax advisors and based on the facts of these cases, legal opinions from counsel on certain matters, the nature of the tax authorities’ disallowances and the orders from appellate authorities deciding similar issues in our favor in respect of assessment orders for earlier fiscal years, we believe these orders are unlikely to be sustained at the higher appellate authorities and we intend to vigorously dispute the orders of assessment.
In addition, the Company currently has orders of assessment outstanding for various years pertaining to pre-acquisition period of Smart Cube India Private Limited acquired in fiscal 2023, which assess additional taxable income that could in the aggregate give rise to an estimated ₹63.2 million ($0.8 million based on the exchange rate on March 31, 2024) in additional taxes, including interest of ₹31.1 million ($0.4 million based on the exchange rate on March 31, 2024). These orders of assessment disallow tax holiday benefit claimed by Smart Cube India Private Limited. Smart Cube India Private Limited has appealed against these orders of assessment before higher appellate authorities.
We have received orders of assessment from the VAT, service tax and GST authorities, demanding payment of ₹244.1 million ($1.9 million based on the exchange rate on March 31, 2024) towards VAT, service tax and GST for the period April 1, 2014 to March 31, 2020. The tax authorities have rejected input tax credit on certain types of input services. Based on consultations with our tax advisors, we believe these orders of assessments will more likely than not be vacated by the higher appellate authorities and we intend to dispute the orders of assessments.
In 2016, we also received an assessment order from the Sri Lankan Tax Authority, demanding payment of LKR 25.2 million ($0.1 million based on the exchange rate on March 31, 2024) in connection with the review of our tax return for fiscal year 2012. The assessment order challenges the tax exemption that we have claimed for export business. We have filed an appeal against the assessment order with the Sri Lankan Tax Appeal Commission in this regard. Based on consultations with our tax advisors, we believe this order of assessment will more likely than not be vacated by the higher appellate authorities and we intend to dispute the order of assessment.
No assurance can be given, however, that we will prevail in our tax disputes. If we do not prevail, payment of additional taxes, interest and penalties may adversely affect our results of operations, financial condition and cash flows. There can also be no assurance that we will not receive similar or additional orders of assessment in the future.
174
Dividend Policy
Subject to the provisions of the 1991 Law and our Articles of Association, we may by ordinary resolution declare dividends to be paid to our shareholders according to their respective rights. Any dividends we may declare must not exceed the amount recommended by our Board of Directors. Our Board may pay an interim dividend or dividends, including a dividend payable at a fixed rate, if paying an interim dividend or dividends appears to the Board to be justified. See “Part I — Item 10. Additional Information — B. Memorandum and Articles of Association.” We can only declare dividends if our directors who are to authorize the distribution make a prior statement that, having made full enquiry into our affairs and prospects, they have formed the opinion that:
• | immediately following the date on which the distribution is proposed to be made, we will be able to discharge our liabilities as they fall due; and |
• | having regard to our prospects and to the intentions of our directors with respect to the management of our business and to the amount and character of the financial resources that will in their view be available to us, we will be able to continue to carry on business and we will be able to discharge our liabilities as they fall due until the expiry of the period of 12 months immediately following the date on which the distribution is proposed to be made or until we are dissolved under Article 150 of the 1991 Law, whichever first occurs. |
We have never declared or paid any dividends on our ordinary shares. Any future determination to pay cash dividends will be at the discretion of our Board of Directors and will be dependent upon our results of operations and cash flows, our financial position and capital requirements, general business conditions, legal, tax, regulatory and any contractual restrictions on the payment of dividends and any other factors our Board of Directors deems relevant at the time.
B. Significant Changes
None.
175
ITEM 9. THE OFFER AND LISTING
A. Offer and Listing Details
Our ADSs, commenced trading on the NYSE on July 26, 2006 under the symbol “WNS”. The ADSs were issued by our depositary, Deutsche Bank Trust Company Americas, pursuant to a deposit agreement. We terminated our ADS facility on March 27, 2024. Following the termination of our ADS facility, our ordinary shares began trading on the NYSE under the symbol “WNS” on March 28, 2024.
The number of our outstanding ordinary shares as at March 31, 2024 was 45,684,145.
B. Plan of Distribution
Not applicable.
C. Markets
Our ADSs were listed on the NYSE under the symbol “WNS” prior to March 28, 2024. We terminated our ADS facility on March 27, 2024. Following the termination of our ADS facility, our ordinary shares began trading on the NYSE under the symbol “WNS” on March 28, 2024.
D. Selling Shareholders
Not applicable.
E. Dilution
Not applicable.
F. Expenses of the Issue
Not applicable.
176
ITEM 10. ADDITIONAL INFORMATION
A. Share Capital
Not applicable.
B. Memorandum and Articles of Association
General
We were incorporated in Jersey, Channel Islands, as a private limited company (with registered number 82262) on February 18, 2002 pursuant to the Companies (Jersey) Law 1991 (the “1991 Law”). We converted from a private limited company to a public limited company on January 4, 2006 when we acquired more than 30 shareholders as calculated in accordance with Article 17A of the 1991 Law. We gave notice of this to the JFSC in accordance with Article 17(3) of the 1991 Law on January 12, 2006.
The address of our secretary, Mourant Secretaries (Jersey) Limited, is 22 Grenville Street, St Helier, Jersey JE4 8PX.
The Company has appointed Computershare Trust Company, N.A., 150 Royall Street, Canton, Massachusetts 02021, United States of America as transfer agent. Computershare’s Jersey office provides registrar services to the Company in Jersey, Chanel Islands. Our share register is maintained at the premises of Computershare Investor Services (Jersey) Limited at 13 Castle Street, St. Helier, JE1 1ES, Jersey and our overseas branch register is kept at the premises of Computershare Trust Company, N.A., at 150 Royall Street, Canton, Massachusetts 02021, United States of America.
Our activities are regulated by our Memorandum and Articles of Association. We adopted an amended and restated Memorandum and Articles of Association by special resolution of our shareholders passed on May 22, 2006. This amended and restated Memorandum and Articles of Association came into effect immediately prior to the completion of our initial public offering in July 2006. The material provisions of our amended and restated Memorandum and Articles of Association are described below. In addition to our Memorandum and Articles of Association, our activities are regulated by (among other relevant legislation) the 1991 Law. Our Memorandum of Association states our company name, that we are a public company, that we are a par value company, our authorized share capital and that the liability of our shareholders is limited to the amount (if any) unpaid on their shares. Below is a summary of some of the provisions of our Articles of Association. It is not, nor does it purport to be, complete or to identify all of the rights and obligations of our shareholders. The summary is qualified in its entirety by reference to our Memorandum and Articles of Association. See “Part III — Item 19. Exhibits — Exhibit 1.1” and “Part III — Item 19. Exhibits — Exhibit 1.2.”
The rights of shareholders described in this section are available only to persons who hold our certificated shares. Any person who does not hold our certificated shares are not directly entitled to the rights conferred on our shareholders by our Articles of Association or the rights conferred on shareholders of a Jersey company by the 1991 Law, including, without limitation: the right to receive dividends and the right to attend and vote at shareholders meetings; the rights described in “— Other Jersey Law Considerations — Mandatory Purchases and Acquisitions” and “— Other Jersey Law Considerations — Compromises and Arrangements,” the right to apply to a Jersey court for an order on the grounds that the affairs of a company are being conducted in a manner which is unfairly prejudicial to the interests of its shareholders; and the right to apply to the JFSC to have an inspector appointed to investigate the affairs of a company.
177
Share Capital
As at March 31, 2024, the authorized share capital is £6,100,000, divided into 60,000,000 ordinary shares of 10 pence each and 1,000,000 preferred shares of 10 pence each. As at March 31, 2024, 2023 and 2022, we had 45,684,145, 48,360,817 and 48,849,907 shares, respectively. The decrease in the number of ordinary shares outstanding during the last three fiscal years resulted from share repurchases pursuant to our share repurchase programs, partially offset by the issuance of ordinary shares pursuant to our three share-based incentive plans: our 2002 Stock Incentive Plan, our 2006 Incentive Award Plan (as amended and restated) and our 2016 Incentive Award Plan (as amended and restated). Other than pursuant to our incentive award plans, we have not issued any shares for consideration other than cash. There are no preferred shares outstanding.
Pursuant to the 1991 Lawand our Memorandum and Articles of Association, our Board of Directors by resolution may establish one or more classes of preferred shares having such number of shares, designations, dividend rates, relative voting rights, liquidation rights and other relative participation, optional or other special rights, qualifications, limitations or restrictions as may be fixed by the board without any further shareholder approval. Such rights, preferences, powers and limitations as may be established could also have the effect of discouraging an attempt to obtain control of us. None of our shares have any redemption rights.
Capacity
Under the 1991 Law, the doctrine of ultra vires in its application to companies is abolished and accordingly the capacity of a Jersey company is not limited by anything in its memorandum or articles or by any act of its members.
Changes in Capital or our Memorandum and Articles of Association
Subject to the 1991 Law and our Articles of Association, we may by special resolution at a general meeting:
• | increase our authorized or paid-up share capital; |
• | consolidate and divide all or any part of our shares into shares of a larger amount than is fixed by our Memorandum of Association; |
• | sub-divide all or any part of our shares into shares of smaller amount than is fixed by our Memorandum of Association; |
• | convert any of our issued or unissued shares into shares of another class; |
• | convert all our issued par value shares into no par value shares and vice versa; |
• | convert any of our paid-up shares into stock, and reconvert any stock into any number of paid-up shares of any denomination; |
• | convert any of our issued limited shares into redeemable shares which can be redeemed; |
• | cancel shares which, at the date of passing of the resolution, have not been taken or agreed to be taken by any person, and diminish the amount of the authorized share capital by the amount of the shares so cancelled; |
• | reduce our issued share capital; or |
• | alter our Memorandum or Articles of Association. |
General Meetings of Shareholders
We may at any time convene general meetings of shareholders. We hold an annual general meeting for each fiscal year. Under the 1991 Law, no more than 18 months may elapse between the date of one annual general meeting and the next.
178
Our Articles of Association provide that annual general meetings and meetings calling for the passing of a special resolution require 21 days’ notice of the place, day and time of the meeting in writing to our shareholders. Any other general meeting requires no less than 14 days’ notice in writing. Our directors may, at their discretion, and upon a request made in accordance with the 1991 Law by shareholders holding not less than one tenth of our total voting rights our directors shall, convene a general meeting. Our business may be transacted at a general meeting only when a quorum of shareholders is present. Two shareholders entitled to attend and to vote on the business to be transacted (or a proxy for a shareholder or a duly authorized representative of a corporation which is a shareholder) and holding shares conferring not less than one-third of the total voting rights, constitute a quorum provided that if at any time all of our issued shares are held by one shareholder, such quorum shall consist of the shareholder present in person or by proxy.
The annual general meetings deal with and dispose of all matters prescribed by our Articles of Association and by the 1991 Law including:
• | the consideration of our annual financial statements and report of our directors and auditors; |
• | the election of directors (if necessary); |
• | the appointment of auditors and the fixing of their remuneration; |
• | the sanction of dividends; and |
• | the transaction of any other business of which notice has been given. |
Failure to hold an annual general meeting is an offence by our company and our directors under the 1991 Law and carries a potential fine of up to £10,000 for our company and each director.
Voting Rights
Subject to any special terms as to voting on which any shares may have been issued or may from time to time be held, at a general meeting, every shareholder who is present in person (including any corporation present by its duly authorized representative) shall on a show of hands have one vote and every shareholder present in person or by proxy shall on a poll have one vote for each share of which he is a holder. In the case of joint holders only one of them may vote and in the absence of election as to who is to vote, the vote of the senior who tenders a vote, whether in person or by proxy, shall be accepted to the exclusion of the votes of the other joint holders.
A shareholder may appoint any person (whether or not a shareholder) to act as his proxy at any meeting of shareholders (or of any class of shareholders) in respect of all or a particular number of the shares held by him. A shareholder may appoint more than one person to act as his proxy and each such person shall act as proxy for the shareholder for the number of shares specified in the instrument appointing the person a proxy. If a shareholder appoints more than one person to act as his proxy, each instrument appointing a proxy shall specify the number of shares held by the shareholder for which the relevant person is appointed his proxy. Each duly appointed proxy has the same rights as the shareholder by whom he was appointed to speak at a meeting and vote at a meeting in respect of the number of shares held by the shareholder for which the relevant proxy is appointed his proxy.
For the purpose of determining shareholders entitled to notice of or to vote at any meeting of shareholders or any adjournment thereof or in order to make a determination of shareholders for any other proper purpose, our directors may fix in advance a date as the record date for any such determination of shareholders.
Shareholder Resolutions
An ordinary resolution requires the affirmative vote of a simple majority (that is, more than 50%) of our shareholders entitled to vote in person (or by corporate representative in case of a corporate entity) or by proxy at a general meeting.
A special resolution requires the affirmative vote of a majority of not less than two-thirds of our shareholders entitled to vote in person (or by corporate representative in the case of a corporate entity) or by proxy at a general meeting.
Our Articles of Association prohibit the passing of shareholder resolutions by written consent to remove an auditor or to remove a director before the expiry of his term of office.
179
Dividends
Subject to the provisions of the 1991 Law and of the Articles of Association, we may, by ordinary resolution, declare dividends to be paid to shareholders according to their respective rights and interests in our distributable reserves. However, no dividend shall exceed the amount recommended by our directors.
Subject to the provisions of the 1991 Law, we may declare and pay an interim dividend or dividends, including a dividend payable at a fixed rate, if an interim dividend or dividends appears to us to be justified by our distributable reserves.
Except as otherwise provided by the rights attached to any shares, all dividends shall be declared and paid according to the amounts paid up (as to both par and any premium) otherwise than in advance of calls, on the shares on which the dividend is paid. All dividends unclaimed for a period of ten years after having been declared or become due for payment shall, if the directors so resolve, be forfeited and shall cease to remain owing by us and shall henceforth belong to us absolutely.
We may, with the authority of an ordinary resolution, direct that payment of any dividend declared may be satisfied wholly or partly by the distribution of assets, and in particular of paid-up shares or debentures of any other company, or in any one or more of those ways.
We may also with the prior authority of an ordinary resolution, and subject to such conditions as we may determine, offer to holders of shares the right to elect to receive shares, credited as fully paid, instead of the whole, or some part, to be determined by us, of any dividend specified by the ordinary resolution.
For the purposes of determining shareholders entitled to receive a dividend or distribution, our directors may fix a record date for any such determination of shareholders. A record date for any dividend or distribution may be on or at any time before any date on which such dividend or distribution is paid or made and on or at any time before or after any date on which such dividend or distribution is declared.
Ownership Limitations
Our Articles of Association and the 1991 Law do not contain limits on the number of shares that a shareholder may own.
Transfer of Shares
Every shareholder may transfer all or any of his shares by instrument of transfer in writing in any usual form or in any form approved by us. The instrument must be executed by or on behalf of the transferor and, in the case of a transfer of a share which is not fully paid up, by or on behalf of the transferee. The transferor is deemed to remain the holder until the transferee’s name is entered in the register of shareholders.
We may, in our absolute discretion and without giving any reason, refuse to register any transfer of a share or renunciation of a renounceable letter of allotment unless:
• | it is in respect of a share which is fully paid-up; |
• | it is in respect of only one class of shares; |
• | it is in favor of a single transferee or not more than four joint transferees; |
• | it is duly stamped, if so required; and |
• | it is delivered for registration to our registered office for the time being or another place that we may from time to time determine accompanied by the certificate for the shares to which it relates and any other evidence as we may reasonably require to prove the right of the transferor or person renouncing to make the transfer or renunciation. |
Share Register
We maintain our register of members in Jersey. It is open to inspection during business hours by shareholders without charge and by other persons upon payment of a fee not exceeding £5. Any person may obtain a copy of our register of members upon payment of a fee not exceeding £0.50 per page and providing a declaration under oath as required by the 1991 Law.
180
Variation of Rights
If at any time our share capital is divided into different classes of shares, the special rights attached to any class, unless otherwise provided by the terms of issue of the shares of that class, may be varied or abrogated with the consent in writing of the holders of the majority of the issued shares of that class, or with the sanction of an ordinary resolution passed at a separate meeting of the holders of shares of that class, but not otherwise. To every such separate meeting all the provisions of our Articles of Association and of the 1991 Law relating to general meetings or to the proceedings thereat shall apply, mutatis mutandis, except that the necessary quorum shall be two persons holding or representing at least one-third in nominal amount of the issued shares of that class but so that if at any adjourned meeting of such holders a quorum as above defined is not present, those holders who are present in person shall be a quorum.
The special rights conferred upon the holders of any class of shares issued with preferred or other special rights shall be deemed to be varied by the reduction of the capital paid up on such shares and by the creation of further shares ranking in priority thereto, but shall not (unless otherwise expressly provided by our Articles of Association or by the conditions of issue of such shares) be deemed to be varied by the creation or issue of further shares ranking after or pari passu therewith. The rights conferred on holders of ordinary shares shall be deemed not to be varied by the creation, issue or redemption of any preferred or preference shares.
Capital Calls
We may, subject to the provisions of our Articles of Association and to any conditions of allotment, from time to time make calls upon the members in respect of any monies unpaid on their shares (whether on account of the nominal value of the shares or by way of premium) provided that (except as otherwise fixed by the conditions of application or allotment) no call on any share shall be payable within 14 days of the date appointed for payment of the last preceding call, and each member shall (subject to being given at least 14 clear days’ notice specifying the time or times and place of payment) pay us at the time or times and place so specified the amount called on his shares.
If a member fails to pay any call or installment of a call on or before the day appointed for payment thereof, we may serve a notice on him requiring payment of so much of the call or installment as is unpaid, together with any interest (at a rate not exceeding 10% per annum to be determined by us) which may have accrued and any expenses which may have been incurred by us by reason of such non-payment. The notice shall name a further day (not earlier than 14 days from the date of service thereof) on or before which and the place where the payment required by the notice is to be made, and shall state that in the event of non-payment at or before the time and at the place appointed, the shares on which the call was made will be liable to be forfeited.
Borrowing Powers
Our Articles of Association contain no restrictions on our power to borrow money or to mortgage or charge all or any part of our undertaking, property and assets.
Issue of Shares and Pre-emptive Rights
Subject to the provisions of the 1991 Law and to any special rights attached to any shares, we may allot or issue shares with those preferred, deferred or other special rights or restrictions regarding dividends, voting, return of capital or other matters as our directors from time to time determine. We may issue shares that are redeemable or are liable to be redeemed at our option or the option of the holder in accordance with our Articles of Association. Subject to the provisions of the 1991 Law, the unissued shares at the date of adoption of our Articles of Association and shares created thereafter shall be at the disposal of our directors. We cannot issue shares at a discount to par value. Securities, contracts, warrants or other instruments evidencing any preferred shares, option rights, securities having conversion or option rights or obligations may also be issued by the directors without the approval of the shareholders or entered into by us upon a resolution of the directors to that effect on such terms, conditions and other provisions as are fixed by the directors, including, without limitation, conditions that preclude or limit any person owning or offering to acquire a specified number or percentage of shares in us in issue, other shares, option rights, securities having conversion or option rights or obligations of us or the transferee of such person from exercising, converting, transferring or receiving the shares, option rights, securities having conversion or option rights or obligations.
There are no pre-emptive rights for the transfer of our shares either within the 1991 Law or our Articles of Association.
181
Directors’ Powers
Our business shall be managed by the directors who may exercise all of the powers that we are not by the 1991 Law or our Articles of Association required to exercise in a general meeting. Accordingly, the directors may (among other things) borrow money, mortgage or charge all of our property and assets (present and future) and issue securities.
Meetings of the Board of Directors
A director may, and the secretary on the requisition of a director shall, at any time, summon a meeting of the directors by giving to each director and alternate director not less than 24 hours’ notice of the meeting provided that any meeting may be convened at shorter notice and in such manner as each director or his alternate director shall approve provided further that unless otherwise resolved by the directors notices of directors’ meetings need not be in writing.
Subject to our Articles of Association, our Board of Directors may meet for the conducting of business, adjourn and otherwise regulate its proceedings as it sees fit. The quorum necessary for the transaction of business may be determined by the Board of Directors and unless otherwise determined shall be three persons, each being a director or an alternate director of whom two shall not be executive directors. Where more than three directors are present at a meeting, a majority of them must not be executive directors in order for the quorum to be constituted at the meeting. A duly convened meeting of the Board of Directors at which a quorum is present is necessary to exercise all or any of the board’s authorities, powers and discretions.
Our Board of Directors may from time to time appoint one or more of their number to be the holder of any executive office on such terms and for such periods as they may determine. The appointment of any director to any executive office shall be subject to termination if he ceases to be a director. Our Board of Directors may entrust to and confer upon a director holding any executive office any of the powers exercisable by the directors, upon such terms and conditions and with such restrictions as they think fit, and either collaterally with or to the exclusion of their own powers and may from time to time revoke, withdraw, alter or vary all or any of such powers.
Remuneration of Directors
Our directors shall be entitled to receive by way of fees for their services as directors any sum that we may, by ordinary resolution in general meeting from time to time determine. That sum, unless otherwise directed by the ordinary resolution by which it is voted, shall be divided among the directors in the manner that they agree or, failing agreement, equally. The remuneration (if any) of an alternate director shall be payable out of the remuneration payable to the director appointing him as may be agreed between them. The directors shall be repaid their traveling and other expenses properly and necessarily expended by them in attending meetings of the directors or members or otherwise on our affairs.
If any director shall be appointed agent or to perform extra services or to make any special exertions, the directors may remunerate such director therefor either by a fixed sum or by commission or participation in profits or otherwise or partly one way and partly in another as they think fit, and such remuneration may be either in addition to or in substitution for his above mentioned remuneration.
Directors’ Interests in Contracts
Subject to the provisions of the 1991 Law, a director may hold any other office or place of profit under us (other than the office of auditor) in conjunction with his office of director and may act in a professional capacity to us on such terms as to tenure of office, remuneration and otherwise as we may determine and, provided that he has disclosed to us the nature and extent of any of his interests which conflict or may conflict to a material extent with our interests at the first meeting of the directors at which a transaction is considered or as soon as practical after that meeting by notice in writing to the secretary or has otherwise previously disclosed that he is to be regarded as interested in a transaction with a specific person, a director notwithstanding his office (1) may be a party to, or otherwise interested in, any transaction or arrangement with us or in which we are otherwise interested, (2) may be a director or other officer of, or employed by, or a party to any transaction or arrangement with, or otherwise interested in, anybody corporate promoted by us or in which we are otherwise interested, and (3) shall not, by reason of his office, be accountable to us for any benefit which he derives from any such office or employment or from any such transaction or arrangement or from any interest in any such body corporate and no such transaction or arrangement shall be liable to be avoided on the ground of any such interest or benefit.
182
Restrictions on Directors’ Voting
A director, notwithstanding his interest, may be counted in the quorum present at any meeting at which any contract or arrangement in which he is interested is considered and, subject as provided above, he may vote in respect of any such contract or arrangement. A director, notwithstanding his interest, may be counted in the quorum present at any meeting at which he is appointed to hold any office or place of profit under us, or at which the terms of his appointment are arranged, but the director may not vote on his own appointment or the terms thereof or any proposal to select that director for re-election.
Number of Directors
Our board shall determine the maximum and minimum number of directors provided that the minimum number of directors shall be not less than three.
Directors’ Appointment, Resignation, Disqualification and Removal
Our Board of Directors is divided into three classes that are, as nearly as possible, of equal size. Each class of directors (other than initially) is elected for a three-year term of office but the terms are staggered so that the term of only one class of directors expires at each annual general meeting. Any additional directorships resulting from an increase in the number of directors will be distributed among the three classes so that, as nearly as possible, each class will consist of one-third of the directors. This classification of the Board of Directors may have the effect of delaying or preventing changes in control of management of our company. Our Board of Directors shall have power (unless they determine that any vacancy should be filled by us in general meeting) at any time and from time to time to appoint any person to be a director, either to fill any vacancy or as an addition to the existing directors. A vacancy for these purposes only will be deemed to exist if a director dies, resigns, ceases or becomes prohibited or disqualified by law from acting as a director, becomes bankrupt or enters into an arrangement or composition with his creditors, becomes of unsound mind or is removed by us from office for gross negligence or criminal conduct by ordinary resolution. A vacancy for these purposes will not be deemed to exist upon the expiry of the term of office of a director. At any general meeting at which a director retires or at which a director’s period of office expires we shall elect, by ordinary resolution of the general meeting, a director to fill the vacancy, unless our directors resolve to reduce the number of directors in office. Where the number of persons validly proposed for election or re-election as a director is greater than the number of directors to be elected, the persons receiving the most votes (up to the number of directors to be elected) shall be elected as directors and an absolute majority of the votes cast shall not be a pre-requisite to the election of such directors.
The directors shall hold office until they resign, they cease to be a director by virtue of a provision of the 1991 Law, they become disqualified by law or the terms of our Articles of Association from being a director, they become bankrupt or make any arrangement or composition with their creditors generally or they become of unsound mind or they are removed from office by us for gross negligence or criminal conduct by ordinary resolution in general meeting.
A director is not required to hold any of our shares.
Capitalization of Profits and Reserves
Subject to our Articles of Association, we may, upon the recommendation of our directors, by ordinary resolution resolve to capitalize any of our undistributed profits (including profits standing to the credit of any reserve account), any sum standing to the credit of any reserve account as a result of the sale or revaluation of an asset (other than goodwill) and any sum standing to the credit of our share premium account or capital redemption reserve.
Any sum which is capitalized shall be appropriated among our shareholders in the proportion in which such sum would have been divisible amongst them had the same been applied in paying dividends and applied in (1) paying up the amount (if any) unpaid on the shares held by the shareholders, or (2) issuing to shareholders, fully paid shares (issued either at par or a premium) or (subject to our Articles of Association) our debentures.
183
Unclaimed Dividends
Any dividend which has remained unclaimed for a period of 10 years from the date of declaration thereof shall, if the directors so resolve, be forfeited and cease to remain owing by us and shall thenceforth belong to us absolutely.
Indemnity, Limitation of Liability and Officers Liability Insurance
Insofar as the 1991 Law allows and, to the fullest extent permitted thereunder, we may indemnify any person who was or is involved in any manner (including, without limitation, as a party or a witness), or is threatened to be made so involved, in any threatened, pending or completed investigation, claim, action, suit or proceeding, whether civil, criminal, administrative or investigative including, without limitation, any proceeding by or in the right of ours to procure a judgment in our favor, but excluding any proceeding brought by such person against us or any affiliate of ours by reason of the fact that he is or was an officer, secretary, servant, employee or agent of ours, or is or was serving at our request as an officer, secretary, servant, employee or agent of another corporation, partnership, joint venture, trust or other enterprise against all expenses (including attorney’s fees), judgments, fines and amounts paid in settlement actually and reasonably incurred by him in connection with such proceeding. Such indemnification shall be a contract right and shall include the right to receive payment in advance of any expenses incurred by the indemnified person in connection with such proceeding, provided always that this right is permitted by the 1991 Law.
Subject to the 1991 Law, we may enter into contracts with any officer, secretary, servant, employee or agent of ours and may create a trust fund, grant a security interest, make a loan or other advancement or use other means (including, without limitation, a letter of credit) to ensure the payment of such amounts as may be necessary to effect indemnification as provided in the indemnity provisions in our Articles of Association.
Our directors are empowered to arrange for the purchase and maintenance in our name and at our expense of insurance cover for the benefit of any current or former officer of ours, our secretary and any current or former agent, servant or employee of ours against any liability which is incurred by any such person by reason of the fact that he is or was an officer of ours, our secretary or an agent, servant or employee of ours.
Subject to the 1991 Law, the right of indemnification, loan or advancement of expenses provided in our Articles of Association is not exclusive of any other rights to which a person seeking indemnification may otherwise be entitled, under any statute, memorandum or articles of association, agreement, vote of shareholders or disinterested directors or otherwise, both as to action in his official capacity and as to action in another capacity while holding such office. The provisions of our Articles of Association inure for the benefit of the heirs and legal representatives of any person entitled to indemnity under our Articles of Association and are applicable to proceedings commenced or continuing after the adoption of our Articles of Association whether arising from acts or omissions occurring before or after such adoption.
If any provision or provisions of our Articles of Association relative to indemnity are held to be invalid, illegal or unenforceable for any reason whatsoever: (i) the validity, legality and enforceability of the remaining provisions thereof shall not in any way be affected or impaired; and (ii) to the fullest extent possible, the provisions of our Articles of Association relative to indemnity shall be construed so as to give effect to the intent manifested by the provision held invalid, illegal or unenforceable.
Nothing in our Articles of Association prohibits us from making loans to officers, our secretary, servants, employees or agents to fund litigation expenses prior to such expenses being incurred.
184
Distribution of Assets on a Winding-up
Subject to any particular rights or limitations attached to any shares, if we are wound up, our assets available for distribution among our shareholders shall be applied first in repaying to our shareholders the amount paid up (as to both par and any premium) on their shares respectively, and if such assets shall be more than sufficient to repay to our shareholders the whole amount paid up (as to both par and any premium) on their shares, the balance shall be distributed among our shareholders in proportion to the amount which at the time of the commencement of the winding up had been actually paid up (as to both par and any premium) on their shares respectively.
If we are wound up, we may, with the approval of a special resolution and any other sanction required by the 1991 Law, divide the whole or any part of our assets among our shareholders in specie and our liquidator or, where there is no liquidator, our directors, may, for that purpose, value any assets and determine how the division shall be carried out as between our shareholders or different classes of shareholders. Similarly, with the approval of a special resolution and subject to any other sanction required by the 1991 Law, all or any of our assets may be vested in trustees for the benefit of our shareholders.
Other Jersey Law Considerations
Purchase of Own Shares
The 1991 Law provides that we may, with the sanction of a special resolution and subject to certain conditions, purchase any of our shares which are fully paid.
We may fund the purchase of our own shares from any source provided that our directors are satisfied that immediately after the date on which the purchase is made, we will be able to discharge our liabilities as they fall due and that having regard to (i) our prospects and to the intentions of our directors with respect to the management of our business and (ii) the amount and character of the financial resources that will in their view be available to us, we will be able to (a) continue to carry on our business and (b) discharge our liabilities as they fall due until the expiry of the period of 12 months immediately following the date on which the purchase was made or until we are dissolved, whichever occurs first.
We cannot purchase our shares if, as a result of such purchase, only redeemable shares would be in issue. Any shares that we purchase (other than shares that are, immediately after being purchased, held as treasury shares) are treated as cancelled upon purchase.
Mandatory Purchases and Acquisitions
The 1991 Law provides that where a person (which we refer to as the “offeror”) makes an offer to acquire all of the shares (or all of the shares of any class of shares) (other than treasury shares and any shares already held by the offeror and its associates at the date of the offer), if the offeror has by virtue of acceptances of the offer acquired or contracted to acquire not less than 90% in nominal value of the shares (or class of shares) to which the offer relates, the offeror by notice may compulsorily acquire the remaining shares. A holder of any such shares may apply to the Jersey court for an order that the offeror not be entitled to purchase the holder’s shares or that the offeror purchase the holder’s shares on terms different to those of the offer.
Where, prior to the expiry of the offer period, the offeror has by virtue of acceptances of the offer acquired or contracted to acquire not less than 90% in nominal value of all of the shares of the target company (other than treasury shares and any shares already held by the offeror and its associates at the date of the offer), the holder of any shares (or class of shares) to which the offer relates who has not accepted the offer may require the offeror to acquire those shares. In such circumstances, each of the offeror and the holder of the shares are entitled to apply to the Jersey court for an order that the offeror purchase the holder’s shares on terms different to those of the offer.
185
Compromises and Arrangements
Where a compromise or arrangement is proposed between a company and its creditors, or a class of them, or between the company and its shareholders, or a class of them, the Jersey court may on the application of the company or a creditor or member of it or, in the case of a company being wound up, of the liquidator, order a meeting of the creditors or class of creditors, or of the shareholders of the company or class of shareholders (as the case may be), to be called in a manner as the court directs.
If a majority in number representing 3/4ths in value of the creditors or class of creditors, or 3/4ths of the voting rights of shareholders or class of shareholders (as the case may be), present and voting either in person or by proxy at the meeting agree to a compromise or arrangement, the compromise or arrangement, if sanctioned by the court, is binding on all creditors or the class of creditors or on all the shareholders or class of shareholders, and also on the company or, in the case of a company in the course of being wound up, on the liquidator and contributories of the company.
No Pre-Emptive Rights
Neither our Articles of Association nor the 1991 Law confers any pre-emptive rights on our shareholders.
No Mandatory Offer Requirements
In some countries, the trading and securities legislation contains mandatory offer requirements when shareholders have reached certain share ownership thresholds. There are no mandatory offer requirements under Jersey legislation. The Companies (Takeovers and Mergers Panel) (Jersey) Law 2009 empowers the Minister for Economic Development in Jersey (the “Minister”) to appoint a Panel on Takeovers and Mergers (the “Jersey Panel”) as the body responsible for regulating takeovers and mergers of companies incorporated in Jersey. The Minister has appointed the UK Panel on Takeovers and Mergers (the “UK Panel”) to carry out the functions of the Jersey Panel. The Jersey Panel will be empowered to promulgate rules regulating takeovers and mergers of Jersey companies (the “Jersey Code”). The rules applicable to the regulation of takeovers and mergers promulgated by the UK Panel as set out in The City Code on Takeovers and Mergers (the “UK Code”) have been adopted as the Jersey Code. Rule 9 of the UK Code contains rules relative to mandatory offers. However, the UK Code only applies to (i) offers for Jersey companies if any of their securities are admitted to trading on a regulated market in the United Kingdom or any stock exchange in the Channel Islands or the Isle of Man and (ii) to public or certain private Jersey companies which are considered by the Panel to have their place of central management and control in the United Kingdom, the Channel Islands or the Isle of Man. As none of our securities are listed on a regulated market in the United Kingdom or on any stock exchange in the Channel Islands or the Isle of Man and as we are not centrally managed and controlled in the United Kingdom, the Channel Islands or the Isle of Man, it is not anticipated that the UK Code (which has been adopted as the Jersey Code) will apply to us.
In 2012, the UK Panel published consultation paper ‘PCP 2012/3: Companies subject to the Takeover Code’, which sought views on proposed amendments to the rules for determining the companies that are subject to the UK Code. No changes have yet been made to the UK Code on the basis of that consultation. It is possible that future changes to the rules for determining the companies that are subject to the UK Code, made on the basis of that consultation or otherwise, could result in the UK Code (which has been adopted as the Jersey Code) applying to us.
Non-Jersey Shareholders
There are no limitations imposed by Jersey law or by our Articles of Association on the rights of non-Jersey shareholders to hold or vote on our ordinary shares or securities convertible into our ordinary shares.
Rights of Minority Shareholders
Under Article 141 of the 1991 Law, a shareholder may apply to court for relief on the ground that our affairs are being conducted or have been conducted in a manner which is unfairly prejudicial to the interests of our shareholders generally or of some part of our shareholders (including at least the shareholder making the application) or that an actual or proposed act or omission by us (including an act or omission on our behalf) is or would be so prejudicial. What amounts to unfair prejudice is not defined in the 1991 Law. There may also be a common law personal actions available to our shareholders.
186
Under Article 143 of the 1991 Law (which sets out the types of relief a court may grant in relation to an action brought under Article 141 of the 1991 Law), the court may make an order regulating our affairs, requiring us to refrain from doing or continuing to do an act complained of, authorizing civil proceedings and providing for the purchase of shares by us or by any of our other shareholders.
Jersey Law and our Memorandum and Articles of Association
The content of our Memorandum and Articles of Association reflects the requirements of the 1991 Law. Jersey company law draws very heavily from company law in England and there are various similarities between the 1991 Law and English company law. However, the 1991 Law is considerably more limited in content than English company law and there are some notable differences between English and Jersey company law. There are, for example, no provisions under Jersey law (as there are under English law):
• | controlling possible conflicts of interests between us and our directors, such as loans by us or directors, and contracts between us and our directors other than a duty on our directors to disclose an interest in any transaction to be entered into by us or any of our subsidiaries which to a material extent conflicts with our interest; |
• | specifically requiring particulars to be shown in our accounts of the amount of loans to officers or directors’ emoluments and pensions, although these would probably be required to be shown in our accounts in conformity to the requirement that accounts must be prepared in accordance with generally accepted accounting principles; |
• | requiring us to file details of charges other than charges of Jersey realty; or |
• | as regards statutory pre-emption provisions in relation to further issues of shares. |
Comparison of Shareholders’ Rights
We are incorporated under the laws of Jersey, Channel Islands. The following discussion summarizes certain material differences between the rights of holders of our ordinary shares and the rights of holders of the common stock of a typical corporation incorporated under the laws of the State of Delaware which result from differences in governing documents and the laws of Jersey, Channel Islands and Delaware.
This discussion does not purport to be a complete statement of the rights of holders of our ordinary shares under applicable law in Jersey, Channel Islands and our Memorandum and Articles of Association or the rights of holders of the common stock of a typical corporation under applicable Delaware law and a typical certificate of incorporation and bylaws.
Corporate Law Issue |
Delaware Law |
Jersey Law | ||
Special Meetings of Shareholders | Shareholders of a Delaware corporation generally do not have the right to call meetings of shareholders unless that right is granted in the certificate of incorporation or by-laws. However, if a corporation fails to hold its annual meeting within a period of 30 days after the date designated for the annual meeting, or if no date has been designated for a period of 13 months after its last annual meeting, the Delaware Court of Chancery may order a meeting to be held upon the application of a shareholder. | Under the 1991 Law, directors shall, notwithstanding anything in a Jersey company’s articles of association, call a general meeting on a shareholders’ requisition. A shareholders’ requisition is a requisition of shareholders holding not less than one-tenth of the total voting rights of the shareholders of the company who have the right to vote at the meeting requisitioned. Failure to call an annual general meeting in accordance with the requirements of the 1991 Law is a criminal offense on the part of a Jersey company and its directors. The JFSC may, on the application of any officer, secretary or shareholder call, or direct the calling of, an annual general meeting. |
187
Corporate Law Issue |
Delaware Law |
Jersey Law | ||
Interested Director Transactions | Interested director transactions are not voidable if (i) the material facts as to the interested director’s relationship or interests are disclosed or are known to the Board of Directors and the board in good faith authorizes the transaction by the affirmative vote of a majority of the disinterested directors, (ii) the material facts are disclosed or are known to the shareholders entitled to vote on such transaction and the transaction is specifically approved in good faith by vote of the majority of shares entitled to vote on the matter or (iii) the transaction is fair as to the corporation as of the time it is authorized, approved or ratified by the Board of Directors, a committee or the shareholders. | A director of a Jersey company who has an interest in a transaction entered into or proposed to be entered into by the company or by a subsidiary which conflicts or may conflict with the interests of the company and of which the director is aware, must disclose the interest to the company. Failure to disclose an interest entitles the company or a member to apply to the court for an order setting aside the transaction concerned and directing that the director account to the company for any profit. A transaction is not voidable and a director is not accountable notwithstanding a failure to disclose if the transaction is confirmed by special resolution and the nature and extent of the director’s interest in the transaction are disclosed in reasonable detail in the notice calling the meeting at which the resolution is passed. Without prejudice to its power to order that a director account for any profit, a court shall not set aside a transaction unless it is satisfied that the interests of third parties who have acted in good faith thereunder would not thereby be unfairly prejudiced and the transaction was not reasonable and fair in the interests of the company at the time it was entered into. |
188
Corporate Law Issue |
Delaware Law |
Jersey Law | ||
Cumulative Voting | Delaware law does not require that a Delaware corporation provide for cumulative voting. However, the certificate of incorporation of a Delaware corporation may provide that shareholders of any class or classes or of any series may vote cumulatively either at all elections or at elections under specified circumstances. | There are no provisions in the 1991 Law relating to cumulative voting. | ||
Approval of Corporate Matters by Written Consent | Unless otherwise specified in a Delaware corporation’s certificate of incorporation, action required or permitted to be taken by shareholders at an annual or special meeting may be taken by shareholders without a meeting, without notice and without a vote, if consents in writing setting forth the action, are signed by shareholders with not less than the minimum number of votes that would be necessary to authorize the action at a meeting. All consents must be dated. No consent is effective unless, within 60 days of the earliest dated consent delivered to the corporation, written consents signed by a sufficient number of holders to take action are delivered to the corporation. | Insofar as the memorandum or articles of a Jersey company do not make other provision in that behalf, anything which may be done at a meeting of the company (other than remove an auditor) or at a meeting of any class of its shareholders may be done by a resolution in writing signed by or on behalf of each shareholder who, at the date when the resolution is deemed to be passed, would be entitled to vote on the resolution if it were proposed at a meeting. A resolution shall be deemed to be passed when the instrument, or the last of several instruments, is last signed or on such later date as is specified in the resolution. | ||
Business Combinations | With certain exceptions, a merger, consolidation or sale of all or substantially all the assets of a Delaware corporation must be approved by the Board of Directors and a majority of the outstanding shares entitled to vote thereon. | A sale or disposal of all or substantially all the assets of a Jersey company must be approved by the Board of Directors and, only if the Articles of Association of the company require, by the shareholders in general meeting. A merger involving a Jersey company must be generally documented in a merger agreement which must be approved by special resolution of that company. |
189
Corporate Law Issue |
Delaware Law |
Jersey Law | ||
Limitations on Directors Liability | A Delaware corporation may include in its certificate of incorporation provisions limiting the personal liability of its directors to the corporation or its shareholders for monetary damages for many types of breach of fiduciary duty. However, these provisions may not limit liability for any breach of the director’s duty of loyalty, acts or omissions not in good faith or that involve intentional misconduct or a knowing violation of law, the authorization of unlawful dividends, or unlawful share purchase or redemption, or any transaction from which a director derived an improper personal benefit. Moreover, these provisions would not be likely to bar claims arising under US federal securities laws. | Subject to the exceptions mentioned below, the 1991 Law prohibits a Jersey company and its subsidiaries from exempting any director from, or indemnifying any director against, any liability incurred by the director as a result of the director acting as a director of the company. It also prohibits any other person from doing so in exchange for a benefit conferred or detriment suffered, directly or indirectly, by the company. Any provision, whether contained in the articles of association of, or in a contract with, a company or otherwise which breaches these prohibitions is void. | ||
Indemnification of Directors and Officers | A Delaware corporation may indemnify a director or officer of the corporation against expenses (including attorneys’ fees), judgments, fines and amounts paid in settlement actually and reasonably incurred in defense of an action, suit or proceeding by reason of his or her position if (i) the director or officer acted in good faith and in a manner he or she reasonably believed to be in or not opposed to the best interests of the corporation and (ii) with respect to any criminal action or proceeding, the director or officer had no reasonable cause to believe his or her conduct was unlawful. | Under the 1991 Law, the prohibition referred to above does not apply to a provision for exempting a person from or indemnifying the person against (a) any liabilities incurred in defending any proceedings (whether civil or criminal) (i) in which judgment is given in the person’s favor or the person is acquitted, (ii) which are discontinued otherwise than for some benefit conferred by the person or on the person’s behalf or some detriment suffered by the person, or (iii) which are settled on terms which include such benefit or detriment and, in the opinion of a majority of the directors of the company (excluding any director who conferred such benefit or on whose behalf such benefit was conferred or who suffered such detriment), the person was substantially successful on the merits in the person’s resistance to the proceedings, (b) any liability incurred otherwise than to the company if the person acted in good faith with a view to the best interests of the company, (c) any liability incurred in connection with an application made to the court for relief from liability for negligence, default, breach of duty or breach of trust under Article 212 of the 1991 Law in which relief is granted to the person by the court or (d) any liability against which the company normally maintains insurance for persons other than directors. |
190
Corporate Law Issue |
Delaware Law |
Jersey Law | ||
Appraisal Rights | A shareholder of a Delaware corporation participating in certain major corporate transactions may, under certain circumstances, be entitled to appraisal rights pursuant to which the shareholder may receive cash in the amount of the fair value of the shares held by that shareholder (as determined by a court) in lieu of the consideration the shareholder would otherwise receive in the transaction. | The 1991 Law does not confer upon shareholders any appraisal rights. | ||
Shareholder Suits | Class actions and derivative actions generally are available to the shareholders of a Delaware corporation for, among other things, breach of fiduciary duty, corporate waste and actions not taken in accordance with applicable law. In such actions, the court has discretion to permit the winning party to recover attorneys’ fees incurred in connection with such action. | Under Article 141 of the 1991 Law, a shareholder may apply to court for relief on the ground that a company’s affairs are being conducted or have been conducted in a manner which is unfairly prejudicial to the interests of its shareholders generally or of some part of its shareholders (including at least the shareholder making the application) or that an actual or proposed act or omission by the company (including an act or omission on its behalf) is or would be so prejudicial. There may also be common law personal actions available to shareholders. Under Article 143 of the 1991 Law (which sets out the types of relief a court may grant in relation to an action brought under Article 141 of the 1991 Law), the court may make an order regulating the affairs of a company, requiring a company to refrain from doing or continuing to do an act complained of, authorizing civil proceedings and providing for the purchase of shares by a company or by any of its other shareholders. | ||
Inspection of Books and Records | All shareholders of a Delaware corporation have the right, upon written demand under oath stating the purpose thereof, to inspect or obtain copies of the corporation’s shares ledger and its other books and records for any proper purpose. | The register of shareholders and books containing the minutes of general meetings or of meetings of any class of shareholders of a Jersey company must during business hours be open to the inspection of a shareholder of the company without charge. The register of directors and secretaries must during business hours (subject to such reasonable restrictions as the company may by its articles or in general meeting impose, but so that not less than two hours in each business day be allowed for inspection) be open to the inspection of a shareholder or director of the company without charge. |
191
Corporate Law Issue |
Delaware Law |
Jersey Law | ||
Amendments to Charter | Amendments to the certificate of incorporation of a Delaware corporation require the affirmative vote of the holders of a majority of the outstanding shares entitled to vote thereon or such greater vote as is provided for in the certificate of incorporation; a provision in the certificate of incorporation requiring the vote of a greater number or proportion of the directors or of the holders of any class of shares than is required by Delaware corporate law may not be amended, altered or repealed except by such greater vote. | The memorandum and articles of association of a Jersey company may only be amended by special resolution (being a two-third majority if the articles of association of the company do not specify a greater majority) passed by shareholders in general meeting or by written resolution signed by all the shareholders entitled to vote. |
C. Material Contracts
Except as disclosed below, we are not currently, nor have we been for the past two years, party to any material contract, other than contracts entered into in the ordinary course of business.
(1) Employment Agreement effective April 1, 2022 between Keshav R. Murugesh and WNS Global Services Private Limited, and as amended thereafter.
Please see “Part I — Item 6. Directors, Senior Management and Employees — B. Compensation — Employment Agreement of our Executive Director.”
192
D. Exchange Controls
There are currently no Jersey or United Kingdom foreign exchange control restrictions on the payment of dividends on our ordinary shares or on the conduct of our operations. Jersey is in a monetary union with the United Kingdom. There are currently no limitations under Jersey law or our Articles of Association prohibiting persons who are not residents or nationals of United Kingdom from freely holding, voting or transferring our ordinary shares in the same manner as United Kingdom residents or nationals.
Exchange Rates
Substantially all of our revenue is denominated in pound sterling or US dollars and large part of our expenses, other than payments to repair centers, are incurred and paid in Indian rupees. We report our financial results in US dollars. The exchange rates among the Indian rupee, the pound sterling and the US dollar have changed substantially in recent years and may fluctuate substantially in the future. The results of our operations are affected as the Indian rupee and the pound sterling appreciate or depreciate against the US dollar and, as a result, any such appreciation or depreciation will likely affect the market price of our ordinary shares in the US.
The following table sets forth, for the periods indicated, information concerning the exchange rates between Indian rupees and US dollars based on the spot rate released by the Federal Reserve Board:
Fiscal year: |
Period End(1) | Average(2) | High | Low | ||||||||||||
2020 |
₹ | 75.39 | ₹ | 70.89 | ₹ | 76.37 | ₹ | 68.40 | ||||||||
2021 |
73.14 | 74.25 | 76.95 | 72.37 | ||||||||||||
2022 |
75.87 | 74.50 | 77.07 | 72.42 | ||||||||||||
2023 |
82.19 | 80.30 | 82.97 | 75.31 | ||||||||||||
2024 |
83.34 | 82.78 | 83.53 | 81.65 | ||||||||||||
2025 (until May 3, 2024) |
83.43 | 83.40 | 83.59 | 83.18 |
Notes:
(1) | The spot rate at each period end and the average rate for each period may differ from the exchange rates used in the preparation of consolidated financial statements included elsewhere in this annual report. |
(2) | Represents the average of the daily exchange rates during the period. |
The following table sets forth, for the periods indicated, information concerning the exchange rates between Indian rupees and US dollars based on the spot rate released by the Federal Reserve Board:
Month: |
High | Low | ||||||
November 2023 |
₹ | 83.36 | ₹ | 83.11 | ||||
December 2023 |
83.40 | 83.02 | ||||||
January 2024 |
83.31 | 82.92 | ||||||
February 2024 |
83.06 | 82.85 | ||||||
March 2024 |
83.53 | 82.72 | ||||||
April 2024 |
83.59 | 83.18 | ||||||
May 2024 (until May 3, 2024) |
83.45 | 83.43 |
193
The following table sets forth, for the periods indicated, information concerning the exchange rates between the pound sterling and US dollars based on the spot rate released by the Federal Reserve Board:
Fiscal year: |
Period End(1) | Average(2) | High | Low | ||||||||||||
2020 |
£ | 0.80 | £ | 0.79 | £ | 0.87 | £ | 0.75 | ||||||||
2021 |
0.73 | 0.72 | 0.73 | 0.72 | ||||||||||||
2022 |
0.76 | 0.73 | 0.77 | 0.70 | ||||||||||||
2023 |
0.81 | 0.83 | 0.93 | 0.76 | ||||||||||||
2024 |
0.79 | 0.80 | 0.83 | 0.76 | ||||||||||||
2025 (until May 3, 2024) |
0.80 | 0.80 | 0.81 | 0.79 |
Notes:
(1) | The spot rate at each period end and the average rate for each period may differ from the exchange rates used in the preparation of consolidated financial statements included elsewhere in this annual report. |
(2) | Represents the average of the daily exchange rates during the period. |
The following table sets forth, for the periods indicated, information concerning the exchange rates between the pound sterling and US dollars based on the spot rate released by the Federal Reserve Board:
Month: |
High | Low | ||||||
November 2023 |
£ | 0.82 | £ | 0.79 | ||||
December 2023 |
0.80 | 0.78 | ||||||
January 2024 |
0.79 | 0.78 | ||||||
February 2024 |
0.80 | 0.79 | ||||||
March 2024 |
0.79 | 0.78 | ||||||
April 2024 |
0.81 | 0.79 | ||||||
May 2024 (until May 3, 2024) |
0.80 | 0.80 |
194
E. Taxation
Jersey Tax Consequences
General
Jersey tax considerations
The following summary of the anticipated treatment of the company and holders of ordinary shares (other than residents of Jersey) is based on Jersey taxation law and practice as it is understood to apply at the date of this annual report. It does not constitute legal or tax advice and does not address all aspects of Jersey tax law and practice. Holders of our ordinary shares should consult their professional advisers on the implications of acquiring, buying, holding, selling or otherwise disposing of ordinary shares under the laws of the jurisdictions in which they may be liable to taxation. Shareholders should be aware that tax laws, rules and practice and their interpretation may change.
Taxation of the company
Jersey taxation legislation provides that the general basic rate of income tax on the profits of companies regarded as resident in Jersey or having a permanent establishment in Jersey will be 0% and that only a limited number of companies active in specific sectors (not applicable to us) shall be subject to income tax at a rate of more than 0%.
Under the Income Tax (Jersey) Law 1961, we are regarded as tax resident in Jersey but, not being a financial services company nor a specified utility company for the purposes of Jersey taxation legislation, are subject to the general basic rate of income tax on profits of 0%.
Taxation of holders of ordinary shares
The company will be entitled to pay dividends to holders of ordinary shares without any withholding or deduction for, or on account of, Jersey tax. The holders of ordinary shares (other than residents of Jersey) will not be subject to any tax in Jersey in respect of the holding, sale or other disposition of such ordinary shares.
Foreign Account Tax Compliance Act (“FATCA”)
Pursuant to U.S. Foreign Account Tax Compliance Act, commonly known as FATCA, certain payments of (or attributable to) US-source income could be subject to 30% withholding tax unless the company agrees to adopt certain reporting and withholding requirements if the Company is treated as a financial institution (“FI”) as defined under FATCA. Although we do not currently believe we are an FI and would use reasonable efforts to avoid the imposition of such withholding tax if we were to be treated as an FI, no assurance can be given that we will be able to do so.
On December 13, 2013, the Chief Minister of Jersey signed the US-Jersey Intergovernmental Agreement (“US IGA”), which imposes certain due diligence and reporting requirements on Jersey FIs. Where applicable information regarding shareholders, their ultimate beneficial owners and/or controlling persons, and their investment in and returns from the company, may need to be reported to the local States of Jersey tax authority.
Following the US implementation of FATCA, the UK introduced their own information reporting regime with certain Crown Dependencies and Overseas Territories such as Jersey. On October 22, 2013 the Chief Minister of Jersey signed the UK-Jersey IGA (“UK IGA”). The application of this UK FATCA regime is similar to US FATCA except that it imposes disclosure requirements in respect of certain shareholders who are, or are entities that are controlled by one or more, residents of the UK.
Both the US and UK IGAs are implemented through Jersey’s domestic legislation, in accordance with guidance notes which are published in draft form and updated on a regular basis. The first reporting deadline under the US IGA was June 30, 2015 and that under the UK IGA was June 30, 2016. Reporting is due annually thereafter with UK FATCA merging fully into Common Reporting Standard (“CRS”) over the coming years.
195
Common Reporting Standard
The Organization for Economic Co-operation and Development (“OECD”) has developed a Common Reporting Standard (the “CRS”) and model competent authority agreement (the “Multilateral Agreement”) to enable the multilateral and automatic exchange of financial account information. This global standard was modelled largely on the US FATCA regime but with some notable differences. Over 100 jurisdictions have committed to implementing the CRS or have already implemented the CRS (including the UK and Jersey). The first exchanges of information under the CRS occurred in 2017. Pursuant to the Multilateral Agreement, certain disclosure requirements may be imposed in respect of certain shareholders who are, or are entities that are controlled by one or more, residents of any of the signatory jurisdictions. Where applicable, information that would need to be disclosed will include certain information about shareholders, their ultimate beneficial owners and/or controllers, and their investment in and returns from the company. The US is not a participant in the regime.
Stamp duty
No stamp duty is payable in Jersey on the issue or inter vivos transfer of ordinary shares.
Upon the death of a holder of ordinary shares (and to the extent that the ordinary shares are considered movable estate situated in Jersey), Jersey probate stamp duty will be payable on the registration in Jersey of a grant of probate or letters of administration, which will be required in order to transfer or otherwise deal with:
(A) | (where the deceased person was domiciled in Jersey at the time of death) the deceased person’s personal estate wherever situated (including any ordinary shares to the extent that the ordinary shares are considered movable estate situated in Jersey) if the net value of such personal estate exceeds £30,000; or |
(B) | (if the deceased person was domiciled outside of Jersey at the time of death) the deceased person’s personal estate situated in Jersey (including any ordinary shares to the extent that the ordinary shares are considered movable estate situated in Jersey) if the net value of such personal estate exceeds £30,000. |
The rate of probate stamp duty payable is:
(A) | (where the net value of the deceased person’s relevant personal estate does not exceed £100,000) 0.5% of the net value of the deceased person’s relevant personal estate; |
(B) | (where the net value of the deceased person’s relevant personal estate exceeds £100,000) £500 for the first £100,000 plus 0.75% of the net value of the deceased person’s relevant personal estate which exceeds £100,000; or |
(C) | (where the net value of the deceased person’s relevant personal estate exceeds £13,360,000) the sum of £100,000. |
The above rates and threshold figures are current as at the date of this Annual Report. However, they are subject to potential change in the future.
In addition, application and other fees may be payable. Jersey does not otherwise levy taxes upon capital, inheritances, capital gains or gifts, nor are there any other estate duties.
US Federal Income Taxation
The following discussion describes certain material US federal income tax consequences to US Holders (defined below) under present law of an investment in our ordinary shares. This summary applies only to US Holders that hold our ordinary shares as capital assets and that have the US dollar as their functional currency. This discussion is based on the tax laws of the US as in effect on the date of this annual report and on US Treasury regulations in effect or, in some cases, proposed, as at the date of this annual report, as well as judicial and administrative interpretations thereof available on or before such date. All of the foregoing authorities are subject to change, which change could apply retroactively and could affect the tax consequences described below.
196
The following discussion does not address the Medicare contribution tax on net investment income or any state, local or non-US tax or any other tax consequences other than US federal income tax consequences. Furthermore, this summary does not address the tax consequences to any particular investor or to persons in special tax situations, such as:
• | banks; |
• | certain financial institutions; |
• | insurance companies; |
• | broker dealers; |
• | traders that elect to mark-to-market; |
• | tax-exempt entities; |
• | persons liable for alternative minimum tax; |
• | real estate investment trusts; |
• | regulated investment companies; |
• | US expatriates; |
• | persons holding ordinary shares as part of a straddle, hedging, conversion or integrated transaction; |
• | entities treated as partnerships or other pass-through entities, or persons holding ordinary shares through such entities; or |
• | persons that actually or constructively own 10% or more of our stock by vote or by value; |
• | persons who acquired ordinary shares pursuant to the exercise of any employee share option or otherwise as compensation; or |
• | persons who are subject to special tax accounting rules as a result of any item of gross income with respect to our ordinary shares being taken into account in an applicable financial statement. |
US HOLDERS OF OUR ORDINARY SHARES ARE URGED TO CONSULT THEIR TAX ADVISORS ABOUT THE APPLICATION OF THE US FEDERAL TAX RULES TO THEIR PARTICULAR CIRCUMSTANCES AS WELL AS THE STATE AND LOCAL AND NON-US TAX CONSEQUENCES TO THEM OF THE PURCHASE, OWNERSHIP AND DISPOSITION OF OUR ORDINARY SHARES.
The discussion below of the US federal income tax consequences to “US Holders” will apply to you if you are a beneficial owner of ordinary shares and you are, for US federal income tax purposes:
• | an individual who is a citizen or resident of the US; |
• | an entity taxable as a corporation organized in or under the laws of the United States, any State thereof or the District of Columbia; |
• | an estate whose income is subject to US federal income taxation regardless of its source; or |
• | a trust that (1) is subject to the primary supervision of a court within the United States and the control of one or more US persons for all substantial decisions of the trust or (2) has a valid election in effect under applicable US Treasury regulations to be treated as a US person. |
If you are a partner in an entity treated as a partnership that holds ordinary shares, your tax treatment will depend on your status and the activities of such entity.
197
The discussion below assumes that the representations contained in the deposit agreement are true and that the obligations in the deposit agreement and any related agreement will be complied with in accordance with their terms.
Distributions
Subject to the rules applicable to PFICs, discussed below, the gross amount of distributions made by us with respect to our ordinary shares (including the amount of any taxes withheld therefrom) generally will be includable in your gross income in the year received (or deemed received) as dividend income to the extent that such distributions are paid out of our current or accumulated earnings and profits as determined under US federal income tax principles. To the extent the amount of the distribution exceeds our current and accumulated earnings and profits (as determined under US federal income tax principles), such excess amount will be treated first as a tax-free return of your tax basis in your ordinary shares, and then, to the extent such excess amount exceeds your tax basis in your ordinary shares, as capital gain. We do not intend to calculate our earnings and profits under US federal income tax principles. Therefore, a US Holder should expect that a distribution will be treated as a dividend for US federal income tax purposes. No dividends received deduction will be allowed for US federal income tax purposes with respect to dividends paid by us.
With respect to non-corporate US Holders, including individual US Holders, under current law dividends may be “qualified dividend income” that is taxed at the lower applicable capital gains rate provided that (1) we are neither a PFIC nor treated as such with respect to you (as discussed below) for either our taxable year in which the dividend is paid or the preceding taxable year, (2) certain holding period and other requirements are met, and (3) the ordinary shares, are readily tradable on an established securities market in the US. Under US Internal Revenue Service (“IRS”) authority, ordinary shares are considered to be readily tradable on an established securities market in the US if they are listed on the NYSE. Any dividends you receive with respect to the ordinary shares will be taxed as qualified dividend income as long as the ordinary shares are listed on a US exchange. You should consult your tax advisors regarding the availability of the lower rate for dividends paid with respect to our ordinary shares, including the effects of any change in law after the date of this annual report.
The amount of any distribution paid in a currency other than the US dollar (a foreign currency) will be equal to the US dollar value of such foreign currency on the date such distribution is received by you, regardless of whether the payment is in fact converted into US dollars at that time. Gain or loss, if any, realized on the sale or other disposition of such foreign currency will be US source ordinary income or loss, subject to certain exceptions and limitations. If such foreign currency is converted into US dollars on the date of receipt, a US Holder generally should not be required to recognize foreign currency gain or loss in respect of the dividend. The amount of any distribution of property other than cash will be the fair market value of such property on the date of distribution.
Subject to certain exceptions, for foreign tax credit purposes, dividends distributed by us with respect to our ordinary shares generally will constitute foreign source income. The limitation on foreign taxes eligible for credit is calculated separately with respect to specific classes of income. For this purpose, dividends distributed by us with respect to our ordinary shares will generally constitute “passive category income.” To the extent the dividends would be taxable as qualified dividend income with respect to non-corporate US Holders, including individual US Holders (subject to the discussion above), the amount of the dividends taken into account for purposes of calculating the foreign tax credit limitation will in general be limited to the gross amount of the dividend, multiplied by the reduced tax rate applicable to qualified dividend income and divided by the highest tax rate normally applicable to dividends. Recently issued US Treasury regulations add various further limitations on the use of foreign tax credits. You are urged to consult your tax advisors regarding the foreign tax credit limitation and source of income rules with respect to distributions on our ordinary shares.
198
Sale or Other Disposition of Ordinary Shares
Subject to the PFIC rules discussed below, upon a sale or other taxable disposition of our ordinary shares, you generally will recognize capital gain or loss for US federal income tax purposes in an amount equal to the difference between the US dollar value of the amount realized and your adjusted tax basis in such ordinary shares. If the consideration you receive for our ordinary shares is not paid in US dollars, the amount realized will be the US dollar value of the payment received determined by reference to the spot rate of exchange on the date of the sale or other disposition. However, if our ordinary shares are treated as traded on an “established securities market” and you are either a cash basis taxpayer or an accrual basis taxpayer that has made a special election (which must be applied consistently from year to year and cannot be changed without the consent of the IRS), you will determine the US dollar value of the amount realized in a foreign currency by translating the amount received at the spot rate of exchange on the settlement date of the sale. An accrual basis taxpayer that does not make the special election will recognize exchange gain or loss to the extent attributable to the difference between the exchange rates on the sale date and the settlement date, and such exchange gain or loss generally will constitute US-source ordinary income or loss. Your initial tax basis in your ordinary shares will equal the US dollar value of the cost of such ordinary shares. If you use foreign currency to purchase ordinary shares, the cost of such ordinary shares will be the US dollar value of the foreign currency purchase price determined by reference to the spot rate of exchange on the date of purchase. However, if the ordinary shares, are treated as traded on an established securities market, for US federal income tax purposes, and you are either a cash basis taxpayer or an accrual basis taxpayer who has made the special election described above, you will determine the US dollar value of the cost of such ordinary shares by translating the amount paid at the spot rate of exchange on the settlement date of the purchase.
Subject to certain exceptions and limitations, gain or loss on a sale or other taxable disposition of ordinary shares generally will be capital gain or loss and will be treated as long-term capital gain or loss, if your holding period in the ordinary shares exceeds one year. Subject to the PFIC rules discussed below and other limitations, if you are a non-corporate US Holder, including an individual US Holder, any long-term capital gain will be subject to US federal income tax at preferential rates. The deductibility of capital losses is subject to significant limitations. Any such gain or loss recognized by a US Holder will generally be treated as U.S. source.
Passive Foreign Investment Company
A non-US corporation is considered a PFIC for any taxable year if either:
• | at least 75% of its gross income for such year is passive income, or |
• | at least 50% of its value of assets (determined on the basis of a quarterly average) during such year is attributable to assets that produce or are held for the production of passive income. |
We will be treated as owning our proportionate share of the assets and earning our proportionate share of the income of any other corporation in which we own, directly or indirectly, 25% or more (by value) of the stock.
Based on our financial statements and relevant market price of our ordinary shares, we believe that we should not be treated as a PFIC with respect to our most recently closed taxable year. If we were treated as a PFIC for any year during which you held ADSs or ordinary shares, we will continue to be treated as a PFIC for all succeeding years during which you hold ordinary shares, absent a special election as discussed below. The application of the PFIC rules is subject to uncertainty in several respects, and we cannot assure you we will not be a PFIC for any taxable year.
If we are a PFIC for any taxable year during which you hold ADSs or ordinary shares, you will be subject to special tax rules with respect to any “excess distribution” you receive and any gain you recognize from a sale or other disposition (including a pledge) of our ordinary shares, unless you make a “mark-to-market” or qualified electing fund (“QEF”) election (if available) as discussed below. Distributions you receive in a taxable year that are greater than 125% of the average annual distributions you received during the shorter of the three preceding taxable years or your holding period for the ordinary shares will be treated as an excess distribution.
199
Under these special tax rules:
• | the excess distribution or gain will be allocated ratably over your holding period for the ordinary shares, |
• | the amount allocated to the current taxable year, and any taxable year prior to the first taxable year in which we became a PFIC, will be treated as ordinary income, and |
• | the amount allocated to each other year will be subject to tax at the highest tax rate in effect for that year and the interest charge normally applicable to underpayments of tax will be imposed on the resulting tax attributable to each such year. |
The tax liability for amounts allocated to years prior to the year of disposition or “excess distribution” cannot be offset by any net operating losses for such years, and gains (but not losses) realized on the sale of ordinary shares cannot be treated as capital, even if you hold the ordinary shares as capital assets.
In addition, if we are a PFIC, to the extent any of our subsidiaries are also PFICs, you may be deemed to own shares in such subsidiaries that are directly or indirectly owned by us in that proportion which the value of the shares you own so bears to the value of all of our shares, and may be subject to the adverse tax consequences described above with respect to the shares of such subsidiaries you would be deemed to own.
If we are a PFIC, you may avoid taxation under the rules described above by making a QEF election to include your share of our income on a current basis in any taxable year that we are a PFIC, provided we agree to furnish you annually with certain tax information. However, we do not presently intend to prepare or provide such information.
Alternatively, if our ordinary shares are “marketable stock” (as defined below), you can avoid taxation under the unfavorable PFIC rules described above in respect of the ordinary shares by making a mark-to-market election in respect of the ordinary shares by the due date (determined with regard to extensions) for your tax return in respect of your first taxable year during which we are treated as a PFIC. If you make a mark-to-market election for the ordinary shares, you will include in income in each of your taxable years during which we are a PFIC an amount equal to the excess, if any, of the fair market value of the ordinary shares as at the close of your taxable year over your adjusted basis in such ordinary shares. You are allowed a deduction for the excess, if any, of the adjusted basis of the ordinary shares over their fair market value as at the close of the taxable year. However, deductions are allowable only to the extent of any net mark-to-market gains on our ordinary shares included in your income for prior taxable years. Amounts included in your income under a mark-to-market election, as well as gain on the actual sale or other disposition of the ordinary shares, are treated as ordinary income. Ordinary loss treatment also applies to the deductible portion of any mark-to-market loss on the ordinary shares, as well as to any loss realized on the actual sale or disposition of the ordinary shares, to the extent that the amount of such loss does not exceed the net mark-to-market gains previously included for such ordinary shares. Your basis in the ordinary shares will be adjusted to reflect any such income or loss amounts. Further, distributions would be taxed as described above under “— Distributions,” except the preferential dividend rates with respect to “qualified dividend income” would not apply. You will not be required to recognize mark-to-market gain or loss in respect of your taxable years during which we were not at any time a PFIC.
The mark-to-market election is available only for “marketable stock,” which is stock that is traded in other than de minimis quantities on at least 15 days during each calendar quarter on a qualified exchange, including the NYSE, or other market, as defined in the applicable US Treasury regulations. Our ordinary shares are listed on the NYSE and consequently, if you hold ordinary shares the mark-to-market election would be available to you, provided the ordinary shares are traded in sufficient quantities. US Holders of ordinary shares should consult their tax advisors as to whether the ordinary shares would qualify for the mark-to-market election.
You also generally can make a “deemed sale” election in respect of any time we cease being a PFIC, in which case you will be deemed to have sold, at fair market value, your ordinary shares (and shares of our PFIC subsidiaries, if any, that you are deemed to own) on the last day of our taxable year immediately prior to our taxable year in respect of which we are not a PFIC. If you make this deemed sale election, you generally would be subject to the unfavorable PFIC rules described above in respect of any gain realized on such deemed sale, but as long as we are not a PFIC for future years, you would not be subject to the PFIC rules for those future years.
If you hold ordinary shares in any year in which we or any of our subsidiaries are a PFIC, you would be required to file an annual information report with the US Internal Revenue Service, for each entity that is a PFIC, regarding distributions received on ordinary shares and any gain realized on the disposition of the ordinary shares. You should consult your tax advisors regarding the potential application of the PFIC rules to your ownership of ordinary shares and the elections discussed above.
200
US Information Reporting and Backup Withholding
Dividend payments with respect to our ordinary shares and proceeds from the sale, exchange or redemption of ordinary shares may be subject to information reporting to the IRS and US backup withholding. Backup withholding will not apply, however, to a US Holder who furnishes a correct taxpayer identification number and makes any other required certification or who is otherwise exempt from backup withholding and establishes such exempt status. US Holders should consult their tax advisors regarding the application of the US information reporting and backup withholding rules.
Backup withholding is not an additional tax. Amounts withheld as backup withholding may be credited against your US federal income tax liability, and you may obtain a refund of any excess amounts withheld under the backup withholding rules by timely filing the appropriate claim for refund with the IRS and furnishing any required information.
Additional Reporting Requirements
Certain US holders who are individuals (and certain entities) that own “specified foreign financial assets” with an aggregate value in excess of certain amounts are generally required to file an information report with respect to such assets with their tax returns. “Specified foreign financial assets” include any financial accounts maintained by foreign financial institutions, as well as any of the following, but only if they are not held in accounts maintained by financial institutions: (i) stocks and securities issued by non-US persons, (ii) financial instruments and contracts held for investment that have non-US issuers or counterparties, and (iii) interests in foreign entities. Under certain circumstances, an entity may be treated as an individual for purposes of these rules. Our ordinary shares may be subject to these rules. US Holders should consult their tax advisers regarding the application of this requirement to their ownership of our shares.
F. Dividends and Paying Agents
Not applicable.
G. Statement by Experts
Not applicable.
H. Documents on Display
Publicly filed documents concerning our company which are referred to in this annual report may be inspected and copied at the public reference facilities maintained by the Commission at 100 F Street, N.E., Washington, D.C. 20549. Copies of these materials can also be obtained from the Public Reference Room at the Commission’s principal office, 100 F Street, N.E., Washington D.C. 20549, after payment of fees at prescribed rates.
The Commission maintains a website at www.sec.gov that contains reports, proxy and information statements and other information regarding registrants that make electronic filings through its Electronic Data Gathering, Analysis, and Retrieval (“EDGAR”) system. We have made all our filings with the Commission using the EDGAR system.
I. Subsidiary Information
For more information on our subsidiaries, please see “Part I—Item 4. Information on the Company — C. Organizational Structure.”
J. Annual Report to Security Holders
Not applicable.
201
ITEM 11. QUANTITATIVE AND QUALITATIVE DISCLOSURES ABOUT MARKET RISK
General
Market risk is attributable to all market sensitive financial instruments including foreign currency receivables and payables. The value of a financial instrument may change as a result of changes in the interest rates, foreign currency exchange rates, commodity prices, equity prices and other market changes that affect market risk sensitive instruments.
Our exposure to market risk is primarily a function of our revenue generating activities and any future borrowings in foreign currency. The objective of market risk management is to avoid excessive exposure of our earnings to losses. Most of our exposure to market risk arises from our revenue and expenses that are denominated in different currencies.
The following risk management discussion and the estimated amounts generated from analytical techniques are forward-looking statements of market risk assuming certain market conditions. Our actual results in the future may differ materially from these projected results due to actual developments in the global financial markets.
Risk Management Procedures
We manage market risk through our treasury operations. Our senior management and our Board of Directors approve our treasury operations’ objectives and policies. The activities of our treasury operations include management of cash resources, implementation of hedging strategies for foreign currency exposures, implementation of borrowing strategies and monitoring compliance with market risk limits and policies. Our Foreign Exchange Committee, comprising the Director of the Board, our Group Chief Executive Officer and our Group Chief Financial Officer, is the approving authority for all our hedging transactions.
Components of Market Risk
Exchange Rate Risk
Our exposure to market risk arises principally from exchange rate risk. Although substantially all of our revenue less repair payments (non-GAAP) is denominated in pound sterling and US dollars, approximately 46.0% of our expenses (net of payments to repair centers made as part of our WNS Auto Claims BPM business) in fiscal 2023 were incurred and paid in Indian rupees. The exchange rates between each of the pound sterling, the Indian rupee, the Australian dollar, the South African rand and the Philippine peso, on the one hand, and the US dollar, on the other hand, have changed substantially in recent years and may fluctuate substantially in the future. See “Part I — Item 5 Operating and Financial Review Prospects — Foreign Exchange — Exchange Rates.”
Our exchange rate risk primarily arises from our foreign currency-denominated receivables. Based upon our level of operations in fiscal 2024, a sensitivity analysis shows that a 10% appreciation or depreciation in the pound sterling against the US dollar would have increased or decreased revenue by approximately $32.3 million and increased or decreased revenue less repair payments (non-GAAP) by approximately $28.4 million in fiscal 2024, a 10% appreciation or depreciation in the Australian dollar against the US dollar would have increased or decreased revenue and revenue less repair payments (non-GAAP) by approximately $7.8 million in fiscal 2024, and a 10% appreciation or depreciation in the South African rand against the US dollar would have increased or decreased revenue and revenue less repair payments (non-GAAP) by approximately $1.2 million in fiscal 2024. Similarly, a 10% appreciation or depreciation in the Indian rupee against the US dollar would have increased or decreased our expenses incurred and paid in Indian rupee in fiscal 2024 by approximately $51.3 million, a 10% appreciation or depreciation in the South African rand against the US dollar would have increased or decreased our expenses incurred and paid in South African rand in fiscal 2024 by approximately $6.7 million and a 10% appreciation or depreciation in the Philippine peso against the US dollar would have increased or decreased our expenses incurred and paid in Philippine peso in fiscal 2024 by approximately $12.6 million.
To protect against foreign exchange gains or losses on forecasted revenue and inter-company revenue, we have instituted a foreign currency cash flow hedging program. We hedge a part of our forecasted revenue and inter-company revenue denominated in foreign currencies with forward contracts and options.
Interest Rate Risk
Our exposure to interest rate risk arises from our borrowings that have a floating rate of interest, which is linked to various benchmark interest rates, including SOFR and SONIA. We manage this risk by maintaining an appropriate mix of fixed and floating rate borrowings and through the use of interest rate swap contracts. The costs of floating rate borrowings may be affected by fluctuations in the interest rates. In connection with the term loan facilities entered into in fiscal 2017, we entered into interest rate swap agreements with the banks in fiscal 2017. These swap agreements effectively convert the term loans from a variable interest rate to a fixed interest rate, thereby managing our exposure to changes in market interest rates under the term loans. As at March 31, 2024, we had not entered into any interest rate swap contract.
We monitor our positions and do not anticipate non-performance by the counterparties. We intend to selectively use interest rate swaps, options and other derivative instruments to manage our exposure to interest rate movements. These exposures are reviewed by appropriate levels of management on a periodic basis. We do not enter into hedging agreements for speculative purposes.
202
ITEM 12. DESCRIPTION OF SECURITIES OTHER THAN EQUITY SECURITIES
Not applicable
203
PART II
ITEM 13. DEFAULTS, DIVIDEND ARREARAGES AND DELINQUENCIES
None.
ITEM 14. MATERIAL MODIFICATIONS TO THE RIGHTS OF SECURITY HOLDERS AND USE OF PROCEEDS
Not applicable.
ITEM 15. CONTROLS AND PROCEDURES
Evaluation of Disclosure Controls and Procedures
As required by Rules 13a-15 and 15d-15 under the Exchange Act, management has evaluated, with the participation of our Group Chief Executive Officer and Group Chief Financial Officer, the effectiveness of our disclosure controls and procedures as at the end of the period covered by this annual report. Disclosure controls and procedures refer to controls and other procedures designed to ensure that information required to be disclosed in the reports we file or submit under the Exchange Act is recorded, processed, summarized and reported, within the time periods specified in the rules and forms of the Commission. Disclosure controls and procedures include, without limitation, controls and procedures designed to ensure that information required to be disclosed by us in our reports that we file or submit under the Exchange Act is accumulated and communicated to management, including our Group Chief Executive Officer and Group Chief Financial Officer, as appropriate to allow timely decisions regarding our required disclosure.
Based on the foregoing, our Group Chief Executive Officer and Group Chief Financial Officer have concluded that, as at March 31, 2024, our disclosure controls and procedures were effective and provide a reasonable level of assurance.
Management’s Report on Internal Control over Financial Reporting
Management is responsible for establishing and maintaining adequate internal control over financial reporting.
Internal control over financial reporting refers to a process designed by, or under the supervision of, our Group Chief Executive Officer and Group Chief Financial Officer and effected by our Board of Directors, management and other personnel, to provide reasonable assurance regarding the reliability of financial reporting and the preparation of financial statements for external purposes in accordance with generally accepted accounting principles and includes those policies and procedures that:
• | pertain to the maintenance of records that in reasonable detail accurately and fairly reflect the transactions and dispositions of our assets; |
• | provide reasonable assurance that transactions are recorded as necessary to permit preparation of financial statements in accordance with generally accepted accounting principles, and that our receipts and expenditures are being made only in accordance with authorizations of our management and members of our Board of Directors; and |
• | provide reasonable assurance regarding prevention or timely detection of unauthorized acquisition, use, or disposition of our assets that could have a material effect on our financial statements. |
Management recognizes that there are inherent limitations in the effectiveness of any system of internal control over financial reporting, including the possibility of human error and the circumvention or override of internal control. Accordingly, even effective internal control over financial reporting can provide only reasonable assurance with respect to financial statement preparation, and may not prevent or detect all misstatements. Also, projections of any evaluation of effectiveness to future periods are subject to the risk that controls may become inadequate due to changes in conditions, or that the degree of compliance with the policies or procedures may deteriorate.
Management assessed the effectiveness of internal control over financial reporting as at March 31, 2024, based on the criteria established in the 2013 Internal Control — Integrated Framework issued by the Committee of Sponsoring Organizations of the Treadway Commission. Based on the above criteria, and as a result of this assessment, management concluded that, as at March 31, 2024, our internal control over financial reporting was effective in providing reasonable assurance regarding the reliability of financial reporting and the preparation of financial statements for external purposes in accordance with generally accepted accounting principles.
The effectiveness of our internal control over financial reporting as at March 31, 2024, has been audited by Grant Thornton Bharat LLP, an independent registered public accounting firm, as stated in their report set out below.
204
REPORT OF INDEPENDENT REGISTERED PUBLIC ACCOUNTING FIRM
Board of Directors and Shareholders
WNS (Holdings) Limited
Opinion on internal control over financial reporting
We have audited the internal control over financial reporting of WNS (Holdings) Limited and subsidiaries (the “Company”) as of March 31, 2024, based on criteria established in the 2013 Internal Control — Integrated Framework issued by the Committee of Sponsoring Organizations of the Treadway Commission (“COSO”). In our opinion, the Company maintained, in all material respects, effective internal control over financial reporting as of March 31, 2024, based on criteria established in the 2013 Internal Control — Integrated Framework issued by COSO.
We also have audited, in accordance with the standards of the Public Company Accounting Oversight Board (United States) (“PCAOB”), the consolidated financial statements of the Company as of and for the year ended March 31, 2024, and our report dated May 10, 2024 expressed an unqualified opinion on those consolidated financial statements.
Basis for opinion
The Company’s management is responsible for maintaining effective internal control over financial reporting and for its assessment of the effectiveness of internal control over financial reporting, included in the accompanying Management’s Report on Internal Control over Financial Reporting (“Management’s Report”). Our responsibility is to express an opinion on the Company’s internal control over financial reporting based on our audit. We are a public accounting firm registered with the PCAOB and are required to be independent with respect to the Company in accordance with the U.S. federal securities laws and the applicable rules and regulations of the Securities and Exchange Commission and the PCAOB.
We conducted our audit in accordance with the standards of the PCAOB. Those standards require that we plan and perform the audit to obtain reasonable assurance about whether effective internal control over financial reporting was maintained in all material respects. Our audit included obtaining an understanding of internal control over financial reporting, assessing the risk that a material weakness exists, testing and evaluating the design and operating effectiveness of internal control based on the assessed risk, and performing such other procedures as we considered necessary in the circumstances. We believe that our audit provides a reasonable basis for our opinion.
Definition and limitations of internal control over financial reporting
A company’s internal control over financial reporting is a process designed to provide reasonable assurance regarding the reliability of financial reporting and the preparation of financial statements for external purposes in accordance with generally accepted accounting principles. A company’s internal control over financial reporting includes those policies and procedures that (1) pertain to the maintenance of records that, in reasonable detail, accurately and fairly reflect the transactions and dispositions of the assets of the company; (2) provide reasonable assurance that transactions are recorded as necessary to permit preparation of financial statements in accordance with generally accepted accounting principles, and that receipts and expenditures of the company are being made only in accordance with authorizations of management and directors of the company; and (3) provide reasonable assurance regarding prevention or timely detection of unauthorized acquisition, use, or disposition of the company’s assets that could have a material effect on the financial statements.
Because of its inherent limitations, internal control over financial reporting may not prevent or detect misstatements. Also, projections of any evaluation of effectiveness to future periods are subject to the risk that controls may become inadequate because of changes in conditions, or that the degree of compliance with the policies or procedures may deteriorate
/s/ GRANT THORNTON BHARAT LLP
Gurugram, India
May 10, 2024
205
Changes in Internal Control over Financial Reporting
Management has evaluated, with the participation of our Group Chief Executive Officer and Group Chief Financial Officer, whether any changes in our internal control over financial reporting that occurred during the period covered by this annual report on Form 20-F have materially affected, or are reasonably likely to materially affect, our internal control over financial reporting. Based on the evaluation we conducted, management has concluded that no such changes have occurred.
ITEM 16A. AUDIT COMMITTEE FINANCIAL EXPERT
Our Audit Committee members are Messrs. Jason Liberty (Chairman), Keith Haviland and Mario P. Vitale and Ms. Judy Marlinski.. Ms. Diane de Saint Victor, who was a Member of Audit Committee ceased to be Member with effect from December 1, 2023. Ms. Judy Marlinski was appointed as a Member of Audit Committee with effect from December 1, 2023. Each of Messrs. Liberty, Haviland and Vitale and Ms. Marlinski is an independent director pursuant to the applicable rules of the Commission and the NYSE. See “Part I — Item 6. Directors, Senior Management and Employees — A. Directors and Executive Officers” for the experience and qualifications of the members of the Audit Committee. Our Board of Directors has determined that Mr. Liberty qualifies as an “audit committee financial expert” as defined in Item 16A of Form 20-F.
ITEM 16B. CODE OF ETHICS
We have adopted a Code of Business Ethics and Conduct that is applicable to all of our directors, senior management and employees. The Code of Business Ethics and Conduct was amended in October 2016 and July 2018 to refresh our core purposes and values , in July 2019 to change the limit on the gift value in line with market standards, in October 2021 to update new link to report the violations to the Policy, in July 2022 to reflect changes in the limit on the client gifting and entertainment guidelines and in April 2023 to include a section on the Protection of Human Rights. We have posted the code on our website at www.wns.com. Information contained in our website does not constitute a part of this annual report. We will also make available a copy of the Code of Business Ethics and Conduct to any person, without charge, if a written request is made to our General Counsel at Gate 4, Godrej & Boyce Complex, Pirojshanagar, Vikhroli (W), Mumbai 400 079, India.
ITEM 16C. PRINCIPAL ACCOUNTANT FEES AND SERVICES
Principal Accountant Fees and Services
Grant Thornton Bharat LLP served as our independent public accountant for fiscal 2024. The following table shows the fees we paid or accrued for audit and other services provided by Grant Thornton Bharat LLP and Grant Thornton member firms for fiscal 2024 and 2023.
Fiscal | ||||||||
2024 | 2023 | |||||||
Audit fees |
$ | 829,077 | $ | 821,400 | ||||
|
|
|
|
|||||
Total |
$ | 829,077 | $ | 821,400 | ||||
|
|
|
|
Notes:
Audit fees: This category consists of fees billed for the audit of financial statements, quarterly review of financial statements and other audit services, which are normally provided by the independent auditors in connection with statutory and accounting matters that arose during, or as a result of, the audit or the review of interim financial statements and include the group audit; statutory audits required by non-US jurisdictions; consents and attest services.
Audit Committee Pre-approval Process
Our Audit Committee reviews and pre-approves the scope and the cost of all audit and permissible non-audit services performed by our independent auditor. All of the services provided by Grant Thornton Bharat LLP and Grant Thornton member firms during the last fiscal year have been pre-approved by our Audit Committee.
206
ITEM 16D. EXEMPTIONS FROM THE LISTING STANDARDS FOR AUDIT COMMITTEES
Not applicable.
ITEM 16E. PURCHASES OF EQUITY SECURITIES BY THE ISSUER AND AFFILIATED PURCHASERS
In fiscal 2021, our shareholders authorized a share repurchase program for the repurchase of up to 3,300,000 ADSs, at a price range of $10 to $110 per ADS. Pursuant to the terms of the repurchase program, our ADSs may be purchased in the open market from time to time for 36 months from April 1, 2021, the date the shareholders resolution approving the repurchase program was passed. We were not obligated under the repurchase program to repurchase a specific number of ADSs, and the repurchase program may be suspended at any time at our discretion. We held the shares underlying any such repurchased ADSs as treasury shares.
In fiscal 2022, we purchased 1,100,000 ADSs in the open market for a total consideration of $85.0 million (including transaction costs) under the above-mentioned share repurchase program. We funded the repurchases under the repurchase program with cash on hand. In fiscal 2022, we cancelled 2,200,000 ADSs that were held as treasury shares for an aggregate cost of $163.7 million (including share cancellation charges $0.1 million). The effect of the cancellation of these treasury shares was recognized in share capital amounting to $0.3 million and in share premium amounting to $163.4 million, in compliance with Jersey law. There was no effect on the total shareholders’ equity as a result of this cancellation.
In fiscal 2023, we purchased 1,100,000 ADSs in the open market for a total consideration of $81.6 million (including transaction costs) under the above-mentioned share repurchase program. We funded the repurchases under the repurchase program with cash on hand. In fiscal 2023, based on authorization from the Board of Directors, we cancelled 1,100,000 ADSs that were held as treasury shares for an aggregate cost of $81.7 million (including share cancellation charges $0.1 million). The effect of the cancellation of these treasury shares was recognized in share capital amounting to $0.1 million and in share premium amounting to $81.6 million, in compliance with Jersey law. There was no effect on the total shareholders’ equity as a result of this cancellation.
In fiscal 2024, we purchased 1,100,000 ADSs in the open market for a total consideration of $85.6 million (including transaction costs) under the above-mentioned share repurchase program and concluded the program. We funded the repurchases under the repurchase program with cash on hand. In fiscal 2024, we received authorization from the Board of Directors to cancel, and cancelled, 1,100,000 ADSs that were held as treasury shares for an aggregate cost of $85.7 million (including share cancellation charges). The effect of the cancellation of these treasury shares was recognized in share capital amounting to $0.1 million and in share premium amounting to $85.5 million, in compliance with Jersey law. There was no effect on the total shareholders’ equity as a result of this cancellation.
In fiscal 2024, our shareholders authorized a new share repurchase program for the repurchase of up to 3,300,000 of our ADSs, each representing one ordinary share, at a price range of $10 to $180 per ADS. Pursuant to the terms of the repurchase program, our ADSs may be purchased in the open market from time to time for 42 months from October 1, 2023 to March 31, 2027. We are not obligated under the repurchase program to repurchase a specific number of ADSs, and the repurchase program may be suspended at any time at our discretion. We may fund the repurchases with internal or external sources.
In fiscal 2024, we purchased 2,200,000 ADSs in the open market for a total consideration of $129.7 million (including transaction costs) under the above-mentioned share repurchase program. In fiscal 2024, we received authorization from the Board of Directors to cancel, and cancelled, 2,200,000 ADSs that were held as treasury shares for an aggregate cost of $129.8 million (including share cancellation charges $0.1 million). The effect of the cancellation of these treasury shares was recognized in share capital amounting to $0.3 million, in share premium amounting to $41.1 million and in retained earnings amounting to $88.4 million, in compliance with Jersey law. There was no effect on the total shareholders’ equity as a result of this cancellation.
From February 8, 2024 to May 10, 2024, we purchased 1,200,000 ADSs in the open market for a total consideration of $71.5 million (including transaction costs) under the above-mentioned share repurchase program pursuant to a repurchase plan under Rule 10b5-1 of the Exchange Act that we entered into on February 2, 2024.
In March 2024, we terminated our ADS facility and exchanged outstanding ADSs for ordinary shares. Due to this termination, the remaining 1.1 million ADSs yet to be repurchased under the above share repurchase program have become unavailable for repurchase until we obtain an approval from our shareholders for repurchasing of an equivalent amount of ordinary shares. We will hold an extraordinary general meeting on May 30, 2024, at which shareholders will be requested to authorize the purchase of the remaining 1.1 million ordinary shares.
207
The table below sets forth the details of ADSs repurchased during fiscal 2024, April 2024 and May 2024 (till May 10, 2024) under the above mentioned share repurchase programs:
Period |
No. of ADSs Purchased |
Average price paid per ADS (in $) |
Total number of ADSs purchased as part of publicly announced plans or programs |
Approximate US dollar value (in thousands) of ADSs that may yet be repurchased under the program (assuming purchase price of $110 per ADS) |
||||||||||||
April 1 to April 30, 2023 |
— | — | — | 121,000 | ||||||||||||
May 1 to May 31, 2023 |
723,381 | 77.83 | 723,381 | 41,428 | ||||||||||||
June 1 to June 30, 2023 |
376,619 | 77.83 | 376,619 | — | ||||||||||||
July 1 to July 31, 2023 |
— | — | — | 594,000 | ||||||||||||
August 1 to August 31, 2023 |
— | — | — | 594,000 | ||||||||||||
September 1 to September 30, 2023 |
— | — | — | 594,000 | ||||||||||||
October 1 to October 31, 2023 |
— | — | — | 594,000 | ||||||||||||
November 1 to November 30, 2023 |
1,000,000 | 58.12 | 1,000,000 | 414,000 | ||||||||||||
December 1 to December 31, 2023 |
— | — | — | 414,000 | ||||||||||||
January 1 to January 31, 2024 |
— | — | — | 414,000 | ||||||||||||
February 1 to February 28, 2024 |
1,200,000 | 59.61 | 1,200,000 | — | ||||||||||||
March 1 to March 31, 2024 |
— | — | — | — | ||||||||||||
April 1 to April 30, 2024 |
— | — | — | — | ||||||||||||
May 1 to May 10, 2024 |
— | — | — | — |
208
ITEM 16F. CHANGE IN REGISTRANT’S CERTIFYING ACCOUNTANT
Not applicable.
ITEM 16G. CORPORATE GOVERNANCE
Our Corporate Governance Guidelines were last amended in July 2021. We have posted our amended Corporate Governance Guidelines on our website at www.wns.com. Information contained in our website does not constitute a part of this annual report.
Messrs. Timothy L Main, Ms. Françoise Gri Ms. Lan Tu and Ms. Diane de Saint Victor are members of our Board of Directors and they serve on our NCG & ESG Committee and Compensation Committee. Messrs. Jason Liberty, Keith Haviland and Mario P. Vitale and Ms. Judy Marlinski, members of our Board of Directors serve on our Audit Committee. Each of Messrs. Main, Liberty, Haviland and Vitale Ms. Gri Ms. Tu, Ms. de Saint Victor and Ms. Marilinski satisfies the “independence” requirements of the NYSE listing standards and the “independence” requirements of Rule 10A-3 of the Exchange Act.
We are not aware of any significant differences between our corporate governance practices and those required to be followed by US issuers under the NYSE listing standards. As a foreign private issuer, we are exempt from the rules under the Exchange Act governing the furnishing and content of proxy statements, including disclosure relating to any conflicts of interests concerning the issuer’s compensation consultants, and our directors, senior management and principal shareholders are exempt from the reporting and “short-swing profit” recovery provisions contained in Section 16 of the Exchange Act.
ITEM 16H. MINE SAFETY DISCLOSURE
Not applicable.
ITEM 16I. DISCLOSURE REGARDING FOREIGN JURISDICTIONS THAT PREVENT INSPECTIONS
Not applicable.
209
• | Report of Independent Registered Public Accounting Firm |
• | Consolidated Statements of Financial Position as at March 31, 2024 and 2023 |
• | Consolidated Statements of Income for the years ended March 31, 2024, 2023 and 2022 |
• | Consolidated Statements of Comprehensive Income for the years ended March 31, 2024, 2023 and 2022 |
• | Consolidated Statements of Changes in Equity for the years ended March 31, 2024, 2023 and 2022 |
• | Consolidated Statements of Cash Flows for the years ended March 31, 2024, 2023 and 2022 |
• | Notes to Consolidated Financial Statements |
** | Filed herewith. |
WNS (HOLDINGS) LIMITED | ||
By: | /s/ Keshav R. Murugesh | |
Name: | Keshav R. Murugesh | |
Title: | Group Chief Executive Officer |
F-2 |
||||
F-3 |
||||
F-4 |
||||
F-5 |
||||
F-6 |
||||
F-8 |
||||
F-9 |
• |
We understood the revenue recognition process of the Company and evaluated related significant accounting policies for its appropriateness in accordance with the requirements of IFRS 15, Revenue from Contracts with Customers (‘IFRS 15’). |
• |
We evaluated the design and tested the operating effectiveness of internal controls related to the evaluation of customer agreements and determination of revenue recognition in accordance with IFRS 15. |
• |
We selected samples for customer agreements and performed the following procedures: |
• |
Obtained and read contract source documents for each selection, including master agreements, and other documents that were part of the agreement. |
• |
Tested management’s identification of significant terms in the customer agreements for completeness as relevant for revenue recognition under IFRS 15. |
• |
Tested the appropriateness of management’s application of accounting policies along with their use of judgements, in the determination of revenue recognition including identification and satisfaction of performance obligations and measurement of variable considerations, as per terms of the agreements based on verification of supporting documents and records maintained by the Company in this respect. |
As at |
||||||||||||
Notes |
March 31, 2024 |
March 31, 2023 |
||||||||||
ASSETS |
||||||||||||
Current assets: |
||||||||||||
Cash and cash equivalents |
5 | $ | $ | |||||||||
Investments |
6 | |||||||||||
Trade receivables, net |
7 | |||||||||||
Unbilled revenue |
7 | |||||||||||
Funds held for clients |
||||||||||||
Derivative assets |
14 | |||||||||||
Contract assets |
20 | |||||||||||
Prepayments and other current assets |
8 | |||||||||||
|
|
|
|
|||||||||
Total current assets |
||||||||||||
Non-current assets: |
||||||||||||
Goodwill |
9 | |||||||||||
Intangible assets |
10 | |||||||||||
Property and equipment |
11 | |||||||||||
Right-of-use |
12 | |||||||||||
Derivative assets |
14 | |||||||||||
Deferred tax assets |
25 | |||||||||||
Investments |
6 | |||||||||||
Contract assets |
20 | |||||||||||
Other non-current assets |
8 | |||||||||||
|
|
|
|
|||||||||
Total non-current assets |
||||||||||||
|
|
|
|
|||||||||
TOTAL ASSETS |
$ |
$ |
||||||||||
|
|
|
|
|||||||||
LIABILITIES AND EQUITY |
||||||||||||
Current liabilities: |
||||||||||||
Trade payables |
$ | $ | ||||||||||
Provisions and accrued expenses |
16 | |||||||||||
Derivative liabilities |
14 | |||||||||||
Pension and other employee obligations |
15 | |||||||||||
Short-term line of credit |
13 | — | ||||||||||
Current portion of long-term debt |
13 | |||||||||||
Contract liabilities |
17 | |||||||||||
Current taxes payable |
25 | |||||||||||
Lease liabilities |
12 | |||||||||||
Other liabilities |
18 | |||||||||||
|
|
|
|
|||||||||
Total current liabilities |
||||||||||||
Non-current liabilities: |
||||||||||||
Derivative liabilities |
14 | |||||||||||
Pension and other employee obligations |
15 | |||||||||||
Long-term debt |
13 | |||||||||||
Contract liabilities |
17 | |||||||||||
Lease liabilities |
12 | |||||||||||
Other non-current liabilities |
18 | |||||||||||
Deferred tax liabilities |
25 | |||||||||||
|
|
|
|
|||||||||
Total non-current liabilities |
||||||||||||
|
|
|
|
|||||||||
TOTAL LIABILITIES |
$ |
$ |
||||||||||
|
|
|
|
|||||||||
Shareholders’ equity: |
||||||||||||
Share capital (ordinary shares $ |
19 | |||||||||||
Share premium |
||||||||||||
Retained earnings |
||||||||||||
Other reserves |
||||||||||||
Other components of equity |
( |
) | ( |
) | ||||||||
|
|
|
|
|||||||||
Total shareholders’ equity |
||||||||||||
|
|
|
|
|||||||||
TOTAL LIABILITIES AND EQUITY |
$ |
$ |
||||||||||
|
|
|
|
Year ended March 31, |
||||||||||||||
Notes |
2024 |
2023 |
2022 |
|||||||||||
Revenue |
20 | $ | $ | $ | ||||||||||
Cost of revenue |
21 | |||||||||||||
Gross profit |
||||||||||||||
Operating expenses: |
||||||||||||||
Selling and marketing expenses |
21 | |||||||||||||
General and administrative expenses |
21 | |||||||||||||
Foreign exchange (gain)/ loss, net |
( |
) | ( |
) | ( |
) | ||||||||
Amortization of intangible assets |
10 | |||||||||||||
Impairment of intangible assets |
10 | |||||||||||||
Operating profit |
||||||||||||||
Other income, net |
23 | ( |
) | ( |
) | ( |
) | |||||||
Finance expense |
22 | |||||||||||||
Profit before income taxes |
||||||||||||||
Income tax expense |
25 | |||||||||||||
Profit after tax |
$ | $ | $ | |||||||||||
Earnings per ordinary share |
26 | |||||||||||||
Basic |
$ | $ | $ | |||||||||||
Diluted |
$ | $ | $ | |||||||||||
Year ended March 31, |
||||||||||||||||
Notes |
2024 |
2023 |
2022 |
|||||||||||||
Profit after tax |
$ | $ | $ | |||||||||||||
Other comprehensive income/(loss), net of taxes |
||||||||||||||||
Items that will not be reclassified to profit or loss: |
||||||||||||||||
Pension adjustment, net of tax |
( |
) | ( |
) | ||||||||||||
Items that will be reclassified subsequently to profit or loss: |
||||||||||||||||
Changes in fair value of cash flow hedges: |
||||||||||||||||
Current period gain/(loss) |
( |
) | ||||||||||||||
Net change in time value of option contracts designated as cash flow hedges |
( |
) | ( |
) | ||||||||||||
Reclassification to profit or loss |
( |
) | ||||||||||||||
Foreign currency translation loss |
( |
) | ( |
) | ( |
) | ||||||||||
Income tax (expense)/benefit relating to above |
25 | ( |
) | ( |
) | |||||||||||
|
|
|
|
|
|
|||||||||||
$ | ( |
) | $ | ( |
) | $ | ( |
) | ||||||||
|
|
|
|
|
|
|||||||||||
Total other comprehensive loss, net of taxes |
$ | ( |
) | $ | ( |
) | $ | ( |
) | |||||||
|
|
|
|
|
|
|||||||||||
Total comprehensive income |
$ | $ | $ | |||||||||||||
|
|
|
|
|
|
Other components of equity |
||||||||||||||||||||||||||||||||||||||||||||
Foreign currency |
Cash flow |
Total |
||||||||||||||||||||||||||||||||||||||||||
Share capital |
Share |
Retained |
Other |
translation |
hedging |
Pension |
Treasury shares |
shareholders’ |
||||||||||||||||||||||||||||||||||||
Number |
Par value |
Premium |
earnings |
reserves* |
reserve |
reserve |
adjustments |
Number |
Amount |
Equity |
||||||||||||||||||||||||||||||||||
Balance as at April 1, 2021 |
$ | $ | $ | $ | ( |
) | $ | ( |
) | $ | $ | ( |
) | $ | ||||||||||||||||||||||||||||||
Shares issued for exercised options and RSUs (Refer Note 24) |
( |
) | — | — | — | — | — | — | — | — | ||||||||||||||||||||||||||||||||||
Purchase of treasury shares (Refer Note 19) |
— | — | — | — | — | — | — | — | ( |
) | ( |
) | ||||||||||||||||||||||||||||||||
Cancellation of treasury shares (Refer Note 19) |
( |
) | ( |
) | ( |
) | — | — | — | — | — | ( |
) | — | ||||||||||||||||||||||||||||||
Share-based compensation expense (Refer Note 24) |
— | — | — | — | — | — | — | — | — | |||||||||||||||||||||||||||||||||||
Excess tax benefits relating to share-based options and RSUs |
— | — | — | — | — | — | — | — | — | |||||||||||||||||||||||||||||||||||
Transfer to other reserves |
— | — | — | ( |
) | — | — | — | — | — | — | |||||||||||||||||||||||||||||||||
Transfer from other reserves on utilization |
— | — | — | ( |
) | — | — | — | — | — | — | |||||||||||||||||||||||||||||||||
|
|
|
|
|
|
|
|
|
|
|
|
|
|
|
|
|
|
|
|
|
|
|||||||||||||||||||||||
Transactions with owners |
( |
) | ( |
) | ( |
) | ( |
) | — | — | — | ( |
) | ( |
) | |||||||||||||||||||||||||||||
|
|
|
|
|
|
|
|
|
|
|
|
|
|
|
|
|
|
|
|
|
|
|||||||||||||||||||||||
Profit after tax |
— | — | — | — | — | — | — | — | — | |||||||||||||||||||||||||||||||||||
Other comprehensive income/(loss), net of taxes |
— | — | — | — | — | ( |
) | — | — | ( |
) | |||||||||||||||||||||||||||||||||
|
|
|
|
|
|
|
|
|
|
|
|
|
|
|
|
|
|
|
|
|
|
|||||||||||||||||||||||
Total comprehensive income/(loss) for the period |
— | — | — | — | ( |
) | — | — | ||||||||||||||||||||||||||||||||||||
|
|
|
|
|
|
|
|
|
|
|
|
|
|
|
|
|
|
|
|
|
|
|||||||||||||||||||||||
Balance as at March 31, 2022 |
$ | $ | $ | $ | $ | ( |
) | $ | $ | $ | $ | |||||||||||||||||||||||||||||||||
|
|
|
|
|
|
|
|
|
|
|
|
|
|
|
|
|
|
|
|
|
|
Other components of equity |
||||||||||||||||||||||||||||||||||||||||||||
Foreign |
||||||||||||||||||||||||||||||||||||||||||||
currency |
Cash flow |
Total |
||||||||||||||||||||||||||||||||||||||||||
Share capital |
Share |
Retained |
Other |
translation |
hedging |
Pension |
Treasury shares |
shareholders’ |
||||||||||||||||||||||||||||||||||||
Number |
Par value |
Premium |
earnings |
reserves* |
reserve |
reserve |
adjustments |
Number |
Amount |
Equity |
||||||||||||||||||||||||||||||||||
Balance as at April 1, 2022 |
$ | $ | $ | $ | $ | ( |
) | $ | $ | $ | |
$ | ||||||||||||||||||||||||||||||||
Shares issued for exercised options and RSUs (Refer Note 24) |
( |
) | — | — | — | — | — | — | — | ( |
) | |||||||||||||||||||||||||||||||||
Purchase of treasury shares (Refer Note 19) |
— | — | — | — | — | — | — | — | ( |
) | ( |
) | ||||||||||||||||||||||||||||||||
Cancellation of treasury shares (Refer Note 19) |
( |
) | ( |
) | ( |
) | — | — | — | — | — | ( |
) | |||||||||||||||||||||||||||||||
Share-based compensation expense (Refer Note 24) |
— | — | — | — | — | — | — | — | — | |||||||||||||||||||||||||||||||||||
Excess tax benefits relating to share-based options and RSUs |
— | — | — | — | — | — | — | — | — | |||||||||||||||||||||||||||||||||||
Transfer to other reserves |
— | — | — | ( |
) | — | — | — | — | — | — | |||||||||||||||||||||||||||||||||
Transfer from other reserves on utilization |
— | — | — | ( |
) | — | — | — | — | — | — | |||||||||||||||||||||||||||||||||
|
|
|
|
|
|
|
|
|
|
|
|
|
|
|
|
|
|
|
|
|
|
|||||||||||||||||||||||
Transactions with owners |
( |
) | ( |
) | ( |
) | ( |
) | — | — | — | — | — | ( |
) | |||||||||||||||||||||||||||||
|
|
|
|
|
|
|
|
|
|
|
|
|
|
|
|
|
|
|
|
|
|
|||||||||||||||||||||||
Profit after tax |
— | — | — | — | — | — | — | — | — | |||||||||||||||||||||||||||||||||||
Other comprehensive income/(loss), net of taxes |
— | — | — | — | — | ( |
) | ( |
) | ( |
) | — | — | ( |
) | |||||||||||||||||||||||||||||
|
|
|
|
|
|
|
|
|
|
|
|
|
|
|
|
|
|
|
|
|
|
|||||||||||||||||||||||
Total comprehensive income/(loss) for the period |
— | — | — | — | ( |
) | ( |
) | ( |
) | — | — | ||||||||||||||||||||||||||||||||
|
|
|
|
|
|
|
|
|
|
|
|
|
|
|
|
|
|
|
|
|
|
|||||||||||||||||||||||
Balance as at March 31, 2023 |
$ | $ | $ | $ | $ | ( |
) | $ | ( |
) | $ | $ | $ | |||||||||||||||||||||||||||||||
|
|
|
|
|
|
|
|
|
|
|
|
|
|
|
|
|
|
|
|
|
|
Other components of equity |
||||||||||||||||||||||||||||||||||||||||||||
Foreign |
||||||||||||||||||||||||||||||||||||||||||||
currency |
Cash flow |
Total |
||||||||||||||||||||||||||||||||||||||||||
Share capital |
Share |
Retained |
Other |
translation |
hedging |
Pension |
Treasury shares |
shareholders’ |
||||||||||||||||||||||||||||||||||||
Number |
Par value |
Premium |
earnings |
reserves* |
reserve |
reserve |
adjustments |
Number |
Amount |
Equity |
||||||||||||||||||||||||||||||||||
Balance as at April 1, 2023 |
$ | $ | $ | $ | $ | ( |
) | $ | ( |
) | $ | $ | |
$ | ||||||||||||||||||||||||||||||
Shares issued for exercised options and RSUs (Refer Note 24) |
( |
) | — | — | — | — | — | — | — | |||||||||||||||||||||||||||||||||||
Purchase of treasury shares (Refer Note 19) |
— | — | — | — | — | — | — | — | ( |
) | ( |
) | ||||||||||||||||||||||||||||||||
Cancellation of treasury shares (Refer Note 19) |
( |
) | ( |
) | ( |
) | ( |
) | — | — | — | — | ( |
) | ||||||||||||||||||||||||||||||
Share-based compensation expense (Refer Note 24) |
— | — | — | — | — | — | — | — | — | |||||||||||||||||||||||||||||||||||
Excess tax benefits relating to share-based options and RSUs |
— | — | ( |
) | — | — | — | — | — | — | — | ( |
) | |||||||||||||||||||||||||||||||
Transfer to other reserves |
— | — | — | — | — | — | — | — | — | |||||||||||||||||||||||||||||||||||
Transfer from other reserves on utilization |
— | — | — | ( |
) | — | — | — | — | — | — | |||||||||||||||||||||||||||||||||
|
|
|
|
|
|
|
|
|
|
|
|
|
|
|
|
|
|
|
|
|
|
|||||||||||||||||||||||
Transactions with owners |
( |
) | ( |
) | ( |
) | ( |
) | ( |
) | — | — | — | ( |
) | |||||||||||||||||||||||||||||
|
|
|
|
|
|
|
|
|
|
|
|
|
|
|
|
|
|
|
|
|
|
|||||||||||||||||||||||
Profit after tax |
— | — | — | — | — | — | — | — | — | |||||||||||||||||||||||||||||||||||
Other comprehensive income/(loss), net of taxes |
— | — | — | — | — | ( |
) | ( |
) | — | — | ( |
) | |||||||||||||||||||||||||||||||
|
|
|
|
|
|
|
|
|
|
|
|
|
|
|
|
|
|
|
|
|
|
|||||||||||||||||||||||
Total comprehensive income/(loss) for the period |
— | — | — | — | ( |
) | ( |
) | — | — | ||||||||||||||||||||||||||||||||||
|
|
|
|
|
|
|
|
|
|
|
|
|
|
|
|
|
|
|
|
|
|
|||||||||||||||||||||||
Balance as at March 31, 2024 |
$ | $ | $ | $ | $ | ( |
) | $ | ( |
) | $ | ( |
) | $ | $ | |||||||||||||||||||||||||||||
|
|
|
|
|
|
|
|
|
|
|
|
|
|
|
|
|
|
|
|
|
|
* | Other reserves include the Special Economic Zone Re-Investment Reserve created out of the profits of eligible Special Economic Zones (“SEZ”) units in terms of the provisions of the Indian Income-tax Act, 1961. Further, these provisions require the reserve to be utilized by the Company for acquiring new plant and machinery for the purpose of its business (Refer Note 25). |
Year ended March 31, |
||||||||||||||
Notes |
2024 |
2023 |
2022 |
|||||||||||
Cash flows from operating activities: |
||||||||||||||
Profit after tax |
$ | $ | $ | |||||||||||
Adjustments to reconcile profit after tax to net cash generated from operating activities: |
||||||||||||||
Depreciation and amortization |
||||||||||||||
Impairment of intangible assets |
10 | |||||||||||||
Share-based compensation expense |
24 | |||||||||||||
Amortization of debt issue cost |
22 | |||||||||||||
Allowances for expected credit losses (“ECL”) |
7 | ( |
) | ( |
) | |||||||||
Unrealized exchange (gain)/loss, net |
( |
) | ( |
) | ||||||||||
Income tax expense |
25 | |||||||||||||
Interest expense |
22 | |||||||||||||
Interest income |
23 | ( |
) | ( |
) | ( |
) | |||||||
Income from mutual fund |
23 | ( |
) | ( |
) | ( |
) | |||||||
Fair value change on c ontingent consideration |
14 | ( |
) | |||||||||||
Gain on sale of property and equipment |
( |
) | ( |
) | ( |
) | ||||||||
Rent concession |
( |
) | ||||||||||||
Excess tax benefit from share-based compensation expense |
25 | ( |
) | ( |
) | ( |
) | |||||||
Unrealized loss/(gain) on derivative instruments |
( |
) | ||||||||||||
Changes in operating assets and liabilities: |
||||||||||||||
Trade receivables and unbilled revenue |
( |
) | ( |
) | ( |
) | ||||||||
Other assets |
( |
) | ( |
) | ( |
) | ||||||||
Trade payables |
( |
) | ( |
) | ||||||||||
Contract liabilities |
( |
) | ( |
) | ||||||||||
Other liabilities |
( |
) | ||||||||||||
Cash generated from operating activities before interest and income taxes |
||||||||||||||
Income taxes paid |
( |
) | ( |
) | ( |
) | ||||||||
Interest paid |
( |
) | ( |
) | ( |
) | ||||||||
Interest received |
||||||||||||||
Net cash provided by operating activities |
||||||||||||||
Cash flows from investing activities: |
||||||||||||||
Proceeds from working capital adjustment on acquisition of The Smartcube |
4(a) | |||||||||||||
Proceeds from working capital adjustment on acquisition of Optibuy |
4(b) | |||||||||||||
Deferred consideration paid towards acquisition of Optibuy |
4(b) | ( |
) | |||||||||||
Proceeds from working capital adjustment on acquisition of Vuram |
4(d) | |||||||||||||
Acquisition of The Smart Cube, net of cash acquired |
4(a) | ( |
) | |||||||||||
Acquisition of OptiBuy, net of cash acquired |
4(b) | ( |
) | |||||||||||
Payment for business transfer (from a large insurance company) |
4(c) | ( |
) | |||||||||||
Acquisition of Vuram, net of cash acquired |
4(d) | ( |
) | |||||||||||
Acquisition of CEPROCS, net of cash acquired |
4(e) | ( |
) | |||||||||||
Acquisition of MOL IPS, net of cash acquired |
4(f) | ( |
) | ( |
) | |||||||||
Payment for property and equipment and intangible assets |
( |
) | ( |
) | ( |
) | ||||||||
Proceeds from sale of property and equipment |
||||||||||||||
Investment in fixed deposits |
( |
) | ( |
) | ( |
) | ||||||||
Proceeds from maturity of fixed deposits |
||||||||||||||
Mutual fund sold/(purchased), net (short-term) |
( |
) | ||||||||||||
Profit on sale of mutual fund |
||||||||||||||
Proceeds from redemption of mutual fund (long-term) |
||||||||||||||
Net cash used in investing activities |
( |
) |
( |
) |
( |
) | ||||||||
Cash flows from financing activities: |
||||||||||||||
Payment for repurchase of shares |
( |
) | ( |
) | ( |
) | ||||||||
Transaction charges on cancellation of treasury shares |
( |
) | ( |
) | ( |
) | ||||||||
Proceeds from long-term debt |
||||||||||||||
Repayment of long-term debt |
( |
) | ( |
) | ( |
) | ||||||||
Principal payment for lease liabilities |
( |
) | ( |
) | ( |
) | ||||||||
Excess tax benefit from share-based compensation expense |
25 | |||||||||||||
Payment of transaction charges towards exercise of RSUs |
( |
) | ||||||||||||
Proceeds from short-term borrowings |
||||||||||||||
Repayment of short-term borrowings |
( |
) | ( |
) | ||||||||||
Payment of debt issuance cost |
( |
) | ||||||||||||
Net cash (used in)/provided by financing activities |
( |
) |
( |
) | ||||||||||
Exchange difference on cash and cash equivalents |
( |
) | ( |
) | ( |
) | ||||||||
Net change in cash and cash equivalents |
( |
) | ||||||||||||
Cash and cash equivalents at the beginning of the year |
||||||||||||||
Cash and cash equivalents at the end of the year |
5 | $ |
$ |
$ |
||||||||||
Non-cash transactions: |
||||||||||||||
Investing activities |
||||||||||||||
(i) Liability towards property and equipment and intangible assets purchased on credit |
$ | $ | $ | |||||||||||
(ii) Contingent consideration payable towards acquisitions |
18 | — | ||||||||||||
(iii) Deferred consideration payable towards acquisitions |
4(f) | |||||||||||||
(iv) Payable upon achievement of target |
4(b) | — |
Opening balance April 1, 2023 |
Cash flows, net of debt issuance cost paid |
Non-cash changes |
Closing balance March 31, 2024 |
|||||||||||||||||
Amortization of debt issuance cost |
Translation |
|||||||||||||||||||
Long-term debt (including current portion) |
$ | $ | ( |
) | $ | $ | $ |
Opening balance April 1, 2022 |
Cash flows, net of debt issuance cost paid |
Non-cash changes |
Closing balance March 31, 2023 |
|||||||||||||||||
Amortization of debt issuance cost |
Translation |
|||||||||||||||||||
Long-term debt (including current portion) |
$ | $ | $ | $ | $ |
* | For reconciliation of lease liabilities refer Note 12. |
a. |
Basis of preparation |
b. |
Basis of measurement |
a. | Derivative financial instruments; |
b. | Share-based payment transactions; |
c. | Investments in mutual funds; and |
d. | Contingent consideration. |
c. |
Use of estimates and judgments |
i. |
Revenue recognition |
ii. |
Current income taxes |
iii. |
Deferred income taxes |
iv. |
Impairment |
v. |
Valuation of derivative financial instruments |
vi. |
Accounting for defined benefit plans |
vii. |
Share-based compensation expense |
viii. |
Business combinations |
ix. |
Impairment of non-derivative financial assets |
x. |
Leases |
xi. |
Property and equipment |
d. |
Basis of consolidation |
i. |
Business combinations |
ii. |
Transactions eliminated on consolidation |
e. |
Functional and presentation currency |
f. |
Foreign currency transactions and translation |
i. |
Transactions in foreign currency |
ii. |
Foreign operations |
g. |
Financial instruments — initial recognition and subsequent measurement |
• | Non-derivative financial assets at amortized cost or at fair value through profit or loss (“FVTPL”). |
• | Non-derivative financial liabilities at FVTPL or at amortized cost. |
• | Derivative financial instruments under the category of financial assets or financial liabilities at FVTPL or at FVOCI. |
i. |
Non-derivative financial assets |
a) |
Financial assets at amortized cost |
i) | the asset is held within a business model whose objective is to hold assets in order to collect contractual cash flows; and |
ii) | the contractual terms of the instrument give rise on specified dates to cash flows that are solely payment of principal and interest on the principal amount outstanding. |
b) |
Financial assets at FVTPL |
ii. |
Non-derivative financial liabilities |
iii. |
Derivative financial instruments and hedge accounting |
iv. |
Offsetting of financial instruments |
v. |
Fair value of financial instruments |
vi. |
Impairment of non-derivative financial assets |
h. |
Equity and share capital |
i. |
Share capital, share premium and treasury shares |
ii. |
Retained earnings |
iii. |
Other components of equity |
i. |
Cash and cash equivalents |
j. |
Investments |
i. |
Mutual funds |
ii. |
Investments in fixed deposits |
k. |
Funds held for clients |
l. |
Property and equipment |
Asset description |
Asset life (in years) |
|||
Buildings |
||||
Computers and software |
||||
Furniture, fixtures and office equipment |
||||
Vehicles |
||||
Leasehold improvements |
m. |
Goodwill |
n. |
Intangible assets |
Asset description |
Weighted average amortization period (in months) |
|||
Customer contracts |
||||
Customer relationships |
||||
Covenant not-to-compete |
||||
Trade names |
||||
Technology |
||||
Software |
||||
Service mark |
o. |
Impairment of intangible assets and goodwill |
p. |
Employee benefits |
i. |
Defined contribution plans |
ii. |
Defined benefit plan |
iii. |
Compensated absences |
q. |
Share-based payments |
r. |
Provisions and accrued expenses |
s. |
Revenue recognition |
a) | per full-time-equivalent arrangements, which typically involve billings based on the number of full-time employees (or equivalent) deployed on the execution of the business process outsourced; |
b) | per transaction arrangements, which typically involve billings based on the number of transactions processed (such as the number of e-mail responses, or airline coupons or insurance claims processed); |
c) | subscription arrangements, which typically involve billings based on per member per month, based on contractually agreed rates; |
d) | fixed-price arrangements, which typically involve billings based on achievements of pre-defined deliverables or milestones; |
e) | outcome-based arrangements, which typically involve billings based on the business result achieved by our clients through our service efforts (such as measured based on a reduction in days sales outstanding, improvement in working capital, increase in collections or a reduction in operating expenses); or |
f) | other pricing arrangements, including cost-plus arrangements, which typically involve billing the contractually agreed direct and indirect costs and a fee based on the number of employees deployed under the arrangement. |
a) | the Company has the primary responsibility for providing the services, |
b) | the Company negotiates labor rates with repair centers, and |
c) | the Company is responsible for timely and satisfactory completion of repairs. |
t. |
Leases |
u. |
Finance expense |
v. |
Income taxes |
i. |
Current income tax |
ii. |
Deferred income tax |
w. |
Earnings per share |
x. |
Government grants |
i. | In January 2020, the IASB issued amendments to IAS 1 “ Presentation of Financial Statements Non-current’. The amendments in Classification of Liabilities as Current or Non-current (Amendments to IAS 1) affect only the presentation of liabilities in the statement of financial position, and not the amount or timing of recognition of any asset, liability, income or expenses, or the information that entities disclose about those items. The amendments: |
• | clarify that the classification of liabilities as current or non-current should be based on rights that are in existence at the end of the reporting period and align the wording in all affected paragraphs to refer to the “right” to defer settlement by at least 12 months and make explicit that only rights in place “at the end of the reporting period” should affect the classification of a liability; |
• | clarify that classification is unaffected by expectations about whether an entity will exercise its right to defer settlement of a liability; and |
• | make clear that settlement refers to the transfer to the counterparty of cash, equity instruments, other assets or services. |
ii. | In September 2022, the IASB issued ‘Lease Liability in a Sale and Leaseback (Amendments to IFRS 16)’ with amendments to clarify: |
• | the requirements that a seller-lessee uses in subsequently measuring sale and leaseback transactions that satisfy the requirements in IFRS 15 to be accounted for as a sale. |
iii. | In October 2022, the IASB issued “Non-current Liabilities with Covenants (Amendments to IAS 1)” to clarify the conditions with which an entity must comply within twelve months after the reporting period affect the classification of a liability. |
iv. | In August 2023, the IASB issued ‘Lack of Exchangeability (Amendments to IAS 21)’ that contains guidance to specify when a currency is exchangeable and how to determine the exchange rate when it is not. |
• | specify when a currency is exchangeable into another currency and when it is not; |
• | specify how an entity determines the exchange rate to apply when a currency is not exchangeable; |
• | require the disclosure of additional information when a currency is not exchangeable. |
a) |
The Smart Cube Limited |
Amount |
||||
Cash |
$ | |||
Trade receivables |
||||
Unbilled revenue |
||||
Prepayment and other current assets |
||||
Property and equipment |
||||
Right-of-use |
||||
Intangible assets |
||||
- Customer relationships |
||||
- Customer contracts |
||||
- Covenant not-to-compete |
||||
- Software |
||||
Non-current assets |
||||
Deferred tax assets |
||||
Current liabilities |
( |
) | ||
Non-current liabilities |
( |
) | ||
Lease liabilities |
( |
) | ||
Deferred tax liabilities |
( |
) | ||
|
|
|||
Net assets acquired |
||||
Less: Purchase consideration |
( |
) | ||
|
|
|||
Goodwill on acquisition |
$ |
|||
|
|
b) |
OptiBuy sp. z.o.o. |
Amount |
||||
Cash |
$ | |||
Trade receivables |
||||
Unbilled revenue |
||||
Prepayment and other current assets |
||||
Property and equipment |
||||
Right-of-use |
||||
Intangible assets |
||||
- Customer relationships |
||||
- Customer contracts |
||||
- Covenant not-to-compete |
||||
- Software |
||||
Non-current assets |
||||
Deferred tax assets |
||||
Current liabilities |
( |
) | ||
Non-current liabilities |
( |
) | ||
Lease liabilities |
( |
) | ||
Deferred tax liabilities |
( |
) | ||
|
|
|||
Net assets acquired |
||||
Less: Purchase consideration |
( |
) | ||
|
|
|||
Goodwill on acquisition |
$ |
|||
|
|
c) |
Payment for business transfer (from a large insurance company) |
Amount |
||||
Intangible assets |
||||
- Customer contracts |
$ | |||
Deferred tax liabilities |
( |
) | ||
|
|
|||
Net assets acquired |
||||
Less: Purchase consideration |
( |
) | ||
|
|
|||
Goodwill on acquisition |
$ |
|||
|
|
d) |
Vuram Technology Solutions Private Limited |
Amount |
||||
Cash |
$ | |||
Investments |
||||
Trade receivables |
||||
Unbilled revenue |
||||
Prepayment and other current assets |
||||
Property and equipment |
||||
Right-of-use |
||||
Intangible assets |
||||
- Customer relationships |
||||
- Customer contracts |
||||
- Covenant not-to-compete |
||||
- Software & Trade name |
||||
Non-current assets |
||||
Deferred tax assets |
||||
Current liabilities |
( |
) | ||
Non-current liabilities |
( |
) | ||
Lease liabilities |
( |
) | ||
Deferred tax liabilities |
( |
) | ||
|
|
|||
Net assets acquired |
||||
Less: Purchase consideration |
( |
) | ||
|
|
|||
Goodwill on acquisition |
$ |
|||
|
|
e) |
Payment for business transfer (‘CEPROCS’) |
f) |
MOL Information Processing Services (I) Private Limited (“MOL IPS”) |
Amount |
||||
Total assets |
$ | |||
Less: Total liabilities |
( |
) | ||
|
|
|||
Net assets acquired |
||||
Less: Purchase consideration |
( |
) | ||
|
|
|||
Goodwill on acquisition |
$ |
|||
|
|
As at |
||||||||
March 31, |
March 31, |
|||||||
2024 |
2023 |
|||||||
Cash and bank balances |
$ | $ | ||||||
Short-term deposits with banks* |
||||||||
|
|
|
|
|||||
Total |
$ |
$ |
||||||
|
|
|
|
As at |
||||||||
March 31, |
March 31, |
|||||||
2024 |
2023 |
|||||||
Investments in mutual funds |
$ | $ | ||||||
Investment in fixed deposits |
||||||||
|
|
|
|
|||||
Total |
$ |
$ |
||||||
|
|
|
|
|||||
As at |
||||||||
March 31, 2024 |
March 31, 2023 |
|||||||
Current investments |
$ | $ | ||||||
Non-current investments |
||||||||
|
|
|
|
|||||
Total |
$ |
$ |
||||||
|
|
|
|
As at |
||||||||
March 31, |
March 31, |
|||||||
2024 |
2023 |
|||||||
Trade receivables and unbilled revenue* |
$ | $ | ||||||
Less: Allowances for ECL |
( |
) |
( |
) | ||||
|
|
|
|
|||||
Total |
$ |
$ |
||||||
|
|
|
|
Year ended March 31, |
||||||||||||
2024 |
2023 |
2022 |
||||||||||
Balance at the beginning of the year |
$ | $ | $ | |||||||||
Charged to consolidated statement of income |
||||||||||||
Write-offs, net of collections |
( |
) | ( |
) | ( |
) | ||||||
Reversals |
( |
) |
( |
) | ( |
) | ||||||
Translation adjustment |
( |
) | ( |
) | ||||||||
|
|
|
|
|
|
|||||||
Balance at the end of the year |
$ |
$ |
$ |
|||||||||
|
|
|
|
|
|
As at |
||||||||
March 31, 2024 |
March 31, 2023 |
|||||||
Current: |
||||||||
Service tax and other tax receivables |
$ | $ | ||||||
Employee receivables |
||||||||
Advances to suppliers |
||||||||
Prepaid expenses |
||||||||
Other assets |
||||||||
|
|
|
|
|||||
Total |
$ |
$ |
||||||
|
|
|
|
|||||
Non-current: |
||||||||
Deposits |
$ | $ | ||||||
Income tax assets |
||||||||
Service tax and other tax receivables |
||||||||
Other assets |
||||||||
|
|
|
|
|||||
Total |
$ |
$ |
||||||
|
|
|
|
Total |
||||
Balance as at April 1, 2022 |
$ | |||
Goodwill arising on acquisitions (Refer Note 4(a),4(b), 4(c), 4(d)) |
||||
Translation adjustment |
( |
) | ||
|
|
|||
Balance as at March 31, 2023 |
$ |
|||
|
|
|||
Goodwill arising on acquisitions (Refer Note 4(a),4(b)) |
( |
) | ||
Translation adjustment |
||||
|
|
|||
Balance as at March 31, 2024 |
$ |
|||
|
|
As at |
||||
March 31, |
||||
2023 |
||||
Vuram |
$ | |||
The Smart Cube |
||||
HealthHelp |
||||
Research and Analytics |
||||
Denali |
||||
OptiBuy |
||||
Insurance |
||||
WNS Global BPM* |
||||
South Africa |
||||
Technology services |
||||
|
|
|||
$ |
||||
|
|
* | Excludes South Africa, Research and Analytics, Technology services, Denali, HealthHelp, Vuram, The Smart Cube, OptiBuy and Insurance goodwill. |
As at |
||||
March 31, 2024 |
||||
TSLU |
$ | |||
MRHP |
||||
HCLS |
||||
BFSI |
||||
|
|
|||
$ |
||||
|
|
a) | Estimated cash flows for |
b) | Terminal value arrived by extrapolating last forecasted year cash flows to perpetuity using long-term growth rates. These long-term growth rates take into consideration external macro-economic sources of data. Such long-term growth rate considered does not exceed that of the relevant business and industry sector. |
c) | The discount rates used are based on weighted average cost of capital of a comparable market participant, which are adjusted for specific country risks. |
Group of CGU’s |
||||||||||||||||
TSLU |
MRHP |
HCLS |
BFSI |
|||||||||||||
Discount rate |
% | % | % | % | ||||||||||||
Perpetual growth rate |
% | % | % | % |
CGU’s |
||||||||||||||||||||||||||||||||||||||||
WNS Global BPM* |
South Africa |
Denali |
Research and Analytics |
HealthHelp |
Technology Services |
Vuram |
Insurance |
Smart Cube |
Optibuy |
|||||||||||||||||||||||||||||||
Discount rate |
% | % | % | % | % | % | % | % | % | % | ||||||||||||||||||||||||||||||
Perpetual growth rate |
% | % | % | % | % | % | % | % | % | % |
* | Excludes South Africa, Research and Analytics, Technology services, Denali, HealthHelp, Vuram, Smart Cube, Optibuy and Insurance CGUs. |
Gross carrying value |
Customer Contracts |
Customer Relationships |
Intellectual Property and Other rights |
Trade names |
Technology |
Leasehold Benefits |
Covenant not-to- compete |
Service Mark |
Software |
Total |
||||||||||||||||||||||||||||||
Balance as at April 1, 2023 |
$ | $ | $ | $ | $ | $ | $ | $ | $ | $ | ||||||||||||||||||||||||||||||
Additions |
— | — | — | — | — | — | — | — | ||||||||||||||||||||||||||||||||
On acquisitions (Refer Note 4(a), 4(b)) |
— | — | — | — | — | |||||||||||||||||||||||||||||||||||
Translation adjustments |
( |
) | ( |
) | ( |
) | — | — | ( |
) | ( |
) | ||||||||||||||||||||||||||||
Balance as at March 31, 2024 |
$ | $ | $ | $ | $ | $ | $ | $ | $ | $ | ||||||||||||||||||||||||||||||
Accumulated amortization and impairment |
||||||||||||||||||||||||||||||||||||||||
Balance as at April 1, 2023 |
$ | $ | $ | $ | $ | $ | $ | $ | — | $ | $ | |||||||||||||||||||||||||||||
Amortization |
— | — | — | |||||||||||||||||||||||||||||||||||||
Impairment |
— | — | — | — | — | — | — | — | ||||||||||||||||||||||||||||||||
Translation adjustments |
( |
) | ( |
) | ( |
) | — | ( |
) | — | ( |
) | ( |
) | ||||||||||||||||||||||||||
Balance as at March 31, 2024 |
$ | $ | $ | $ | $ | $ | $ | $ | — | $ | $ | |||||||||||||||||||||||||||||
Net carrying value as at March 31, 2024 |
$ |
$ |
$ |
$ |
$ |
$ |
$ |
$ |
$ |
$ |
||||||||||||||||||||||||||||||
Gross carrying value |
Customer Contracts |
Customer Relationships |
Intellectual Property and Other rights |
Trade names |
Technology |
Leasehold Benefits |
Covenant not-to- compete |
Service mark |
Software |
Total |
||||||||||||||||||||||||||||||
Balance as at April 1, 2022 |
$ | $ | $ | $ | $ | $ | $ | $ | $ | $ | ||||||||||||||||||||||||||||||
Additions |
— | — | — | — | — | — | — | — | ||||||||||||||||||||||||||||||||
On acquisitions (Refer Note 4(a), 4(b), 4(c), 4(d)) |
— | — | — | — | ||||||||||||||||||||||||||||||||||||
Translation adjustments |
( |
) | ( |
) | ( |
) | ( |
) | ( |
) | — | ( |
) | — | ( |
) | ( |
) | ||||||||||||||||||||||
Balance as at March 31, 2023 |
$ | $ | $ | $ | $ | $ | $ | $ | $ | $ | ||||||||||||||||||||||||||||||
Accumulated amortization |
||||||||||||||||||||||||||||||||||||||||
Balance as at April 1, 2022 |
$ | $ | $ | $ | $ | $ | $ | $ | — | $ | $ | |||||||||||||||||||||||||||||
Amortization |
— | — | — | — | ||||||||||||||||||||||||||||||||||||
Translation adjustments |
( |
) | ( |
) | ( |
) | ( |
) | ( |
) | — | ( |
) | — | ( |
) | ( |
) | ||||||||||||||||||||||
Balance as at March 31, 2023 |
$ | $ | $ | $ | $ | $ | $ | $ | — | $ | $ | |||||||||||||||||||||||||||||
Net carrying value as at March 31, 2023 |
$ |
$ |
$ |
$ |
$ |
$ |
$ |
$ |
$ |
$ |
||||||||||||||||||||||||||||||
Balance life |
||||
(in months) |
||||
Customer relationships |
||||
Customer contracts |
||||
Trade names |
||||
Covenant not-to-compete |
||||
Technology |
||||
Software |
Amount |
||||
2025 |
$ | |||
2026 |
||||
2027 |
||||
2028 |
||||
2029 |
||||
Thereafter |
||||
$ | * | |||
* | Excludes service mark, as it has an indefinite useful life. |
Impairment |
of intangible assets |
Gross carrying value |
Building |
Computers and software |
Furniture, fixtures and office equipment |
Vehicles |
Leasehold improvements |
Total |
||||||||||||||||||
Balance as at April 1, 2023 |
$ | $ | $ | $ | $ | $ | ||||||||||||||||||
Additions |
— | |||||||||||||||||||||||
On acquisitions (Refer Note 4(a)) |
— | ( |
) | ( |
) | ( |
) | |||||||||||||||||
Disposals/retirements |
— | ( |
) | ( |
) | ( |
) | ( |
) | ( |
) | |||||||||||||
Translation adjustments |
( |
) | ( |
) | ( |
) | ( |
) | ( |
) | ( |
) | ||||||||||||
|
|
|
|
|
|
|
|
|
|
|
|
|||||||||||||
Balance as at March 31, 2024 |
$ | $ | $ | $ | $ | $ | ||||||||||||||||||
|
|
|
|
|
|
|
|
|
|
|
|
|||||||||||||
Accumulated depreciation |
||||||||||||||||||||||||
Balance as at April 1, 2023 |
$ | $ | $ | $ | $ | $ | ||||||||||||||||||
Depreciation |
||||||||||||||||||||||||
Disposals/retirements |
— | ( |
) | ( |
) | ( |
) | ( |
) | ( |
) | |||||||||||||
Translation adjustments |
( |
) | ( |
) | ( |
) | ( |
) | ( |
) | ( |
) | ||||||||||||
|
|
|
|
|
|
|
|
|
|
|
|
|||||||||||||
Balance as at March 31, 2024 |
$ | $ | $ | $ | $ | $ | ||||||||||||||||||
|
|
|
|
|
|
|
|
|
|
|
|
|||||||||||||
Capital work-in-progress |
— | — | — | — | — | |||||||||||||||||||
|
|
|
|
|
|
|
|
|
|
|
|
|||||||||||||
Net carrying value as at March 31, 2024 |
$ |
$ |
$ |
$ |
$ |
$ |
||||||||||||||||||
|
|
|
|
|
|
|
|
|
|
|
|
Gross carrying value |
Building |
Computers and software |
Furniture, fixtures and office equipment |
Vehicles |
Leasehold improvements |
Total |
||||||||||||||||||
Balance as at April 1, 2022 |
$ | $ | $ | $ | $ | $ | ||||||||||||||||||
Additions |
— | — | ||||||||||||||||||||||
On acquisitions (Refer Note 4(a), 4(b), 4(d)) |
— | |||||||||||||||||||||||
Disposals/retirements |
— | ( |
) | ( |
) | ( |
) | ( |
) | |||||||||||||||
Translation adjustments |
( |
) | ( |
) | ( |
) | ( |
) | ( |
) | ( |
) | ||||||||||||
|
|
|
|
|
|
|
|
|
|
|
|
|||||||||||||
Balance as at March 31, 2023 |
$ | $ | $ | $ | $ | $ | ||||||||||||||||||
|
|
|
|
|
|
|
|
|
|
|
|
|||||||||||||
Accumulated depreciation |
||||||||||||||||||||||||
Balance as at April 1, 2022 |
$ | $ | $ | $ | $ | $ | ||||||||||||||||||
Depreciation |
||||||||||||||||||||||||
Disposals/retirements |
— | ( |
) | ( |
) | ( |
) | ( |
) | |||||||||||||||
Translation adjustments |
( |
) | ( |
) | ( |
) | ( |
) | ( |
) | ( |
) | ||||||||||||
|
|
|
|
|
|
|
|
|
|
|
|
|||||||||||||
Balance as at March 31, 2023 |
$ | $ | $ | $ | $ | $ | ||||||||||||||||||
|
|
|
|
|
|
|
|
|
|
|
|
|||||||||||||
Capital work-in-progress |
— | — | — | — | — | |||||||||||||||||||
|
|
|
|
|
|
|
|
|
|
|
|
|||||||||||||
Net carrying value as at March 31, 2023 |
$ |
$ |
$ |
$ |
$ |
$ |
||||||||||||||||||
|
|
|
|
|
|
|
|
|
|
|
|
Gross carrying value |
Premises |
Equipment |
Motor vehicles |
Total |
||||||||||||
Balance as at April 1, 2023 |
$ | $ | $ | $ | ||||||||||||
Additions |
||||||||||||||||
Terminations/modifications |
— | |||||||||||||||
Translation adjustments |
( |
) | ( |
) | ||||||||||||
|
|
|
|
|
|
|
|
|||||||||
Balance as at March 31, 2024 |
$ | $ | $ | $ | ||||||||||||
|
|
|
|
|
|
|
|
|||||||||
Accumulated depreciation |
||||||||||||||||
Balance as at April 1, 2023 |
$ | $ | $ | $ | ||||||||||||
Depreciation |
||||||||||||||||
Terminations/modifications |
( |
) | ( |
) | ||||||||||||
Translation adjustments |
( |
) | ( |
) | ||||||||||||
|
|
|
|
|
|
|
|
|||||||||
Balance as at March 31, 2024 |
$ | $ | $ | $ | ||||||||||||
|
|
|
|
|
|
|
|
|||||||||
Net carrying value as at March 31, 2024 |
$ |
$ |
$ |
$ |
||||||||||||
|
|
|
|
|
|
|
|
Gross carrying value |
Premises |
Computers |
Equipment |
Motor vehicles |
Total |
|||||||||||||||
Balance as at April 1, 2022 |
$ | $ | $ | $ | $ | |||||||||||||||
Additions |
— | — | ||||||||||||||||||
On acquisition (Refer Note 4(a), 4(b), 4(d)) |
— | — | ||||||||||||||||||
Terminations/modifications |
( |
) | — | ( |
) | |||||||||||||||
Translation adjustments |
( |
) | ( |
) | ( |
) | ( |
) | ( |
) | ||||||||||
|
|
|
|
|
|
|
|
|
|
|||||||||||
Balance as at March 31, 2023 |
$ | $ | — | $ | $ | $ | ||||||||||||||
|
|
|
|
|
|
|
|
|
|
|||||||||||
Accumulated depreciation |
||||||||||||||||||||
Balance as at April 1, 2022 |
$ | $ | $ | $ | $ | |||||||||||||||
Depreciation |
— | |||||||||||||||||||
Terminations/modifications |
( |
) | ( |
) | — | ( |
) | ( |
) | |||||||||||
Translation adjustments |
( |
) | ( |
) | ( |
) | ( |
) | ( |
) | ||||||||||
|
|
|
|
|
|
|
|
|
|
|||||||||||
Balance as at March 31, 2023 |
$ | $ | — | $ | $ | $ | ||||||||||||||
|
|
|
|
|
|
|
|
|
|
|||||||||||
Net carrying value as at March 31, 2023 |
$ |
$ |
— |
$ |
$ |
$ |
||||||||||||||
|
|
|
|
|
|
|
|
|
|
Lease liabilities |
March 31, 2024 |
March 31, 2023 |
||||||
Opening balance |
$ | $ | ||||||
Cash outflows |
||||||||
Principal payment of lease liabilities |
( |
) | ( |
) | ||||
Interest payment on lease liabilities |
( |
) | ( |
) | ||||
Non-cash adjustments |
||||||||
On acquisition (Refer Note 4(a),4(b),4(d),4(e),4(f) |
— | |||||||
Additions |
||||||||
Terminations/modifications |
||||||||
Interest accrued |
||||||||
Translation adjustments |
( |
) | ( |
) | ||||
|
|
|
|
|||||
Closing balance |
$ |
$ |
||||||
|
|
|
|
As at |
||||||||
Tenure |
March 31, 2024 |
March 31, 2023 |
||||||
Less than 1 year |
$ | $ | ||||||
1-3 years |
||||||||
3-5 years |
||||||||
More than 5 years |
||||||||
|
|
|
|
|||||
Total |
$ |
$ |
||||||
|
|
|
|
Final maturity (financial year) |
As at |
|||||||||||||||
Currency |
Interest rate |
March 31, 2024 |
March 31, 2023 |
|||||||||||||
US dollars |
% | |||||||||||||||
Sterling Pound |
% | |||||||||||||||
|
|
|
|
|||||||||||||
Total |
||||||||||||||||
Less: Debt issuance cost |
( |
( |
) | |||||||||||||
Total |
||||||||||||||||
|
|
|
|
|||||||||||||
Current portion of long-term debt |
$ | $ | ||||||||||||||
Long-term debt |
$ | $ |
Financial assets at amortized cost |
Financial assets at FVTPL |
Financial assets at FVOCI |
Total carrying value |
Total fair value |
||||||||||||||||
Cash and cash equivalents |
$ | $ | — | $ | — | $ | $ | |||||||||||||
Investment in fixed deposits |
— | — | ||||||||||||||||||
Investments in mutual funds |
— | — | ||||||||||||||||||
Trade receivables |
— | — | ||||||||||||||||||
Unbilled revenue (1) |
— | — | ||||||||||||||||||
Funds held for clients |
— | — | ||||||||||||||||||
Prepayments and other assets (2) |
— | — | ||||||||||||||||||
Other non-current assets (3) |
— | — | ||||||||||||||||||
Derivative assets |
— | |||||||||||||||||||
|
|
|
|
|
|
|
|
|
|
|||||||||||
Total carrying value |
$ |
$ |
$ |
$ |
$ |
|||||||||||||||
|
|
|
|
|
|
|
|
|
|
Financial liabilities at amortized cost |
Financial liabilities at FVTPL |
Financial liabilities at FVOCI |
Total carrying value |
Total fair Value |
||||||||||||||||
Trade payables |
$ | $ | — | $ | — | $ | $ | |||||||||||||
Long-term debt (includes current portion) (4) |
— | — | ||||||||||||||||||
Short term line of credit |
— | — | ||||||||||||||||||
Other employee obligations (5) |
— | — | ||||||||||||||||||
Provisions and accrued expenses |
— | — | ||||||||||||||||||
Lease liabilities |
— | — | ||||||||||||||||||
Other liabilities (6) |
— | |||||||||||||||||||
Derivative liabilities |
— | |||||||||||||||||||
|
|
|
|
|
|
|
|
|
|
|||||||||||
Total carrying value |
$ |
$ |
$ |
$ |
$ |
|||||||||||||||
|
|
|
|
|
|
|
|
|
|
(1) | Excluding non-financial assets $ |
(2) | Excluding non-financial assets $ |
(3) | Excluding non-financial assets $ |
(4) | Excluding non-financial asset (unamortized debt issuance cost) $ |
(5) | Excluding non-financial liabilities $ |
(6) | Excluding non-financial liabilities $ |
Financial assets at amortized cost |
Financial assets at FVTPL |
Financial assets at FVOCI |
Total carrying value |
Total fair value |
||||||||||||||||
Cash and cash equivalents |
$ | $ | — | $ | — | $ | $ | |||||||||||||
Investment in fixed deposits |
— | — | ||||||||||||||||||
Investments in mutual funds |
— | — | ||||||||||||||||||
Trade receivables |
— | — | ||||||||||||||||||
Unbilled revenue (1) |
— | — | ||||||||||||||||||
Funds held for clients |
— | — | ||||||||||||||||||
Prepayments and other assets (2) |
— | — | ||||||||||||||||||
Other non-current assets (3) |
— | — | ||||||||||||||||||
Derivative assets |
— | |||||||||||||||||||
Total carrying value |
$ |
$ |
$ |
$ |
$ |
|||||||||||||||
Financial liabilities at amortized cost |
Financial liabilities at FVTPL |
Financial liabilities at FVOCI |
Total carrying value |
Total fair Value |
||||||||||||||||
Trade payables |
$ | $ | — | $ | — | $ | $ | |||||||||||||
Long-term debt (includes current portion) (4) |
— | — | ||||||||||||||||||
Other employee obligations (5) |
— | — | ||||||||||||||||||
Provisions and accrued expenses |
— | — | ||||||||||||||||||
Lease liabilities |
— | — | ||||||||||||||||||
Other liabilities (6) |
— | |||||||||||||||||||
Derivative liabilities |
— | |||||||||||||||||||
Total carrying value |
$ |
$ |
$ |
$ |
$ |
|||||||||||||||
(1) | Excluding non-financial assets $ |
(2) | Excluding non-financial assets $ |
(3) | Excluding non-financial assets $ |
(4) | Excluding non-financial asset (unamortized debt issuance cost) $ |
(5) | Excluding non-financial liabilities $ |
(6) | Excluding non-financial liabilities $ |
Description of types of financial assets |
Gross amounts of recognized financial assets |
Gross amounts of recognized financial liabilities offset in the statement of financial position |
Net amounts of financial assets presented in the statement of financial position |
Related amount not set off in financial instruments |
Net Amount |
|||||||||||||||||||
Financial Instruments |
Cash collateral received |
|||||||||||||||||||||||
Derivative assets |
$ | $ | — | $ | $ | ( |
) | $ | — | $ | ||||||||||||||
Total |
$ |
$ |
— |
$ |
$ |
( |
) |
$ |
— |
$ |
||||||||||||||
Description of types of financial liabilities |
Gross amounts of recognized financial liabilities |
Gross amounts of recognized financial assets offset in the statement of financial position |
Net amounts of financial liabilities presented in the statement of financial position |
Related amount not set off in financial instruments |
Net Amount |
|||||||||||||||||||
Financial instruments |
Cash collateral pledged |
|||||||||||||||||||||||
Derivative liabilities |
$ | $ | — | $ | $ | ( |
) | $ | — | $ | ||||||||||||||
Total |
$ |
$ |
— |
$ |
$ |
( |
) |
$ |
— |
$ |
||||||||||||||
Description of types of financial assets |
Gross amounts of recognized financial assets |
Gross amounts of recognized financial liabilities offset in the statement of financial position |
Net amounts of financial assets presented in the statement of financial position |
Related amount not set off in financial instruments |
Net Amount |
|||||||||||||||||||
Financial Instruments |
Cash collateral received |
|||||||||||||||||||||||
Derivative assets |
$ | $ | — | $ | $ | ( |
) | $ | — | $ | ||||||||||||||
|
|
|
|
|
|
|
|
|
|
|
|
|||||||||||||
Total |
$ |
$ |
— |
$ |
$ |
( |
) |
$ |
— |
$ |
||||||||||||||
|
|
|
|
|
|
|
|
|
|
|
|
|||||||||||||
Description of types of financial liabilities |
Gross amounts of recognized financial liabilities |
Gross amounts of recognized financial assets offset in the statement of financial position |
Net amounts of financial liabilities presented in the statement of financial position |
Related amount not set off in financial instruments |
Net Amount |
|||||||||||||||||||
Financial instruments |
Cash collateral pledged |
|||||||||||||||||||||||
Derivative liabilities |
$ | $ | — | $ | $ | ( |
) | $ | — | $ | ||||||||||||||
|
|
|
|
|
|
|
|
|
|
|
|
|||||||||||||
Total |
$ |
$ |
— |
$ |
$ |
( |
) |
$ |
— |
$ |
||||||||||||||
|
|
|
|
|
|
|
|
|
|
|
|
Fair value measurement at reporting date using |
||||||||||||||||
Description |
March 31, 2024 |
Quoted prices in active markets for identical assets (Level 1) |
Significant other observable inputs (Level 2) |
Significant unobservable inputs (Level 3) |
||||||||||||
Assets |
||||||||||||||||
Financial assets at FVTPL |
||||||||||||||||
Foreign exchange contracts |
$ | $ | — | $ | $ | — | ||||||||||
Investments in mutual funds |
— | |||||||||||||||
Financial assets at FVOCI |
||||||||||||||||
Foreign exchange contracts |
— | — | ||||||||||||||
|
|
|
|
|
|
|
|
|||||||||
Total assets |
$ |
$ |
$ |
$ |
— |
|||||||||||
|
|
|
|
|
|
|
|
|||||||||
Liabilities |
||||||||||||||||
Financial liabilities at FVTPL |
||||||||||||||||
Foreign exchange contracts |
$ | $ | — | $ | $ | — | ||||||||||
Contingent consideration |
— | — | ||||||||||||||
Financial liabilities at FVOCI |
||||||||||||||||
Foreign exchange contracts |
— | — | ||||||||||||||
|
|
|
|
|
|
|
|
|||||||||
Total liabilities |
$ |
$ |
— |
$ |
$ |
|||||||||||
|
|
|
|
|
|
|
|
Fair value measurement at reporting date using |
||||||||||||||||
Description |
March 31, 2023 |
Quoted prices in active markets for identical assets (Level 1) |
Significant other observable inputs (Level 2) |
Significant unobservable inputs (Level 3) |
||||||||||||
Assets |
||||||||||||||||
Financial assets at FVTPL |
||||||||||||||||
Foreign exchange contracts |
$ | $ | — | $ | $ | — | ||||||||||
Investments in mutual funds |
— | |||||||||||||||
Financial assets at FVOCI |
||||||||||||||||
Foreign exchange contracts |
— | — | ||||||||||||||
|
|
|
|
|
|
|
|
|||||||||
Total assets |
$ |
$ |
$ |
$ |
— |
|||||||||||
|
|
|
|
|
|
|
|
|||||||||
Liabilities |
||||||||||||||||
Financial liabilities at FVTPL |
||||||||||||||||
Foreign exchange contracts |
$ | $ | — | $ | $ | — | ||||||||||
Contingent consideration |
— | — | ||||||||||||||
Financial liabilities at FVOCI |
||||||||||||||||
Foreign exchange contracts |
— | — | ||||||||||||||
|
|
|
|
|
|
|
|
|||||||||
Total liabilities |
$ |
$ |
— |
$ |
$ |
|||||||||||
|
|
|
|
|
|
|
|
For the year ended |
||||||||
March 31, 2024 |
March 31, 2023 |
|||||||
Balance at the beginning of the year |
$ | $ | ||||||
On acqusitions (Refer Note 4(a), 4(b), 4(d)) |
||||||||
Payable upon achievement of target (Refer Note 4(b)) |
( |
) | ||||||
Finance expense recognized in the consolidated statement of income |
||||||||
Gain recognised in the consolidated statement of income (Refer Note 4(a), 4(d)) |
( |
) | ||||||
Translation |
( |
) | ||||||
|
|
|
|
|||||
Balance at the end of the year |
$ |
$ |
||||||
|
|
|
|
As at |
||||||||
March 31, 2024 |
March 31, 2023 |
|||||||
Forward contracts (Sell) |
||||||||
In US dollars |
$ | $ | ||||||
In Pound Sterling |
||||||||
In Euro |
||||||||
In Australian dollars |
||||||||
Others |
||||||||
|
|
|
|
|||||
$ |
$ |
|||||||
|
|
|
|
|||||
Option contracts (Sell) |
||||||||
In US dollars |
$ | $ | ||||||
In Pound Sterling |
||||||||
In Euro |
||||||||
In Australian dollars |
||||||||
|
|
|
|
|||||
$ |
$ |
|||||||
|
|
|
|
Year ended March 31, |
||||||||||||
2024 |
2023 |
2022 |
||||||||||
Revenue |
$ | ( |
) | $ | ( |
) | $ | |||||
Foreign exchange gain/(loss), net |
— | — | ||||||||||
Finance expense |
— | — | ( |
) | ||||||||
Income tax related to amounts reclassified into consolidated statement of income |
( |
) | ( |
) | ||||||||
|
|
|
|
|
|
|||||||
Total |
$ |
( |
) |
$ |
( |
) |
$ |
|||||
|
|
|
|
|
|
As at March 31, 2024 |
||||||||||||||||||||||||||||
US Dollar |
Pound Sterling |
Indian Rupees |
Australian Dollar |
Euro |
Other currencies |
Total |
||||||||||||||||||||||
Cash and cash equivalents |
$ | $ | $ | $ | $ | $ | $ | |||||||||||||||||||||
Trade receivables |
||||||||||||||||||||||||||||
Unbilled revenue |
— | |||||||||||||||||||||||||||
Prepayments and other current assets |
||||||||||||||||||||||||||||
Other non-current assets |
— | — | — | |||||||||||||||||||||||||
Trade payables |
( |
) | ( |
) | ( |
) | — | ( |
) | ( |
) | ( |
) | |||||||||||||||
Provisions and accrued expenses |
( |
) | ( |
) | ( |
) | ( |
) | ( |
) | ( |
) | ( |
) | ||||||||||||||
Pension and other employee obligations |
( |
) | ( |
) | — | — | ( |
) | ( |
) | ( |
) | ||||||||||||||||
Lease liabilities |
— | — | — | — | ( |
) | ( |
) | ( |
) | ||||||||||||||||||
Other liabilities |
( |
) | ( |
) | — | — | ( |
) | ( |
) | ||||||||||||||||||
Non-current liabilities |
( |
) | — | — | — | — | ( |
) | ||||||||||||||||||||
|
|
|
|
|
|
|
|
|
|
|
|
|
|
|||||||||||||||
Net assets/ (liabilities) |
$ |
$ |
( |
) |
$ |
( |
) |
$ |
$ |
( |
) |
$ |
$ |
|||||||||||||||
|
|
|
|
|
|
|
|
|
|
|
|
|
|
As at March 31, 2023 |
||||||||||||||||||||||||||||
US Dollar |
Pound Sterling |
Indian Rupees |
Australian Dollar |
Euro |
Other Currencies |
Total |
||||||||||||||||||||||
Cash and cash equivalents |
$ | $ | $ | — | $ | $ | $ | $ | ||||||||||||||||||||
Trade receivables |
||||||||||||||||||||||||||||
Unbilled revenue |
— | — | ||||||||||||||||||||||||||
Prepayments and other current assets |
||||||||||||||||||||||||||||
Other non-current assets |
— | — | — | — | ||||||||||||||||||||||||
Trade payables |
( |
) | ( |
) | ( |
) | — | ( |
) | ( |
) | ( |
) | |||||||||||||||
Provisions and accrued expenses |
( |
) | ( |
) | ( |
) | ( |
) | ( |
) | ( |
) | ( |
) | ||||||||||||||
Pension and other employee obligations |
( |
) | ( |
) | — | — | ( |
) | ( |
) | ( |
) | ||||||||||||||||
Lease liabilities |
— | — | — | — | ( |
) | ( |
) | ( |
) | ||||||||||||||||||
Other liabilities |
( |
) | ( |
) | — | — | ( |
) | ( |
) | ( |
) | ||||||||||||||||
Non-current liabilities |
( |
) | — | — | — | ( |
) | — | ( |
) | ||||||||||||||||||
|
|
|
|
|
|
|
|
|
|
|
|
|
|
|||||||||||||||
Net assets/ (liabilities) |
$ |
$ |
( |
) |
$ |
( |
) |
$ |
$ |
( |
) |
$ |
$ |
|||||||||||||||
|
|
|
|
|
|
|
|
|
|
|
|
|
|
Year ended March 31, |
||||||||||||
2024 |
2023 |
2022 |
||||||||||
Revenue from top customer |
% | % | % | |||||||||
Revenue from top five customers |
% | % | % |
As at March 31, 2024 |
||||||||||||||||
Less than 1 Year |
1-2 years |
2-5 years |
Total |
|||||||||||||
Trade payables |
$ | $ | — | $ | — | $ | ||||||||||
Long-term debt (includes current portion) (1) |
||||||||||||||||
Short term line of credit |
— | — | ||||||||||||||
Provisions and accrued expenses |
— | — | ||||||||||||||
Other liabilities |
||||||||||||||||
Other employee obligations |
— | — | ||||||||||||||
Derivative financial instruments |
— | |||||||||||||||
|
|
|
|
|
|
|
|
|||||||||
Total (2) (3) |
$ |
$ |
$ |
$ |
||||||||||||
|
|
|
|
|
|
|
|
(1) | Before netting off debt issuance cost of $ |
(2) | For contractual maturities of lease liabilities refer note 12. |
(3) | Non-financial liabilities are explained in the financial instruments categories table above. |
As at March 31, 2023 |
||||||||||||||||
Less than 1 Year |
1-2 years |
2-5 years |
Total |
|||||||||||||
Trade payables |
$ | $ | — | $ | — | $ | ||||||||||
Long-term debt (includes current portion) (1) |
||||||||||||||||
Provisions and accrued expenses |
— | — | ||||||||||||||
Other liabilities |
||||||||||||||||
Other employee obligations |
— | — | ||||||||||||||
Derivative financial instruments |
— | |||||||||||||||
|
|
|
|
|
|
|
|
|||||||||
Total (2) (3) |
$ |
$ |
$ |
$ |
||||||||||||
|
|
|
|
|
|
|
|
(1) | Before netting off debt issuance cost of $ |
(2) | For contractual maturities of lease liabilities refer note 12. |
(3) |
Non-financial liabilities are explained in the financial instruments categories table above. |
As at |
||||||||
March 31, 2024 |
March 31, 2023 |
|||||||
Cash and cash equivalents |
$ | $ | ||||||
Investments |
||||||||
Short term line of credit |
( |
) | — | |||||
Long-term debt (includes current portion) (1) |
( |
) | ( |
) | ||||
|
|
|
|
|||||
Net cash position |
$ |
$ |
||||||
|
|
|
|
(1) | Before netting off debt issuance cost of $ |
As at |
||||||||
March 31, 2024 |
March 31, 2023 |
|||||||
Current: |
||||||||
Salaries and bonus |
$ | $ | ||||||
Pension |
||||||||
Withholding taxes on salary and statutory payables |
||||||||
Total |
$ |
$ |
||||||
Non-current: |
||||||||
Pension and other obligations |
$ | $ | ||||||
Total |
$ |
$ |
||||||
Year ended March 31, |
||||||||||||
2024 |
2023 |
2022 |
||||||||||
Salaries and bonus |
$ | $ | $ | |||||||||
Employee benefit plans: |
||||||||||||
Defined contribution plan |
||||||||||||
Defined benefit plan |
||||||||||||
Share-based compensation expense (Refer Note 24) |
||||||||||||
Total |
$ |
$ |
$ |
|||||||||
Year ended March 31, |
||||||||||||
2024 |
2023 |
2022 |
||||||||||
Cost of revenue |
$ | $ | $ | |||||||||
Selling and marketing expenses |
||||||||||||
General and administrative expenses |
||||||||||||
Total |
$ |
$ |
$ |
|||||||||
Year ended March 31, |
||||||||||||
2024 |
2023 |
2022 |
||||||||||
India |
$ | $ | $ | |||||||||
United States |
||||||||||||
United Kingdom |
||||||||||||
South Africa |
||||||||||||
Sri Lanka |
||||||||||||
Philippines |
||||||||||||
Total |
$ |
$ |
$ |
|||||||||
Year ended March 31, |
||||||||||||
2024 |
2023 |
2022 |
||||||||||
Service cost |
$ | $ | $ | |||||||||
Interest on the net defined benefit liability |
||||||||||||
Net gratuity cost |
$ |
$ |
$ |
|||||||||
As at |
||||||||
March 2024 |
March 2023 |
|||||||
Change in projected benefit obligations |
||||||||
Obligation at beginning of the year |
$ | $ | ||||||
Service cost |
||||||||
Interest cost |
||||||||
Benefits paid |
( |
) | ( |
) | ||||
Business combinations |
||||||||
Actuarial (gain)/loss |
||||||||
From changes in demographic assumptions |
( |
) | ||||||
From changes in financial assumptions |
( |
) | ||||||
From actual experience compared to assumptions |
||||||||
Foreign currency translation |
( |
) | ( |
) | ||||
Benefit obligation at end of the year |
$ |
$ |
||||||
Change in plan assets |
||||||||
Plan assets at beginning of the year |
$ | $ | ||||||
Expected return on plan assets |
||||||||
Actual contributions |
||||||||
Benefits paid |
( |
) | ( |
) | ||||
Business combinations |
||||||||
Actuarial (loss)/gain |
( |
) | ||||||
Foreign currency translation |
( |
) | ( |
) | ||||
Plan assets at end of the year |
$ |
$ |
||||||
Accrued pension liability |
||||||||
Current |
$ | $ | ||||||
Non-current |
||||||||
Net amount recognized |
$ |
$ |
||||||
Present value of funded defined benefit obligation |
$ | $ | ||||||
Fair value of plan assets |
( |
) |
( |
) | ||||
Present value of unfunded defined benefit obligation |
$ | $ | ||||||
Weighted average duration of defined benefit obligation (both funded and unfunded) |
Year ended March 31, |
||||||||||||
2024 |
2023 |
2022 |
||||||||||
Discount rate: |
||||||||||||
India |
||||||||||||
Philippines |
||||||||||||
Sri Lanka |
||||||||||||
Dubai |
— | — | ||||||||||
Rate of increase in compensation level |
||||||||||||
Expected rate of return on plan assets |
India |
Philippines |
Sri Lanka |
Dubai |
|||||||||||||
Discount rate: |
||||||||||||||||
Increase in discount rate by 1% |
( |
)% | ( |
)% | ( |
)% | ( |
)% | ||||||||
Decrease in discount rate by 1% |
% | % | % | % | ||||||||||||
Rate of increase in compensation level: |
||||||||||||||||
Increase in salary escalation rate by 1% |
% | % | % | % | ||||||||||||
Decrease in salary escalation rate by 1% |
( |
)% | ( |
)% | ( |
)% | ( |
)% |
Amount |
||||
2025 |
$ | |||
2026 |
||||
2027 |
||||
2028 |
||||
2029 |
||||
Thereafter |
||||
|
|
|||
$ |
||||
|
|
As at |
||||||||
March 31, 2024 |
March 31, 2023 |
|||||||
Accrued expenses |
||||||||
|
|
|
|
|||||
Total |
$ |
$ |
||||||
|
|
|
|
As at |
||||||||
March 31, 2024 |
March 31, 2023 |
|||||||
Current: |
||||||||
Payments in advance of services |
$ | $ | ||||||
Advance billings |
||||||||
Others |
||||||||
|
|
|
|
|||||
Total |
$ |
$ |
||||||
|
|
|
|
|||||
Non-current: |
||||||||
Payments in advance of services |
$ | $ | ||||||
Advance billings |
||||||||
Others |
||||||||
|
|
|
|
|||||
Total |
$ |
$ |
||||||
|
|
|
|
As at |
||||||||
March 31, 2024 |
March 31, 2023 |
|||||||
Current: |
||||||||
Withholding taxes and value added tax payables |
$ | $ | ||||||
Contingent consideration (Refer Note 4(a), 4(b) & 4(d)) |
||||||||
Other liabilities |
||||||||
Total |
$ |
$ |
||||||
Non-current: |
||||||||
Contingent consideration (Refer Note 4(a), 4(b) & 4(d)) |
||||||||
Other liabilities |
||||||||
Total |
$ |
$ |
||||||
Year ended March 31, |
||||||||||||
2024 |
2023 |
2022 |
||||||||||
Industry-specific |
$ | $ | $ | |||||||||
Finance and accounting |
||||||||||||
Customer experience services |
||||||||||||
Research and analytics |
||||||||||||
Others |
||||||||||||
Total |
$ |
$ |
$ |
|||||||||
Year ended March 31, |
||||||||||||
2024 |
2023 |
2022 |
||||||||||
Insurance |
$ | $ | $ | |||||||||
Healthcare |
||||||||||||
Diversified businesses including manufacturing, retail, CPG, media and entertainment, and telecom |
||||||||||||
Travel and leisure |
||||||||||||
Shipping and logistics |
||||||||||||
Hi-tech and professional services |
||||||||||||
Banking and financial services |
||||||||||||
Utilities |
||||||||||||
Total |
$ |
$ |
$ |
|||||||||
Year ended March 31, |
||||||||||||
2024 |
2023 |
2022 |
||||||||||
Full-time-equivalent |
$ | $ | $ | |||||||||
Transaction |
||||||||||||
Subscription |
||||||||||||
Fixed price |
||||||||||||
Others |
||||||||||||
Total |
$ |
$ |
$ |
|||||||||
Year ended March 31, |
||||||||||||
2024 |
2023 |
2022 |
||||||||||
India |
$ | $ | $ | |||||||||
United States |
||||||||||||
Philippines |
||||||||||||
UK (1) |
||||||||||||
South Africa |
||||||||||||
Sri Lanka |
||||||||||||
China |
||||||||||||
Romania |
||||||||||||
Spain |
||||||||||||
Poland |
||||||||||||
Costa Rica |
||||||||||||
Australia |
||||||||||||
Malaysia |
||||||||||||
|
|
|
|
|
|
|||||||
Total |
$ |
$ |
$ |
|||||||||
|
|
|
|
|
|
(1) | Includes revenue derived from Germany, which is not significant. |
As at |
||||||||||||||||
March 31, 2024 |
||||||||||||||||
Sales Commission |
Transition activities |
Upfront payment / Others |
Total |
|||||||||||||
Opening balance |
$ | $ | $ | $ | ||||||||||||
Additions during the year |
||||||||||||||||
Amortization/recognition during the year |
( |
) | ( |
) | ( |
) | ( |
) | ||||||||
Impairment loss recognized during the year |
( |
) | ( |
) | ||||||||||||
Translation adjustments |
( |
) | ( |
) | ||||||||||||
|
|
|
|
|
|
|
|
|||||||||
Closing balance |
$ |
$ |
$ |
$ |
||||||||||||
|
|
|
|
|
|
|
|
As at |
||||||||||||||||
March 31, 2023 |
||||||||||||||||
Sales Commission |
Transition activities |
Upfront payment / Others |
Total |
|||||||||||||
Opening balance |
$ | $ | $ | $ | ||||||||||||
Additions during the year |
||||||||||||||||
Amortization/recognition during the year |
( |
) | ( |
) | ( |
) | ( |
) | ||||||||
Impairment loss recognized during the year |
( |
) | ( |
) | ||||||||||||
Translation adjustments |
( |
) | ( |
) | ( |
) | ( |
) | ||||||||
|
|
|
|
|
|
|
|
|||||||||
Closing balance |
$ |
$ |
$ |
$ |
||||||||||||
|
|
|
|
|
|
|
|
As at |
||||||||
March 31, 2024 |
March 31, 2023 |
|||||||
Contract liabilities: |
||||||||
Payments in advance of services |
$ | $ | ||||||
Advance billings |
||||||||
Others |
||||||||
|
|
|
|
|||||
Total |
$ |
$ |
||||||
|
|
|
|
As at |
||||||||
March 31, 2024 |
March 31, 2023 |
|||||||
Payments in advance of services |
$ | $ | ||||||
Advance billings |
||||||||
Others |
||||||||
|
|
|
|
|||||
Total |
$ |
$ |
||||||
|
|
|
|
As at March 31, 2024 |
||||||||||||||||||||
Less than 1 Year |
1-2 years |
2-5 years |
More than 5 years |
Total |
||||||||||||||||
Transaction price allocated to remaining performance obligations |
$ | $ | $ | $ | $ | |||||||||||||||
As at March 31, 2023 |
||||||||||||||||||||
Less than 1 Year |
1-2 years |
2-5 years |
More than 5 years |
Total |
||||||||||||||||
Transaction price allocated to remaining performance obligations |
$ | $ | $ | $ | $ |
(i) | contracts with an original expected length of one year or less; and |
(ii) | contracts for which the Company recognizes revenue at the amount to which the Company has the right to invoice for services performed. |
Year ended March 31, |
||||||||||||
2024 |
2023 |
2022 |
||||||||||
Employee cost |
$ | $ | $ | |||||||||
Repair payments |
||||||||||||
Facilities cost |
||||||||||||
Depreciation |
||||||||||||
Legal and professional expenses |
||||||||||||
Travel expenses |
||||||||||||
Others |
||||||||||||
|
|
|
|
|
|
|||||||
Total cost of revenue, selling and marketing and general and administrative expenses |
$ |
$ |
$ |
|||||||||
|
|
|
|
|
|
Year ended March 31, |
||||||||||||
2024 |
2023 |
2022 |
||||||||||
Interest expense on lease liabilities |
$ | $ | $ | |||||||||
Interest expense |
||||||||||||
Loss on interest rate swaps |
||||||||||||
|
|
|
|
|
|
|||||||
Total |
$ |
$ |
$ |
|||||||||
|
|
|
|
|
|
Year ended March 31, |
||||||||||||
2024 |
2023 |
2022 |
||||||||||
Net gain arising on financial assets designated as FVTPL |
$ | $ | $ | |||||||||
Interest income |
||||||||||||
Changes in FV of contingent consideration |
— | — | ||||||||||
Others, net |
||||||||||||
|
|
|
|
|
|
|||||||
Total |
$ |
$ |
$ |
|||||||||
|
|
|
|
|
|
Year ended March 31, |
||||||||||||
2024 |
2023 |
2022 |
||||||||||
Share-based compensation expense recorded in: |
||||||||||||
Cost of revenue |
$ | $ | $ | |||||||||
Selling and marketing expenses |
||||||||||||
General and administrative expenses |
||||||||||||
|
|
|
|
|
|
|||||||
Total share-based compensation expense |
$ |
$ |
$ |
|||||||||
|
|
|
|
|
|
(i) | Movements in the number of RSUs dependent on non-market performance condition outstanding under the 2006 Incentive Award Plan and the 2016 Incentive Award Plan and their related weighted average fair values are as follow: |
Shares |
Weighted average fair value |
Aggregate intrinsic value |
||||||||||
Outstanding as at March 31, 2022 |
$ | $ | ||||||||||
Granted |
||||||||||||
Exercised |
( |
) | ||||||||||
Forfeited |
( |
) | ||||||||||
Outstanding as at March 31, 2023 |
$ | $ | ||||||||||
Granted |
||||||||||||
Exercised |
( |
) | ||||||||||
Forfeited |
( |
) | ||||||||||
Outstanding as at March 31, 2024 |
$ | $ | ||||||||||
RSUs exercisable |
$ | $ |
(ii) | The 2006 Incentive Award Plan and the 2016 Incentive Award Plan also allow for the grant of RSUs based on the market price of the Company’s shares achieving a specified target over a period of time. The fair value of market-based share awards is determined using Monte-Carlo simulation. |
Shares |
Weighted average fair value |
Aggregate intrinsic value |
||||||||||
Outstanding as at March 31, 2022 |
$ | $ | ||||||||||
Exercised |
( |
) | — | |||||||||
Outstanding as at March 31, 2023 |
$ | |||||||||||
Exercised |
( |
) | $ | — | ||||||||
Outstanding as at March 31, 2024 |
$ | |||||||||||
RSUs exercisable |
$ | $ |
(iii) |
RSUs related to total shareholder’s return (“TSR”). |
Shares |
Weighted Average fair value |
Aggregate Intrinsic value |
||||||||||
Outstanding as at March 31, 2022 |
$ | $ | ||||||||||
Granted |
||||||||||||
Exercised |
( |
) | ||||||||||
Forfeited |
( |
) | ||||||||||
Lapsed |
( |
) | ||||||||||
Outstanding as at March 31, 2023 |
||||||||||||
Granted |
||||||||||||
Exercised |
( |
) | ||||||||||
Forfeited |
( |
) | ||||||||||
Lapsed |
||||||||||||
Outstanding as at March 31, 2024 |
||||||||||||
RSUs exercisable |
$ | $ |
Shares |
Weighted average fair value |
Aggregate intrinsic value |
||||||||||
Outstanding as at March 31, 2022 |
$ | $ | ||||||||||
Granted |
||||||||||||
Exercised |
( |
) | ||||||||||
Forfeited |
( |
) | ||||||||||
Outstanding as at March 31, 2023 |
$ | $ | ||||||||||
Granted |
||||||||||||
Exercised |
( |
) | ||||||||||
Forfeited |
( |
) | ||||||||||
Outstanding as at March 31, 2024 |
||||||||||||
PSUs exercisable |
$ | $ |
Year ended March 31, |
||||||||||||
2024 |
2023 |
2022 |
||||||||||
Domestic |
$ | ( |
) | $ | ( |
) | $ | ( |
) | |||
Foreign |
||||||||||||
Profit before income taxes |
$ |
$ |
$ |
|||||||||
Year ended March 31, |
||||||||||||
2024 |
2023 |
2022 |
||||||||||
Current taxes |
||||||||||||
Domestic taxes |
$ | $ | — | $ | — | |||||||
Foreign taxes |
||||||||||||
Deferred taxes |
||||||||||||
Domestic taxes |
— | — | ||||||||||
Foreign taxes |
( |
) | ( |
) | ( |
) | ||||||
( |
) |
( |
) | ( |
) | |||||||
Income tax expense |
$ |
$ |
$ |
|||||||||
Year ended March 31, |
||||||||||||
2024 |
2023 |
2022 |
||||||||||
Current taxes: |
||||||||||||
Excess tax deductions related to share-based payments |
( |
) | ( |
) | ( |
) | ||||||
$ | ( |
) | $ | ( |
) | $ | ( |
) | ||||
Deferred taxes: |
||||||||||||
Excess tax deductions related to share-based payments |
( |
) | ( |
) | ||||||||
$ | $ | ( |
) | $ | ( |
) | ||||||
Total income tax recognized directly in equity |
$ |
$ |
( |
) |
$ |
( |
) | |||||
Year ended March 31, |
||||||||||||
2024 |
2023 |
2022 |
||||||||||
Current taxes |
||||||||||||
Deferred taxes: |
||||||||||||
Unrealized gain/(loss) on cash flow hedging derivatives |
( |
) | ||||||||||
Pension liability |
( |
) | ||||||||||
Total income tax recognized directly in other comprehensive income |
$ |
$ |
( |
) |
$ |
|||||||
Year ended March 31, |
||||||||||||
2024 |
2023 |
2022 |
||||||||||
Profit before income taxes |
$ | $ | $ | |||||||||
Income tax expense at tax rates applicable to individual entities |
||||||||||||
Effect of: |
||||||||||||
Items not deductible for tax |
( |
) | ||||||||||
Exempt income |
( |
) | ( |
) | ( |
) | ||||||
Losses in respect of which deferred tax asset not recognized due to uncertainty and ineligibility to carry forward |
||||||||||||
Recognition of unutilized tax benefits / Unrecognized losses utilized |
( |
) | ( |
) | ( |
|||||||
Temporary difference that will reverse during tax holiday period |
— | — | ||||||||||
Change in tax rate and law |
( |
) | ( |
) | ||||||||
Reversal of d eferred tax liability on intangibles |
( |
) | — | — | ||||||||
State taxes |
||||||||||||
Employment related tax incentive |
( |
) | ( |
( |
) | |||||||
Others, net |
( |
) | ( |
) | ||||||||
Income tax expense |
$ |
$ |
$ |
|||||||||
Opening Balance |
Additions due to acquisition |
Recognized in statement of income |
Recognized in equity |
Recognized in/ Reclassified from other comprehensive income |
Foreign currency translation |
Closing balance |
||||||||||||||||||||||
Deferred tax assets: |
||||||||||||||||||||||||||||
Property and equipment |
$ | $ | $ | $ | — | $ | — | $ | ( |
) | $ | |||||||||||||||||
Net operating loss carry forward |
( |
) | — | — | ( |
) | ||||||||||||||||||||||
Accruals deductible on actual payment |
( |
) | — | ( |
) | |||||||||||||||||||||||
Share-based compensation expense |
— | ( |
) | — | ( |
) | ||||||||||||||||||||||
Others |
— | — | ||||||||||||||||||||||||||
|
|
|
|
|
|
|
|
|
|
|
|
|
|
|||||||||||||||
Total deferred tax assets |
$ |
$ |
( |
) |
$ |
$ |
( |
) |
$ |
$ |
( |
) |
$ |
|||||||||||||||
|
|
|
|
|
|
|
|
|
|
|
|
|
|
|||||||||||||||
Deferred tax liabilities: |
||||||||||||||||||||||||||||
Intangible assets |
|
( |
) | — | — | |||||||||||||||||||||||
Unrealized gain/(loss) on cash flow hedging and investments |
( |
) | — | — | ||||||||||||||||||||||||
Others |
— | — | — | ( |
) | |||||||||||||||||||||||
|
|
|
|
|
|
|
|
|
|
|
|
|
|
|||||||||||||||
Total deferred tax liabilities |
$ |
$ |
$ |
( |
) |
$ |
— |
$ |
$ |
$ |
||||||||||||||||||
|
|
|
|
|
|
|
|
|
|
|
|
|
|
|||||||||||||||
Net deferred tax assets/(liabilities) |
$ |
$ |
( |
) |
$ |
$ |
( |
) |
$ |
( |
) |
$ |
( |
) |
$ |
|||||||||||||
|
|
|
|
|
|
|
|
|
|
|
|
|
|
Opening Balance |
Additions due to acquisition |
Recognized in statement of income |
Recognized in equity |
Recognized in/ Reclassified from other comprehensive income |
Foreign currency translation |
Closing Balance |
||||||||||||||||||||||
Deferred tax assets: |
||||||||||||||||||||||||||||
Property and equipment |
$ | $ | $ | ( |
) | $ | — | $ | — | $ | ( |
) | $ | |||||||||||||||
Net operating loss carry forward |
( |
) | — | — | ( |
) | ||||||||||||||||||||||
Accruals deductible on actual payment |
( |
) | — | ( |
) | ( |
) | |||||||||||||||||||||
Share-based compensation expense |
— | — | ( |
) | ||||||||||||||||||||||||
Others |
( |
) | — | — | ( |
) | ||||||||||||||||||||||
|
|
|
|
|
|
|
|
|
|
|
|
|
|
|||||||||||||||
Total deferred tax assets |
$ |
$ |
$ |
$ |
$ |
( |
) |
$ |
( |
) |
$ |
|||||||||||||||||
|
|
|
|
|
|
|
|
|
|
|
|
|
|
|||||||||||||||
Deferred tax liabilities: |
||||||||||||||||||||||||||||
Intangible assets |
( |
) | — | — | ( |
) | ||||||||||||||||||||||
Unrealized gain/(loss) on cash flow hedging and investments |
— | ( |
) | — | ( |
) | ( |
) | ( |
) | ||||||||||||||||||
Others |
— | ( |
) | — | — | ( |
) | |||||||||||||||||||||
|
|
|
|
|
|
|
|
|
|
|
|
|
|
|||||||||||||||
Total deferred tax liabilities |
$ |
$ |
$ |
( |
) |
$ |
— |
$ |
( |
) |
$ |
( |
) |
$ |
||||||||||||||
|
|
|
|
|
|
|
|
|
|
|
|
|
|
|||||||||||||||
Net deferred tax assets/(liabilities) |
$ |
$ |
( |
) |
$ |
$ |
$ |
$ |
( |
) |
$ |
|||||||||||||||||
|
|
|
|
|
|
|
|
|
|
|
|
|
|
Opening Balance |
Additions due to acquisition |
Recognized in statement of income |
Recognized in equity |
Recognized in/ Reclassified from other comprehensive income |
Foreign currency translation |
Closing Balance |
||||||||||||||||||||||
Deferred tax assets: |
||||||||||||||||||||||||||||
Property and equipment |
$ | $ | $ | $ | — | $ | — | $ | ( |
) | $ | |||||||||||||||||
Net operating loss carry forward |
— | ( |
) | — | — | ( |
) | |||||||||||||||||||||
Accruals deductible on actual payment |
— | ( |
) | ( |
) | |||||||||||||||||||||||
Share-based compensation expense |
— | — | ( |
) | ||||||||||||||||||||||||
Others |
— | ( |
) | — | — | ( |
) | |||||||||||||||||||||
|
|
|
|
|
|
|
|
|
|
|
|
|
|
|||||||||||||||
Total deferred tax assets |
$ |
$ |
$ |
$ |
$ |
( |
) |
$ |
( |
) |
$ |
|||||||||||||||||
|
|
|
|
|
|
|
|
|
|
|
|
|
|
|||||||||||||||
Deferred tax liabilities: |
||||||||||||||||||||||||||||
Intangible assets |
— | — | ( |
) | ||||||||||||||||||||||||
Unrealized gain/(loss) on cash flow hedging and investments |
— | ( |
) | — | ( |
) | ||||||||||||||||||||||
Others |
— | — | — | ( |
) | |||||||||||||||||||||||
|
|
|
|
|
|
|
|
|
|
|
|
|
|
|||||||||||||||
Total deferred tax liabilities |
$ |
$ |
$ |
$ |
— |
$ |
$ |
( |
) |
$ |
||||||||||||||||||
|
|
|
|
|
|
|
|
|
|
|
|
|
|
|||||||||||||||
Net deferred tax assets/(liabilities) |
$ |
$ |
$ |
$ |
$ |
( |
) |
$ |
( |
) |
$ |
|||||||||||||||||
|
|
|
|
|
|
|
|
|
|
|
|
|
|
As at |
||||||||
March 31, 2024 |
March 31, 2023 |
|||||||
Deferred tax assets |
||||||||
Deferred tax liabilities |
( |
) | ( |
) | ||||
|
|
|
|
|||||
Net deferred tax assets |
$ |
$ |
||||||
|
|
|
|
Year ended March 31, |
||||||||||||
2024 |
2023 |
2022 |
||||||||||
Numerator: |
||||||||||||
Profit after tax |
$ | $ | $ | |||||||||
Denominator: |
||||||||||||
Basic weighted average ordinary shares outstanding |
||||||||||||
Dilutive impact of equivalent share-based options and RSUs |
||||||||||||
Basic weighted average ordinary shares outstanding |
Direct subsidiaries |
Step subsidiaries |
Place of incorporation | ||
WNS Global Services Netherlands B.V. |
The Netherlands | |||
WNS Global Services (Romania) S.R.L. | Romania | |||
WNS North America Inc. |
Delaware, USA | |||
WNS Business Consulting Services Private Limited | India | |||
WNS Global Services, LLC (1) |
Delaware, USA | |||
WNS BPO Services Costa Rica, S.R.L. | Costa Rica | |||
Denali Sourcing Services, LLC (1) |
Delaware, USA | |||
WNS Assistance Limited (previously WNS Workflow Technologies Limited) | United Kingdom | |||
WNS Assistance (Legal) Limited | United Kingdom | |||
Accidents Happen Assistance Limited | United Kingdom | |||
WNS Legal Assistance LLP | United Kingdom | |||
WNS (Mauritius) Limited |
Mauritius | |||
WNS Capital Investment Limited | Mauritius | |||
- WNS Customer Solutions (Singapore) Private Limited |
Singapore | |||
- WNS Global Services (Australia) Pty Ltd |
Australia | |||
- WNS New Zealand Limited |
New Zealand | |||
- Business Applications Associates Beijing Ltd |
China | |||
- WNS Global Services Malaysia Sdn. Bhd. (2) |
Malaysia | |||
WNS Global Services Private Limited (3) (4) (5) (16) |
India | |||
- Vuram Technology Solutions Private Limited (5) (16) |
India | |||
- Vuram Australia Pty Ltd (5) |
Australia | |||
- Vuram Canada Inc. (5) |
Canada | |||
- Vuram Technologies B.V. (5) |
The Netherlands | |||
- Vuram, Inc. (5)(6) |
USA | |||
- Soluciones en Tecnología Vuram México, S. De R.L. De C.V (5)(6) |
Mexico | |||
- Vuram UK Private Limited (5) |
United Kingdom | |||
- WNS Business Consulting Netherlands B.V. (13) |
The Netherlands | |||
- WNS Global Services Philippines Inc. (13) |
The Philippines | |||
- WNS Global Services (UK) Limited (7) (10) (11) |
United Kingdom | |||
- WNS Global Services SA (Pty) Limited |
South Africa | |||
- WNS B-BBEE Staff Share Trust (8) |
South Africa | |||
- Ucademy (Pty) Limited |
South Africa | |||
- WNS South Africa (Pty) Limited (9) |
South Africa | |||
- The Smart Cube Limited (10) |
United Kingdom | |||
- Smart Cube India Private Limited |
India | |||
- The Smart Cube S.R.L. |
Romania | |||
- The Smart Cube (Switzerland) GmbH |
Switzerland | |||
- The Smart Cube Inc. |
USA | |||
- The Smart Cube Consulting Services (Dalian) Co. Ltd. |
China | |||
- OptiBuy sp. z o.o. (11) |
Poland | |||
- Nextbuy sp. z o.o. |
Poland | |||
- OptiBuy GmbH |
Germany | |||
- MTS HealthHelp Inc. |
Delaware, USA | |||
- HealthHelp Holdings LLC |
Delaware, USA | |||
- HealthHelp LLC |
Delaware, USA | |||
- WNS-HealthHelp Philippines Inc. |
Philippines | |||
- Value Edge Inc. |
Delaware, USA | |||
- Value Edge AG. |
Switzerland | |||
- VE Value Edge GmbH |
Germany | |||
WNS Global Services (Private) Limited | Sri Lanka | |||
WNS Global Services (Dalian) Co. Ltd. | China | |||
WNS Global Services (UK) International Limited | United Kingdom | |||
- WNS Global Services North Americas Inc. |
Delaware, USA | |||
- WNS Global Services AG (12) |
Switzerland | |||
WNS Gestion des Processus d’Affaire Inc. |
Canada | |||
WNS BPM Americas Holdings Inc. (14) |
Delaware, USA | |||
WNS BPM Americas LLC (15) |
Delaware, USA |
(1) |
Denali Sourcing Services, Inc. and WNS Global Services Inc. were converted into Limited Liability Company with effect from April 1, 2023. |
(2) |
WNS Global Services Malaysia Sdn. Bhd., a wholly-owned subsidiary of WNS Customer Solutions (Singapore) Private Limited, was incorporated on July 21, 2022. |
(3) |
WNS Global Services Private Limited is held jointly by WNS (Mauritius) Limited, WNS Global Services Netherlands B.V. and WNS Customer Solutions (Singapore) Private Limited. The percentage of holding of WNS (Mauritius) Limited is |
(4) |
On August 1, 2021, WNS (Mauritius) Limited acquired all outstanding shares of MOL Information Processing Services (I) Private Limited. The name of the MOL Information Processing Services (I) Private Limited. was changed to WNS Information Services (India) Private Limited with effect from December 1, 2021. |
(5) |
On July 1, 2022, WNS Global Services Private Limited acquired all ownership interests of Vuram Technology Solutions Private Limited, including its subsidiaries that existed on that date. |
(6) |
Soluciones en Tecnología Vuram México, S. De R.L. De C.V is jointly held by Vuram Technology Solutions Private Limited and Vuram, Inc. The percentage of holding of Vuram Technology Solutions Private Limited is |
(7) |
WNS Global Services (UK) Limited is jointly held by WNS Global Services Private Limited and WNS (Holdings) Limited. The percentage of holding of WNS Global Services Private Limited is |
(8) |
The WNS B-BBEE Staff Share Trust (the “trust”) was registered on April 26, 2017 in relation to the grant of share appreciation rights by WNS Global Services SA (Pty) Limited. During the year ended March 31, 2020, the trust subscribed to one participating preference share issued by WNS Global Services SA (Pty) Limited. As at March 31, 2024, the aforementioned one participating preference share entitles the trust to On April 19, 2024, WNS Global Services SA (Pty) Limited redeemed the one participating preference share on account of unwinding of Scheme B of WNS B-BBEE Staff Share Trust. The Company is currently working on a new ownership structure to ensure continued compliance with the requirements of the BBBEE legislation. |
(9) |
WNS South Africa (Pty) Limited (formerly known as “WNS SA Domestic(Pty) Ltd”) was incorporated as a subsidiary of WNS Global Services SA (Pty) Limited on December 19, 2018. The name of the entity was changed to WNS South Africa (Pty) Ltd with effect from September 25, 2019. |
(10) |
On December 16, 2022, WNS Global Services (UK) Limited acquired all ownership interests of The Smart Cube Limited, including its subsidiaries that existed on that date. |
(11) |
On December 16, 2022, WNS Global Services (UK) Limited acquired all ownership interests of OptiBuy sp. z o.o., including its subsidiaries that existed on that date. |
(12) |
WNS Global Services AG, a wholly-owned subsidiary of WNS Global Services (UK) International Limited, was incorporated on July 16, 2021. |
(13) |
WNS Business Consulting Netherlands B.V. was incorporated on March 17, 2020, pursuant to the execution of deed of demerger on March 16, 2020. The shares of WNS Global Services Philippines Inc. were transferred from WNS Global Services Netherlands B.V. to WNS Business Consulting Netherlands B.V. pursuant to the proposal of demerger. As at March 31, 2024, WNS Business Consulting Netherlands B.V. is fully held by WNS Global Services Private Limited, after WNS Global Services Private Limited acquired the remaining ownership interest in WNS Business Consulting Netherlands B.V. earlier held by WNS (Holdings) Limited. |
(14) |
WNS BPM Americas Holdings Inc., a wholly-owned subsidiary of WNS (Holdings) Limited, was incorporated on March 1, 2023 |
(15) |
WNS BPM Americas LLC, a wholly-owned subsidiary of WNS BPM Americas Holdings Inc, was incorporated on March 3, 2023. |
(16) |
On March 30, 2024, WNS Global Services Private Limited and Vuram Technology Solutions Private Limited have filed the Company Scheme Application for Amalgamation of Vuram Technology Solutions Private Limited with WNS Global Services Private Limited with National Company Law Tribunal, Mumbai bench. The appointed date for the Scheme is April |
Key management personnel |
||
Adrian T. Dillon (Ceased to be Chairman from September 20, 2021) | Chairman | |
Timothy L. Main (Appointed on September 21, 2021) | Chairman | |
Keshav R. Murugesh | Director and Group Chief Executive Officer | |
Jason Liberty | Director | |
Swaminathan Rajamani | Chief People Officer | |
Gautam Barai (Resigned on February 15, 2023, effective May 15, 2023) | Chief Operating Officer | |
Sanjay Puria | Group Chief Financial Officer | |
Gareth Williams (Ceased to be Director from December 31, 2022) | Director | |
Michael Menezes (Ceased to be Director from December 31, 2022) | Director | |
John Freeland (Ceased to be Director from August 31, 2023) | Director | |
Françoise Gri | Director | |
Keith Haviland | Director | |
Mario P. Vitale | Director | |
Lan Tu (Appointed on February 4, 2022) | Director | |
Diane de Saint Victor (Appointed on April 1, 2023) | Director | |
Judy Marlinski (Appointed on December 1, 2023) | Director |
Year ended March 31, |
||||||||||||
Nature of transaction with related parties |
2024 |
2023 |
2022 |
|||||||||
Key management personnel* |
||||||||||||
Remuneration and short-term benefits |
$ | $ | $ | |||||||||
Defined contribution plan |
||||||||||||
Other benefits |
||||||||||||
Share-based compensation expense |
* | Defined benefit plan related costs are not disclosed as these are determined for the Company as a whole. |
• | Banking/Financial Services, and Insurance (“BFSI”), |
• | Travel, Shipping/Logistics, and Utilities (“TSLU’’), |
• | Manufacturing/Retail/Consumer, Hi-tech/Professional Services, and Procurement (“MRHP”), and |
• | Healthcare/Life Sciences (“HCLS”) |
TSLU |
MRHP |
HCLS |
BFSI |
Reconciling item (3) |
Total |
|||||||||||||||||||
Revenue from external customers |
||||||||||||||||||||||||
Segment Revenue |
$ | $ | $ | $ | $ | ( |
) | $ | ||||||||||||||||
Payments to repair centers |
— | — | — | — | ||||||||||||||||||||
|
|
|
|
|
|
|
|
|
|
|
|
|||||||||||||
Revenue less repair payments (non-GAAP) |
( |
) | ||||||||||||||||||||||
Adjusted cost of revenue (1) (2) |
||||||||||||||||||||||||
|
|
|
|
|
|
|
|
|
|
|
|
|||||||||||||
Segment gross profit |
( |
) | ||||||||||||||||||||||
Other costs |
||||||||||||||||||||||||
Other income, net |
( |
) | ||||||||||||||||||||||
Finance expense |
||||||||||||||||||||||||
Impairment of intangible assets |
||||||||||||||||||||||||
Amortization of intangible assets |
||||||||||||||||||||||||
Share-based compensation expense |
||||||||||||||||||||||||
Income- tax expense |
||||||||||||||||||||||||
|
|
|||||||||||||||||||||||
Profit after tax |
$ |
|||||||||||||||||||||||
|
|
(1) |
Excludes share-based compensation expense. |
(2) |
Adjusted cost of revenue under reconciling items includes inter and intra segment eliminations and unallocated expenses. |
(3) |
Revenue under reconciling items includes inter and intra segment eliminations and impact of foreign exchange fluctuations. |
TSLU |
MRHP |
HCLS |
BFSI |
Reconciling item (3) |
Total |
|||||||||||||||||||
Revenue from external customers |
||||||||||||||||||||||||
Segment Revenue |
$ | $ | $ | $ | $ | ( |
) | $ | ||||||||||||||||
Payments to repair centers |
— | — | — | — | ||||||||||||||||||||
|
|
|
|
|
|
|
|
|
|
|
|
|||||||||||||
Revenue less repair payments (non-GAAP) |
( |
) | ||||||||||||||||||||||
Adjusted cost of revenue (1) (2) |
( |
) | ||||||||||||||||||||||
|
|
|
|
|
|
|
|
|
|
|
|
|||||||||||||
Segment gross profit |
( |
) | ||||||||||||||||||||||
Other costs |
||||||||||||||||||||||||
Other income, net |
( |
) | ||||||||||||||||||||||
Finance expense |
||||||||||||||||||||||||
Amortization of intangible assets |
||||||||||||||||||||||||
Share-based compensation expense |
||||||||||||||||||||||||
Income- tax expense |
||||||||||||||||||||||||
|
|
|||||||||||||||||||||||
Profit after tax |
$ |
|||||||||||||||||||||||
|
|
(1) |
Excludes share-based compensation expense. |
(2) |
Adjusted cost of revenue under reconciling items includes inter and intra segment eliminations and unallocated expenses. |
(3) |
Revenue under reconciling items includes inter and intra segment eliminations and impact of foreign exchange fluctuations. |
TSLU |
MRHP |
HCLS |
BFSI |
Reconciling item (3) |
Total |
|||||||||||||||||||
Revenue from external customers |
||||||||||||||||||||||||
Segment Revenue |
$ | $ | $ | $ | $ | ( |
) | $ | ||||||||||||||||
Payments to repair centers |
— | — | — | — | ||||||||||||||||||||
|
|
|
|
|
|
|
|
|
|
|
|
|||||||||||||
Revenue less repair payments (non-GAAP) |
( |
) | ||||||||||||||||||||||
Adjusted cost of revenue (1) (2) |
||||||||||||||||||||||||
|
|
|
|
|
|
|
|
|
|
|
|
|||||||||||||
Segment gross profit |
( |
) | ||||||||||||||||||||||
Other costs |
||||||||||||||||||||||||
Other income, net |
( |
) | ||||||||||||||||||||||
Finance expense |
||||||||||||||||||||||||
Amortization of intangible assets |
||||||||||||||||||||||||
Share-based compensation expense |
||||||||||||||||||||||||
Income- tax expense |
||||||||||||||||||||||||
|
|
|||||||||||||||||||||||
Profit after tax |
$ |
|||||||||||||||||||||||
|
|
(1) |
Excludes share-based compensation expense. |
(2) |
Adjusted cost of revenue under reconciling items includes inter and intra segment eliminations and unallocated expenses. |
(3) |
Revenue under reconciling items includes inter and intra segment eliminations and impact of foreign exchange fluctuations. |
Year ended March 31, |
||||||||||||
2024 |
2023 |
2022 |
||||||||||
Jersey, Channel Islands |
$ | $ | $ | |||||||||
North America (primarily the US) |
||||||||||||
UK |
||||||||||||
Australia |
||||||||||||
Europe (excluding the UK) |
||||||||||||
South Africa |
||||||||||||
Rest of the world |
||||||||||||
Total |
$ |
$ |
$ |
|||||||||
As at March 31, |
||||||||
2024 |
2023 |
|||||||
Jersey, Channel Islands |
$ | $ | ||||||
India |
||||||||
Philippines |
||||||||
South Africa |
||||||||
North America |
||||||||
UK |
||||||||
Rest of the world |
||||||||
Total |
$ |
$ |
||||||
As at March 31, |
||||||||||||
2024 |
2023 |
% Change |
||||||||||
Total equity attributable to the equity shareholders of the Company |
$ | $ | ( |
)% | ||||||||
As percentage of total capital |
% | % | ||||||||||
Short term line of credit |
— | % | ||||||||||
Long-term debt (1) |
( |
)% | ||||||||||
Total debt |
$ | $ | % | |||||||||
As percentage of total capital |
|
% | % | |||||||||
Total capital (debt and equity) |
$ |
$ |
( |
)% | ||||||||
(1) | Before netting off debt issuance cost of $ |