ANNUAL REPORT PURSUANT TO SECTION 13 OR 15(d) OF THE SECURITIES EXCHANGE ACT OF 1934 |
TRANSITION REPORT PURSUANT TO SECTION 13 OR 15(d) OF THE SECURITIES EXCHANGE ACT OF 1934 |
(State or other jurisdiction of incorporation or organization) | (I.R.S. Employer Identification No.) |
Title of each class | Trading Symbol(s) | Name of each exchange on which registered |
☒ | Accelerated filer | ☐ | ||||
Non-accelerated filer | ☐ | Smaller reporting company | ||||
Emerging growth company |
Page | ||
ITEM 1. | ||
ITEM 1A. | ||
ITEM 1B. | ||
ITEM 1C. | ||
ITEM 2. | ||
ITEM 3. | ||
ITEM 4. | ||
ITEM 5. | ||
ITEM 6. | ||
ITEM 7. | ||
ITEM 7A. | ||
ITEM 8. | ||
ITEM 9. | ||
ITEM 9A. | ||
ITEM 9B. | ||
ITEM 9C. | ||
ITEM 10. | ||
ITEM 11. | ||
ITEM 12. | ||
ITEM 13. | ||
ITEM 14. | ||
ITEM 15. | ||
ITEM 16. |
AUM(1) | % of Total AUM | Fee-earning AUM | Active Investments | Active Funds(3) | Available Capital | Investment Professionals(2) | Amount Invested Since Inception | Investments Since Inception | ||||||||
$161 | 38% | $107 | 925+ | 75 | $37 | 425 | $225 | 2,550+ |
AUM | % of Total AUM | Fee-earning AUM | Available Capital | Active Funds | Investment Professionals | |||||
$188 | 44% | $155 | $16 | 128 | 205 |
AUM | % of Total AUM | Fee-earning AUM | Fund Vehicles | Available Capital | Investment Professionals | Amount Invested Since Inception | ||||||
$77 | 18% | $46 | 383 | $24 | 93 | $95 |
Global Private Equity1 | $161.3 | Global Credit | $187.8 | |
Corporate Private Equity | $108.1 | Insurance 5 | $80.6 | |
U.S. Buyout (CP) | 52.2 | Liquid Credit | $53.2 | |
Asia Buyout (CAP) | 13.2 | U.S. CLOs | 37.8 | |
Europe Buyout (CEP) | 11.1 | Europe CLOs | 11.5 | |
Carlyle Global Partners (CGP) | 6.7 | Revolving Credit | 2.0 | |
Europe Technology (CETP) | 6.5 | CLO Investment Products | 1.9 | |
Japan Buyout (CJP) | 5.1 | Private Credit | $25.4 | |
U.S. Growth (CP Growth / CEOF) | 3.6 | Opportunistic Credit (CCOF / CSP) | 15.8 | |
Life Sciences (ABV / ACCD) | 2.1 | Direct Lending 6 | 9.6 | |
Asia Growth (CAP Growth / CAGP) | 1.2 | Real Assets Credit | $16.9 | |
Other 2 | 6.3 | Aviation (SASOF / CALF) | 12.1 | |
Infrastructure (CICF) | 3.9 | |||
Real Estate | $27.8 | Other 7 | 0.8 | |
U.S. Real Estate (CRP) | 16.9 | Platform Initiatives | $11.8 | |
Core Plus Real Estate (CPI) | 7.5 | Credit Strategic Solutions | 6.4 | |
International Real Estate (CER) | 3.3 | Carlyle Tactical Private Credit (CTAC) | 3.3 | |
Other Cross-Platform Credit Products | 2.0 | |||
Infrastructure & Natural Resources | $25.4 | Global Investment Solutions | $76.9 | |
NGP Energy 3 | 11.2 | Secondaries and Portfolio Finance (ASF / ASPF) | $30.2 | |
Infrastructure & Renewable Energy 4 | 7.5 | Co-Investments (ACF) | $20.9 | |
International Energy (CIEP) | 6.7 | Primary Investments & Other 8 | $25.8 | |
Period | (a) Total number of shares purchased | (b) Average price paid per share | (c) Total number of shares purchased as part of publicly announced plans or programs | (d) Maximum number (or approximate dollar value) of shares that may yet be purchased under the plans or programs |
(Dollars in millions, except unit and per unit data) | ||||
October 1, 2023 to October 31, 2023 (1) | — | $— | — | $396.8 |
November 1, 2023 to November 30, 2023 (1) | — | $— | — | $396.8 |
December 1, 2023 to December 31, 2023 (1) | — | $— | — | $396.8 |
Total | — | — |
Shares of Common Stock Delivered / Deliverable in August, | |||||||||||||
2021 | 2022 | 2023 | 2024 | 2025 | 2026 | 2027 | |||||||
Date of Agreement: | |||||||||||||
February 1, 2018 | 120,159 | — | — | — | — | — | — | ||||||
February 1, 2019 | 164,391 | 164,393 | — | — | — | — | — | ||||||
February 1, 2020 | 119,760 | 89,821 | 89,820 | — | — | — | — | ||||||
February 1, 2021 | — | 116,559 | 87,419 | 87,418 | — | — | — | ||||||
February 1, 2022 | — | — | 75,290 | 56,467 | 56,467 | — | — | ||||||
February 1, 2023 | — | — | — | 103,432 | 77,574 | 77,573 | — | ||||||
February 1, 2024 | — | — | — | — | 98,918 | 74,188 | 74,187 |
As of December 31, | |||
2023 | 2022 | ||
Consolidated Results | (Dollars in millions) | ||
Components of Fee-earning AUM | |||
Fee-earning AUM based on capital commitments | $71,920 | $81,057 | |
Fee-earning AUM based on invested capital | 69,371 | 60,459 | |
Fee-earning AUM based on collateral balances, at par | 49,999 | 46,173 | |
Fee-earning AUM based on net asset value | 19,537 | 11,979 | |
Fee-earning AUM based on fair value and other | 96,591 | 66,909 | |
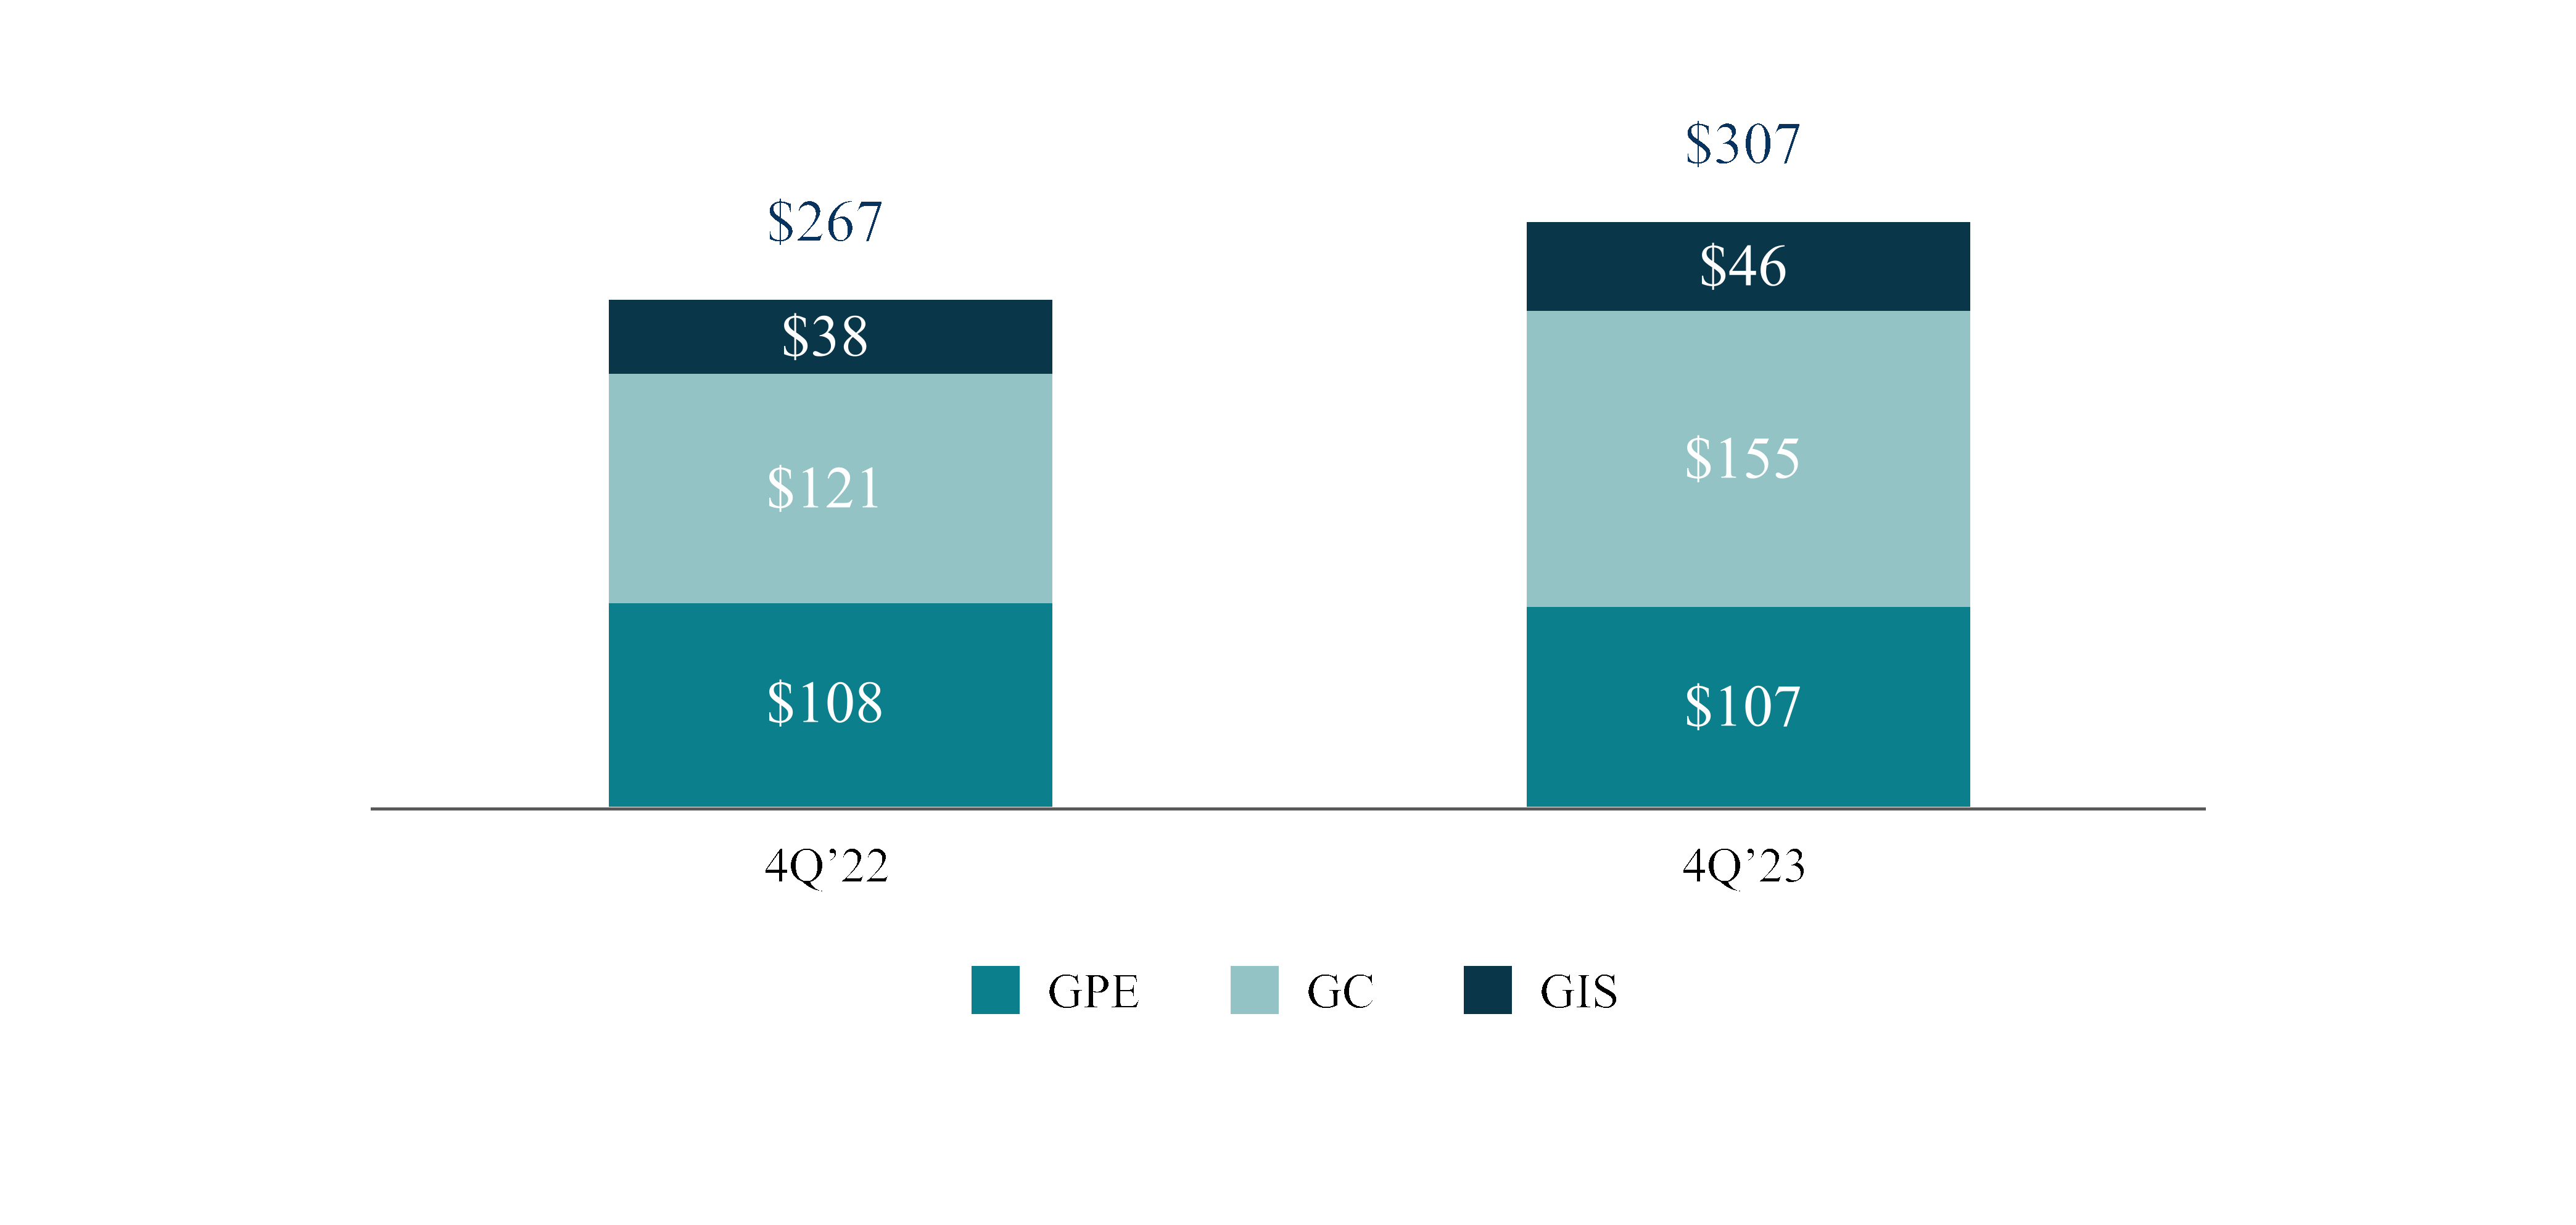
Balance, End of Period(1) | $307,418 | $266,577 |
Year Ended December 31, | |||
2023 | 2022 | ||
Consolidated Results | (Dollars in millions) | ||
Fee-earning AUM Rollforward | |||
Balance, Beginning of Period | $266,577 | $193,419 | |
Inflows(1) | 55,531 | 95,534 | |
Outflows (including realizations)(2) | (18,329) | (18,431) | |
Market Activity & Other(3) | 2,873 | (505) | |
Foreign Exchange(4) | 766 | (3,440) | |
Balance, End of Period | $307,418 | $266,577 |
Year Ended December 31, | |||
2023 | 2022 | ||
(Dollars in millions) | |||
Consolidated Results | |||
Total AUM Rollforward | |||
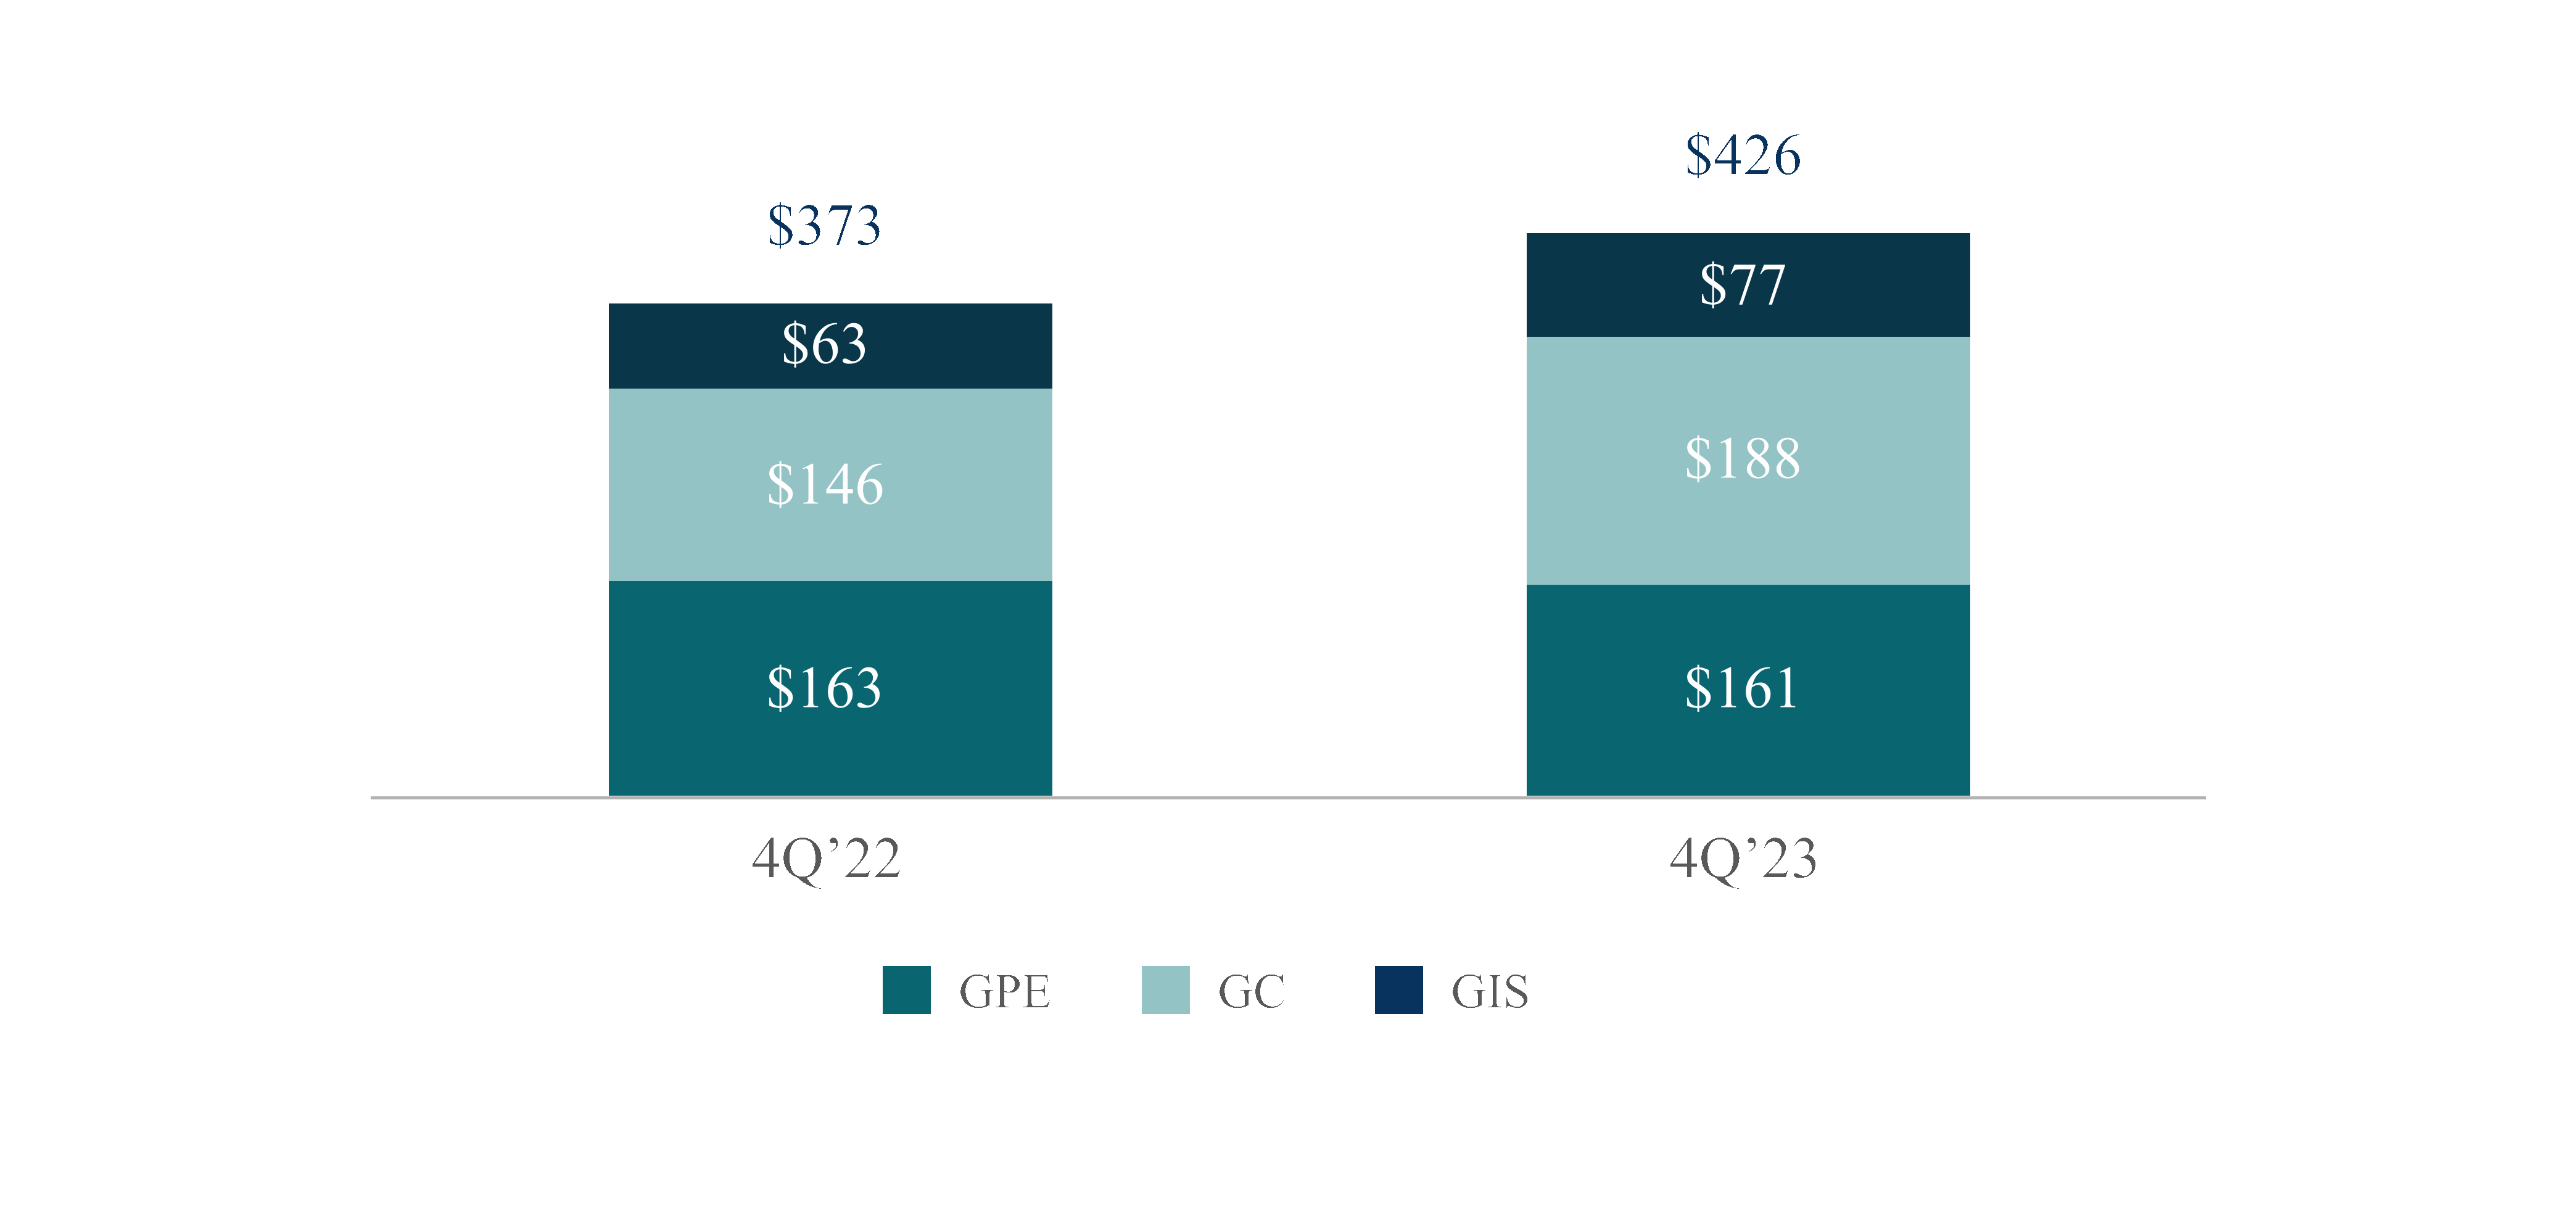
Balance, Beginning of Period | $372,691 | $300,957 | |
Inflows(1) | 63,466 | 94,824 | |
Outflows (including realizations)(2) | (25,880) | (35,665) | |
Market Activity & Other(3) | 13,563 | 18,109 | |
Foreign Exchange(4) | 2,154 | (5,534) | |
Balance, End of Period | $425,994 | $372,691 |
Year Ended December 31, | Change | ||||||
2023 | 2022 | $ | % | ||||
(Dollars in millions) | |||||||
Revenues | |||||||
Fund management fees | $2,043.2 | $2,030.1 | $13.1 | 1% | |||
Incentive fees | 93.7 | 63.7 | 30.0 | 47% | |||
Investment income | |||||||
Performance allocations | (88.6) | 1,327.5 | (1,416.1) | NM | |||
Principal investment income | 133.4 | 570.5 | (437.1) | (77)% | |||
Total investment income | 44.8 | 1,898.0 | (1,853.2) | (98)% | |||
Interest and other income | 212.1 | 135.9 | 76.2 | 56% | |||
Interest and other income of Consolidated Funds | 570.1 | 311.0 | 259.1 | 83% | |||
Total revenues | 2,963.9 | 4,438.7 | (1,474.8) | (33)% | |||
Expenses | |||||||
Compensation and benefits | |||||||
Cash-based compensation and benefits | 1,023.7 | 1,052.0 | (28.3) | (3)% | |||
Equity-based compensation | 249.1 | 154.0 | 95.1 | 62% | |||
Performance allocations and incentive fee related compensation | 1,103.7 | 719.9 | 383.8 | 53% | |||
Total compensation and benefits | 2,376.5 | 1,925.9 | 450.6 | 23% | |||
General, administrative and other expenses | 652.1 | 575.8 | 76.3 | 13% | |||
Interest | 123.8 | 110.4 | 13.4 | 12% | |||
Interest and other expenses of Consolidated Funds | 419.1 | 211.6 | 207.5 | 98% | |||
Other non-operating expenses | 0.2 | 1.0 | (0.8) | (80)% | |||
Total expenses | 3,571.7 | 2,824.7 | 747.0 | 26% | |||
Other income (loss) | |||||||
Net investment income (loss) of Consolidated Funds | 6.9 | (41.5) | 48.4 | NM | |||
Income (loss) before provision for income taxes | (600.9) | 1,572.5 | (2,173.4) | NM | |||
Provision (benefit) for income taxes | (104.2) | 287.8 | (392.0) | NM | |||
Net income (loss) | (496.7) | 1,284.7 | (1,781.4) | NM | |||
Net income attributable to non-controlling interests in consolidated entities | 111.7 | 59.7 | 52.0 | 87% | |||
Net income (loss) attributable to The Carlyle Group Inc. Common Stockholders | $(608.4) | $1,225.0 | $(1,833.4) | NM |
Year Ended December 31, | |
2023 v. 2022 | |
(Dollars in millions) | |
Higher management fees from the commencement of the investment period for certain newly raised funds | $73.8 |
Lower management fees resulting from the change in basis from commitments to invested capital for certain funds and from net investment activity in funds whose management fees are based on invested capital, including the impact of changes in rate and/or base under the strategic advisory services agreement with Fortitude | (48.7) |
Increase in catch-up management fees from subsequent closes of funds that are in the fundraising period | 6.8 |
Higher management fees due to CBAM and Abingworth acquisitions | 26.7 |
Lower transaction and portfolio advisory fees | (37.6) |
All other changes | (7.9) |
Total increase in Fund management fees(1) | $13.1 |
Year Ended December 31, | Change | ||||||
2023 | 2022 | $ | % | ||||
(Dollars in millions) | |||||||
Performance allocations | $(88.6) | $1,327.5 | $(1,416.1) | NM | |||
Principal investment income (loss): | |||||||
Investment income from NGP, which includes performance allocations | 138.3 | 663.3 | (525.0) | (79)% | |||
Investment income (loss) from our carry funds: | |||||||
Global Private Equity | 16.4 | 76.4 | (60.0) | (79)% | |||
Global Credit | 10.7 | (14.6) | 25.3 | NM | |||
Global Investment Solutions | 19.2 | 9.5 | 9.7 | NM | |||
Investment income (loss) from our CLOs | 21.3 | (48.6) | 69.9 | NM | |||
Investment loss from Carlyle FRL | (100.7) | (119.0) | 18.3 | (15)% | |||
Investment income (loss) from our other Global Credit products | 34.3 | (0.7) | 35.0 | NM | |||
Investment income on foreign currency hedges | 2.0 | 1.1 | 0.9 | 82% | |||
All other investment income (loss) | (8.1) | 3.1 | (11.2) | NM | |||
Total Principal investment income (loss) | 133.4 | 570.5 | (437.1) | (77)% | |||
Total investment income | $44.8 | $1,898.0 | $(1,853.2) | (98)% |
Year Ended December 31, | Change | ||||||
2023 | 2022 | $ | % | ||||
(Dollars in millions) | |||||||
Global Private Equity | $(551.5) | $1,098.3 | $(1,649.8) | NM | |||
Global Credit | 163.7 | 24.0 | 139.7 | NM | |||
Global Investment Solutions | 299.2 | 205.2 | 94.0 | 46% | |||
Total performance allocations | $(88.6) | $1,327.5 | $(1,416.1) | NM |
Year Ended December 31, | Change | ||||||
2023 | 2022 | $ | % | ||||
(Dollars in millions) | |||||||
Realized gains (losses) | $(80.8) | $(29.6) | $(51.2) | NM | |||
Net change in unrealized gains (losses) | 327.7 | (378.5) | 706.2 | NM | |||
Total gains (losses) | 246.9 | (408.1) | 655.0 | NM | |||
Gains (losses) from liabilities of CLOs | (240.0) | 366.6 | (606.6) | NM | |||
Total net investment gains (losses) of Consolidated Funds | $6.9 | $(41.5) | $48.4 | NM |
Year Ended December 31, | |||
2023 | 2022 | ||
(Dollars in millions) | |||
Total Segment Revenues | $3,405.1 | $4,401.4 | |
Total Segment Expenses | 1,974.6 | 2,492.4 | |
(=) Distributable Earnings | $1,430.5 | $1,909.0 | |
(-) Realized Net Performance Revenues | 531.0 | 998.5 | |
(-) Realized Principal Investment Income | 88.8 | 150.6 | |
(+) Net Interest | 48.7 | 74.5 | |
(=) Fee Related Earnings | $859.4 | $834.4 |
Year Ended December 31, | |||
2023 | 2022 | ||
(Dollars in millions) | |||
Segment Revenues | |||
Fund level fee revenues | |||
Fund management fees | $2,064.4 | $1,996.9 | |
Portfolio advisory and transaction fees, net and other | 80.4 | 111.1 | |
Fee related performance revenues | 161.0 | 129.3 | |
Total fund level fee revenues | 2,305.8 | 2,237.3 | |
Realized performance revenues | 938.3 | 1,980.7 | |
Realized principal investment income | 88.8 | 150.6 | |
Interest income | 72.2 | 32.8 | |
Total Segment Revenues | $3,405.1 | $4,401.4 |
Year Ended December 31, | |||
2023 | 2022 | ||
(Dollars in millions) | |||
Segment Expenses | |||
Compensation and benefits | |||
Cash-based compensation and benefits | $1,031.9 | $994.2 | |
Realized performance revenue related compensation | 407.3 | 982.2 | |
Total compensation and benefits | 1,439.2 | 1,976.4 | |
General, administrative, and other indirect expenses | 376.5 | 369.8 | |
Depreciation and amortization expense | 38.0 | 38.9 | |
Interest expense | 120.9 | 107.3 | |
Total Segment Expenses | $1,974.6 | $2,492.4 |
Year Ended December 31, | |||
2023 | 2022 | ||
(Dollars in millions) | |||
Income (loss) before provision for income taxes | $(600.9) | $1,572.5 | |
Adjustments: | |||
Net unrealized performance and fee related performance revenues | 1,659.2 | (183.7) | |
Unrealized principal investment (income) loss | (36.1) | 38.3 | |
Principal investment loss from dilution of indirect investment in Fortitude | 104.0 | 176.9 | |
Equity-based compensation(1) | 260.1 | 161.9 | |
Acquisition or disposition-related charges, including amortization of intangibles and impairment | 145.3 | 187.4 | |
Tax (expense) benefit associated with certain foreign performance revenues | (1.0) | 3.0 | |
Net income attributable to non-controlling interests in consolidated entities | (111.7) | (59.7) | |
Other adjustments, including severance | 11.6 | 12.4 | |
(=) Distributable Earnings | 1,430.5 | 1,909.0 | |
(-) Realized net performance revenues, net of related compensation(2) | 531.0 | 998.5 | |
(-) Realized principal investment income(2) | 88.8 | 150.6 | |
(+) Net interest | 48.7 | 74.5 | |
(=) Fee Related Earnings | $859.4 | $834.4 |
Year Ended December 31, 2023 | |||||
Carlyle Consolidated | Adjustments(3) | Total Reportable Segments | |||
(Dollars in millions) | |||||
Performance revenues | $(88.6) | $1,026.9 | $938.3 | ||
Performance revenues related compensation expense | 1,103.7 | (696.4) | 407.3 | ||
Net performance revenues | $(1,192.3) | $1,723.3 | $531.0 | ||
Principal investment income (loss) | $133.4 | $(44.6) | $88.8 | ||
Year Ended December 31, 2022 | |||||
Carlyle Consolidated | Adjustments(3) | Total Reportable Segments | |||
(Dollars in millions) | |||||
Performance revenues | $1,327.5 | $653.2 | $1,980.7 | ||
Performance revenues related compensation expense | 719.9 | 262.3 | 982.2 | ||
Net performance revenues | $607.6 | $390.9 | $998.5 | ||
Principal investment income (loss) | $570.5 | $(419.9) | $150.6 |
Year Ended December 31, | |||
2023 | 2022 | ||
(Dollars in millions) | |||
Global Private Equity | $1,071.8 | $1,505.6 | |
Global Credit | 274.4 | 315.5 | |
Global Investment Solutions | 84.3 | 87.9 | |
Distributable Earnings | $1,430.5 | $1,909.0 |
Year Ended December 31, | Change | ||||||
2023 | 2022 | $ | % | ||||
(Dollars in millions) | |||||||
Segment Revenues | |||||||
Fund level fee revenues | |||||||
Fund management fees | $1,309.8 | $1,300.9 | $8.9 | 1% | |||
Portfolio advisory and transaction fees, net and other | 18.4 | 29.5 | (11.1) | (38)% | |||
Fee related performance revenues | 68.3 | 69.4 | (1.1) | (2)% | |||
Total fund level fee revenues | 1,396.5 | 1,399.8 | (3.3) | —% | |||
Realized performance revenues | 805.1 | 1,656.6 | (851.5) | (51)% | |||
Realized principal investment income | 45.3 | 108.7 | (63.4) | (58)% | |||
Interest income | 31.6 | 14.9 | 16.7 | NM | |||
Total revenues | 2,278.5 | 3,180.0 | (901.5) | (28)% | |||
Segment Expenses | |||||||
Compensation and benefits | |||||||
Cash-based compensation and benefits | 583.8 | 598.3 | (14.5) | (2)% | |||
Realized performance revenues related compensation | 308.1 | 751.5 | (443.4) | (59)% | |||
Total compensation and benefits | 891.9 | 1,349.8 | (457.9) | (34)% | |||
General, administrative, and other indirect expenses | 221.9 | 235.3 | (13.4) | (6)% | |||
Depreciation and amortization expense | 26.0 | 25.6 | 0.4 | 2% | |||
Interest expense | 66.9 | 63.7 | 3.2 | 5% | |||
Total expenses | 1,206.7 | 1,674.4 | (467.7) | (28)% | |||
(=) Distributable Earnings | $1,071.8 | $1,505.6 | $(433.8) | (29)% | |||
(-) Realized Net Performance Revenues | 497.0 | 905.1 | (408.1) | (45)% | |||
(-) Realized Principal Investment Income | 45.3 | 108.7 | (63.4) | (58)% | |||
(+) Net Interest | 35.3 | 48.8 | (13.5) | (28)% | |||
(=) Fee Related Earnings | $564.8 | $540.6 | $24.2 | 4% |
Year Ended December 31, | |
2023 v. 2022 | |
(Dollars in millions) | |
Distributable Earnings, December 31, 2022 | $1,505.6 |
Increase in fee related earnings | 24.2 |
Decrease in realized net performance revenues | (408.1) |
Decrease in realized principal investment income | (63.4) |
Decrease in net interest | 13.5 |
Total decrease | (433.8) |
Distributable Earnings, December 31, 2023 | $1,071.8 |
Year Ended December 31, | ||
2023 | 2022 | |
NGP XII(1) | CP V | |
CEOF II | CP VI | |
CEOF I | CEOF II | |
CEP IV | CGFSP II | |
CP VI | CEP IV | |
CRP VIII | CAP IV | |
CJP III | ||
CETP IV | ||
CRP VIII |
Year Ended December 31, | |
2023 v. 2022 | |
(Dollars in millions) | |
Fee Related Earnings, December 31, 2022 | $540.6 |
Decrease in fee revenues | (3.3) |
Decrease in cash-based compensation and benefits | 14.5 |
Decrease in general, administrative and other indirect expenses | 13.4 |
All other changes | (0.4) |
Total increase | 24.2 |
Fee Related Earnings, December 31, 2023 | $564.8 |
Year Ended December 31, | |
2023 v. 2022 | |
(Dollars in millions) | |
Higher fund management fees | $8.9 |
Lower portfolio advisory and transaction fees, net and other | (11.1) |
Lower fee related performance revenues | (1.1) |
Total decrease in fee revenues | $(3.3) |
As of December 31, | |||
2023 | 2022 | ||
(Dollars in millions) | |||
Global Private Equity | |||
Components of Fee-earning AUM(1) | |||
Fee-earning AUM based on capital commitments | $52,172 | $55,227 | |
Fee-earning AUM based on invested capital | 44,524 | 42,028 | |
Fee-earning AUM based on net asset value | 6,877 | 6,188 | |
Fee-earning AUM based on lower of cost or fair value and other | 3,078 | 4,358 | |
Total Fee-earning AUM | $106,651 | $107,801 | |
Annualized Management Fee Rate(2) | 1.22% | 1.23% |
Year Ended December 31, | |||
2023 | 2022 | ||
(Dollars in millions) | |||
Global Private Equity | |||
Fee-earning AUM Rollforward | |||
Balance, Beginning of Period | $107,801 | $104,252 | |
Inflows(1) | 6,863 | 12,983 | |
Outflows (including realizations)(2) | (7,917) | (8,306) | |
Market Activity & Other(3) | (413) | 61 | |
Foreign Exchange(4) | 317 | (1,189) | |
Balance, End of Period | $106,651 | $107,801 |
Year Ended December 31, | |||
2023 | 2022 | ||
(Dollars in millions) | |||
Global Private Equity | |||
Total AUM Rollforward | |||
Balance, Beginning of Period | $163,098 | $162,117 | |
Inflows(1) | 8,759 | 12,391 | |
Outflows (including realizations)(2) | (14,375) | (22,086) | |
Market Activity & Other(3) | 3,073 | 12,554 | |
Foreign Exchange(4) | 753 | (1,878) | |
Balance, End of Period | $161,308 | $163,098 |
(Amounts in millions) | TOTAL INVESTMENTS | REALIZED/PARTIALLY REALIZED INVESTMENTS (5) | ||||||||||||
As of December 31, 2023 | As of December 31, 2023 | |||||||||||||
Fund (Fee Initiation Date/Stepdown Date) (19) | Committed Capital (20) | Cumulative Invested Capital (1) | Percent Invested | Realized Value (2) | Remaining Fair Value (3) | MOIC (4) | Gross IRR (6)(12) | Net IRR (7)(12) | Net Accrued Carry/ (Giveback) (8) | Total Fair Value (9) | MOIC (4) | Gross IRR (6)(12) | ||
Corporate Private Equity | ||||||||||||||
CP VIII (Oct 2021 / Oct 2027) | $14,797 | $7,490 | 51% | $680 | $8,229 | 1.2x | NM | NM | $1 | n/a | n/a | n/a | ||
CP VII (May 2018 / Oct 2021) | $18,510 | $17,740 | 96% | $2,150 | $22,495 | 1.4x | 11% | 8% | $45 | $1,632 | 1.2x | 13% | ||
CP VI (May 2013 / May 2018) | $13,000 | $13,140 | 101% | $23,982 | $5,249 | 2.2x | 18% | 14% | $210 | $26,623 | 2.5x | 22% | ||
CP V (Jun 2007 / May 2013) | $13,720 | $13,238 | 96% | $28,073 | $832 | 2.2x | 18% | 14% | $58 | $28,149 | 2.3x | 20% | ||
CEP V (Oct 2018 / Sep 2024) | €6,416 | €5,538 | 86% | €1,446 | €6,141 | 1.4x | 17% | 9% | $85 | n/a | n/a | n/a | ||
CEP IV (Sep 2014 / Oct 2018) | €3,670 | €3,797 | 103% | €6,188 | €1,371 | 2.0x | 18% | 12% | $87 | €6,277 | 2.1x | 20% | ||
CEP III (Jul 2007 / Dec 2012) | €5,295 | €5,177 | 98% | €11,716 | €110 | 2.3x | 19% | 14% | $9 | €11,654 | 2.3x | 19% | ||
CAP V (Jun 2018 / Jun 2024) | $6,554 | $5,713 | 87% | $1,499 | $6,260 | 1.4x | 18% | 8% | $81 | $916 | 1.8x | 142% | ||
CAP IV (Jul 2013 / Jun 2018) | $3,880 | $4,146 | 107% | $6,400 | $2,424 | 2.1x | 18% | 13% | $165 | $7,577 | 2.9x | 26% | ||
CJP IV (Oct 2020 / Oct 2026) | ¥258,000 | ¥180,016 | 70% | ¥53,996 | ¥237,248 | 1.6x | 50% | 29% | $45 | ¥50,774 | 3.5x | 155% | ||
CJP III (Sep 2013 / Aug 2020) | ¥119,505 | ¥91,192 | 76% | ¥214,998 | ¥39,358 | 2.8x | 24% | 17% | $17 | ¥203,055 | 3.4x | 27% | ||
CGFSP III (Dec 2017 / Dec 2023) | $1,005 | $942 | 94% | $383 | $1,701 | 2.2x | 30% | 21% | $70 | $781 | 6.2x | 50% | ||
CGFSP II (Jun 2013 / Dec 2017) | $1,000 | $943 | 94% | $1,960 | $538 | 2.7x | 26% | 20% | $30 | $1,956 | 2.4x | 28% | ||
CP Growth (Oct 2021 / Oct 2027) | $1,283 | $353 | 27% | $— | $386 | 1.1x | NM | NM | $— | n/a | n/a | n/a | ||
CEOF II (Nov 2015 / Mar 2020) | $2,400 | $2,361 | 98% | $3,095 | $1,914 | 2.1x | 21% | 15% | $82 | $3,122 | 2.9x | 37% | ||
CETP V (Mar 2022 / Jun 2028) | €3,180 | €1,024 | 32% | €— | €1,033 | 1.0x | NM | NM | $— | n/a | n/a | n/a | ||
CETP IV (Jul 2019 / Jun 2022) | €1,350 | €1,177 | 87% | €813 | €1,740 | 2.2x | 39% | 27% | $67 | €788 | 9.3x | 122% | ||
CETP III (Jul 2014 / Jul 2019) | €657 | €602 | 92% | €1,278 | €736 | 3.3x | 42% | 29% | $46 | €1,288 | 3.4x | 46% | ||
CGP II (Dec 2020 / Jan 2025) | $1,840 | $984 | 53% | $16 | $1,180 | 1.2x | 11% | 6% | $6 | n/a | n/a | n/a | ||
CGP (Jan 2015 / Mar 2021) | $3,588 | $3,206 | 89% | $1,427 | $3,011 | 1.4x | 6% | 5% | $31 | $1,688 | 2.1x | 16% | ||
CAGP IV (Aug 2008 / Dec 2014) | $1,041 | $954 | 92% | $1,141 | $79 | 1.3x | 6% | 1% | $— | $1,131 | 1.3x | 7% | ||
CSABF (Dec 2009 / Dec 2016) | $776 | $773 | 100% | $541 | $326 | 1.1x | 2% | Neg | $— | $660 | 1.3x | 5% | ||
All Other Active Funds & Vehicles (10) | $20,535 | n/a | $17,154 | $15,493 | 1.6x | 21% | 14% | $35 | $17,146 | 2.1x | 29% | |||
Fully Realized Funds & Vehicles (11)(21) | $31,019 | n/a | $74,477 | $2 | 2.4x | 28% | 20% | $— | $74,479 | 2.4x | 28% | |||
TOTAL CORPORATE PRIVATE EQUITY (13) | $144,619 | n/a | $188,611 | $84,396 | 1.9x | 25% | 17% | $1,169 | $189,797 | 2.4x | 26% | |||
Real Estate | ||||||||||||||
CRP IX ( Oct 2021 / Oct 2026 ) | $7,987 | $3,573 | 45% | $— | $3,726 | 1.0x | NM | NM | $— | $35 | 1.2x | NM | ||
CRP VIII (Aug 2017 / Oct 2021) | $5,505 | $5,160 | 94% | $4,674 | $4,171 | 1.7x | 39% | 24% | $109 | $4,718 | 2.1x | 54% | ||
CRP VII (Jun 2014 / Dec 2017) | $4,162 | $3,843 | 92% | $4,912 | $1,426 | 1.6x | 17% | 11% | $38 | $4,874 | 1.8x | 22% | ||
CRP VI (Mar 2011 / Jun 2014) | $2,340 | $2,179 | 93% | $3,790 | $147 | 1.8x | 27% | 18% | $3 | $3,709 | 1.9x | 29% | ||
CPI (May 2016 / n/a) | $7,534 | $7,852 | 104% | $2,442 | $7,666 | 1.3x | 14% | 12% | n/a* | $1,376 | 1.7x | 10% | ||
All Other Active Funds & Vehicles (14) | $3,131 | n/a | $1,258 | $2,974 | 1.4x | 9% | 8% | $9 | $876 | 1.7x | 20% | |||
Fully Realized Funds & Vehicles (15)(21) | $13,011 | n/a | $19,611 | $14 | 1.5x | 10% | 6% | $— | $19,624 | 1.5x | 10% | |||
TOTAL REAL ESTATE (13) | $38,749 | n/a | $36,687 | $20,125 | 1.5x | 12% | 8% | $158 | $35,213 | 1.7x | 13% | |||
Infrastructure & Natural Resources | ||||||||||||||
CIEP II (Apr 2019 / Apr 2025) | $2,286 | $1,008 | 44% | $707 | $927 | 1.6x | 32% | 14% | $25 | $644 | 2.7x | NM** | ||
CIEP I (Sep 2013 / Jun 2019) | $2,500 | $2,409 | 96% | $2,310 | $2,198 | 1.9x | 16% | 10% | $102 | $3,392 | 2.7x | 24% | ||
CPP II (Sep 2014 / Apr 2021) | $1,527 | $1,583 | 104% | $1,220 | $1,728 | 1.9x | 16% | 10% | $80 | $1,633 | 3.2x | 30% | ||
CGIOF (Dec 2018 / Sep 2023) | $2,201 | $1,871 | 85% | $447 | $2,347 | 1.5x | 22% | 12% | $47 | $416 | 1.5x | 25% | ||
CRSEF II (Nov 2022 / Aug 2027) | $1,004 | $265 | 26% | $— | $340 | 1.3x | NM | NM | $2 | n/a | n/a | n/a | ||
NGP XIII (Feb 2023 / Feb 2028) | $1,628 | $140 | 9% | $— | $142 | 1.0x | NM | NM | $— | n/a | n/a | n/a | ||
NGP XII (Jul 2017 / Jul 2022) | $4,304 | $3,014 | 70% | $3,527 | $2,683 | 2.1x | 22% | 16% | $41 | $3,537 | 3.5x | 41% | ||
NGP XI (Oct 2014 / Jul 2017) | $5,325 | $5,034 | 95% | $5,796 | $3,848 | 1.9x | 14% | 10% | $136 | $6,837 | 2.1x | 24% | ||
NGP X (Jan 2012 / Dec 2014) | $3,586 | $3,351 | 93% | $3,414 | $292 | 1.1x | 3% | Neg | $— | $3,261 | 1.2x | 5% | ||
All Other Active Funds & Vehicles (17) | $4,855 | n/a | $3,031 | $4,325 | 1.5x | 14% | 12% | $20 | $3,229 | 2.3x | 24% | |||
Fully Realized Funds & Vehicles (18) | $1,190 | n/a | $1,435 | $— | 1.2x | 3% | 1% | $— | $1,435 | 1.2x | 3% | |||
TOTAL INFRASTRUCTURE & NATURAL RESOURCES | $24,720 | n/a | $21,887 | $18,830 | 1.6x | 12% | 8% | $452 | $24,384 | 2.1x | 16% | |||
Legacy Energy Funds (16) | $16,741 | n/a | $24,001 | $33 | 1.4x | 12% | 6% | $(1) | $23,568 | 1.5x | 14% |
Year Ended December 31, | Change | ||||||
2023 | 2022 | $ | % | ||||
(Dollars in millions) | |||||||
Segment Revenues | |||||||
Fund level fee revenues | |||||||
Fund management fees | $512.2 | $473.1 | $39.1 | 8% | |||
Portfolio advisory and transaction fees, net and other | 62.0 | 81.6 | (19.6) | (24)% | |||
Fee related performance revenues | 89.1 | 59.9 | 29.2 | 49% | |||
Total fund level fee revenues | 663.3 | 614.6 | 48.7 | 8% | |||
Realized performance revenues | 43.5 | 131.5 | (88.0) | (67)% | |||
Realized principal investment income | 37.1 | 38.1 | (1.0) | (3)% | |||
Interest income | 34.7 | 15.3 | 19.4 | NM | |||
Total revenues | 778.6 | 799.5 | (20.9) | (3)% | |||
Segment Expenses | |||||||
Compensation and benefits | |||||||
Cash-based compensation and benefits | 324.5 | 284.2 | 40.3 | 14% | |||
Realized performance revenues related compensation | 20.3 | 61.3 | (41.0) | (67)% | |||
Total compensation and benefits | 344.8 | 345.5 | (0.7) | —% | |||
General, administrative, and other indirect expenses | 106.8 | 97.7 | 9.1 | 9% | |||
Depreciation and amortization expense | 7.6 | 8.2 | (0.6) | (7)% | |||
Interest expense | 45.0 | 32.6 | 12.4 | 38% | |||
Total expenses | 504.2 | 484.0 | 20.2 | 4% | |||
(=) Distributable Earnings | $274.4 | $315.5 | $(41.1) | (13)% | |||
(-) Realized Net Performance Revenues | 23.2 | 70.2 | (47.0) | (67)% | |||
(-) Realized Principal Investment Income | 37.1 | 38.1 | (1.0) | (3)% | |||
(+) Net Interest | 10.3 | 17.3 | (7.0) | (40)% | |||
(=) Fee Related Earnings | $224.4 | $224.5 | $(0.1) | —% |
Year Ended December 31, | |
2023 v. 2022 | |
(Dollars in millions) | |
Distributable Earnings, December 31, 2022 | $315.5 |
Decrease in fee related earnings | (0.1) |
Decrease in realized net performance revenues | (47.0) |
Decrease in realized principal investment income | (1.0) |
Decrease in net interest | 7.0 |
Total decrease | (41.1) |
Distributable Earnings, December 31, 2023 | $274.4 |
Year Ended December 31, | |
2023 v. 2022 | |
(Dollars in millions) | |
Fee Related Earnings, December 31, 2022 | $224.5 |
Increase in fee revenues | 48.7 |
Increase in cash-based compensation and benefits | (40.3) |
Increase in general, administrative and other indirect expenses | (9.1) |
All other changes | 0.6 |
Total decrease | (0.1) |
Fee Related Earnings, December 31, 2023 | $224.4 |
Year Ended December 31, | |
2023 v. 2022 | |
(Dollars in millions) | |
Higher fund management fees | $39.1 |
Lower portfolio advisory and transaction fees, net and other | (19.6) |
Higher fee related performance revenues | 29.2 |
Total increase in fee revenues | $48.7 |
As of December 31, | |||
2023 | 2022 | ||
(Dollars in millions) | |||
Global Credit | |||
Components of Fee-earning AUM(1) | |||
Fee-earning AUM based on capital commitments | $2,260 | $6,240 | |
Fee-earning AUM based on invested capital | 16,388 | 13,446 | |
Fee-earning AUM based on collateral balances, at par | 49,999 | 46,173 | |
Fee-earning AUM based on net asset value | 2,130 | 2,008 | |
Fee-earning AUM based on fair value and other(2) | 84,461 | 53,362 | |
Total Fee-earning AUM | $155,238 | $121,229 | |
Annualized Management Fee Rate(3) | 0.39% | 0.50% |
Year Ended Ended December 31, | |||
2023 | 2022 | ||
(Dollars in millions) | |||
Global Credit | |||
Fee-earning AUM Rollforward | |||
Balance, Beginning of Period | $121,229 | $51,718 | |
Inflows(1) | 35,568 | 78,057 | |
Outflows (including realizations)(2) | (4,705) | (6,845) | |
Market Activity & Other(3) | 2,793 | (1,103) | |
Foreign Exchange(4) | 353 | (598) | |
Balance, End of Period | $155,238 | $121,229 |
Year Ended December 31, | |||
2023 | 2022 | ||
(Dollars in millions) | |||
Global Credit | |||
Total AUM Rollforward | |||
Balance, Beginning of Period | $146,302 | $73,384 | |
Inflows(1) | 41,975 | 78,277 | |
Outflows (including realizations)(2) | (5,613) | (5,741) | |
Market Activity & Other(3) | 4,789 | 991 | |
Foreign Exchange(4) | 373 | (609) | |
Balance, End of Period | $187,826 | $146,302 |
(Dollars in millions) | TOTAL INVESTMENTS | |||||||||
As of December 31, 2023 | ||||||||||
Fund (Fee Initiation Date/Stepdown Date) (11) | Committed Capital (12) | Cumulative Invested Capital (1) | Percent Invested | Realized Value (2) | Remaining Fair Value (3) | MOIC (4) | Gross IRR (5)(8) | Net IRR (6)(8) | Net Accrued Carry/(Giveback) (7) | |
CCOF III (Feb 2023 / Jun 2028) | $2,273 | $896 | 39% | $14 | $949 | 1.1x | NM | NM | $1 | |
CCOF II (Nov 2020 / Oct 2025) | $4,430 | $5,148 | 116% | $1,073 | $5,228 | 1.2x | 16% | 11% | $65 | |
CCOF I (Nov 2017 / Sep 2022) | $2,373 | $3,471 | 146% | $3,005 | $1,740 | 1.4x | 17% | 12% | $27 | |
CSP IV (Apr 2016 / Dec 2020) | $2,500 | $2,500 | 100% | $948 | $2,319 | 1.3x | 11% | 5% | $— | |
CSP III (Dec 2011 / Aug 2015) | $703 | $703 | 100% | $931 | $31 | 1.4x | 18% | 8% | $— | |
CEMOF II (Dec 2015 / Jun 2019) | $1,692 | $1,713 | 101% | $1,841 | $333 | 1.3x | 7% | 3% | $— | |
SASOF III (Nov 2014 / n/a) | $833 | $991 | 119% | $1,197 | $63 | 1.3x | 18% | 10% | $5 | |
All Other Active Funds & Vehicles (9) | $9,828 | n/a | $2,208 | $8,256 | 1.1x | 4% | 3% | $20 | ||
Fully Realized Funds & Vehicles (10)(13) | $6,625 | n/a | $8,190 | $— | 1.2x | 9% | 3% | $— | ||
TOTAL GLOBAL CREDIT CARRY FUNDS | $31,875 | n/a | $19,406 | $18,918 | 1.2x | 10% | 5% | $118 |
Year Ended December 31, | Change | ||||||
2023 | 2022 | $ | % | ||||
(Dollars in millions) | |||||||
Segment Revenues | |||||||
Fund level fee revenues | |||||||
Fund management fees | $242.4 | $222.9 | $19.5 | 9% | |||
Fee related performance revenues | 3.6 | — | 3.6 | N/A | |||
Total fund level fee revenues | 246.0 | 222.9 | 23.1 | 10% | |||
Realized performance revenues | 89.7 | 192.6 | (102.9) | (53)% | |||
Realized principal investment income | 6.4 | 3.8 | 2.6 | 68% | |||
Interest income | 5.9 | 2.6 | 3.3 | NM | |||
Total revenues | 348.0 | 421.9 | (73.9) | (18)% | |||
Segment Expenses | |||||||
Compensation and benefits | |||||||
Cash-based compensation and benefits | 123.6 | 111.7 | 11.9 | 11% | |||
Realized performance revenues related compensation | 78.9 | 169.4 | (90.5) | (53)% | |||
Total compensation and benefits | 202.5 | 281.1 | (78.6) | (28)% | |||
General, administrative, and other indirect expenses | 47.8 | 36.8 | 11.0 | 30% | |||
Depreciation and amortization expense | 4.4 | 5.1 | (0.7) | (14)% | |||
Interest expense | 9.0 | 11.0 | (2.0) | (18)% | |||
Total expenses | 263.7 | 334.0 | (70.3) | (21)% | |||
(=) Distributable Earnings | $84.3 | $87.9 | $(3.6) | (4)% | |||
(-) Realized Net Performance Revenues | 10.8 | 23.2 | (12.4) | (53)% | |||
(-) Realized Principal Investment Income | 6.4 | 3.8 | 2.6 | 68% | |||
(+) Net Interest | 3.1 | 8.4 | (5.3) | (63)% | |||
(=) Fee Related Earnings | $70.2 | $69.3 | $0.9 | 1% |
Year Ended December 31, | |
2023 v. 2022 | |
(Dollars in millions) | |
Distributable Earnings, December 31, 2022 | $87.9 |
Increase in fee related earnings | 0.9 |
Decrease in realized net performance revenues | (12.4) |
Increase in realized principal investment income | 2.6 |
Decrease in net interest | 5.3 |
Total decrease | (3.6) |
Distributable Earnings, December 31, 2023 | $84.3 |
Year Ended December 31, | |
2023 v. 2022 | |
(Dollars in millions) | |
Fee Related Earnings, December 31, 2022 | $69.3 |
Increase in fee revenues | 23.1 |
Increase in cash-based compensation | (11.9) |
Increase in general, administrative and other indirect expenses | (11.0) |
All other changes | 0.7 |
Total increase | 0.9 |
Fee Related Earnings, December 31, 2023 | $70.2 |
As of December 31, | |||
2023 | 2022 | ||
(Dollars in millions) | |||
Global Investment Solutions | |||
Components of Fee-earning AUM(1) | |||
Fee-earning AUM based on capital commitments | $17,488 | $19,590 | |
Fee-earning AUM based on invested capital(2) | 8,459 | 4,985 | |
Fee-earning AUM based on net asset value | 10,530 | 3,783 | |
Fee-earning AUM based on lower of cost or fair market value | 9,052 | 9,189 | |
Total Fee-earning AUM | $45,529 | $37,547 | |
Annualized Management Fee Rate(3) | 0.60% | 0.60% |
Year Ended Ended December 31, | |||
2023 | 2022 | ||
(Dollars in millions) | |||
Global Investment Solutions | |||
Fee-earning AUM Rollforward | |||
Balance, Beginning of Period | $37,547 | $37,449 | |
Inflows(1) | 13,100 | 4,494 | |
Outflows (including realizations)(2) | (5,707) | (3,280) | |
Market Activity & Other(3) | 493 | 537 | |
Foreign Exchange(4) | 96 | (1,653) | |
Balance, End of Period | $45,529 | $37,547 |
Year Ended Ended December 31, | |||
2023 | 2022 | ||
(Dollars in millions) | |||
Global Investment Solutions | |||
Total AUM Rollforward | |||
Balance, Beginning of Period | $63,291 | $65,456 | |
Inflows(1) | 12,732 | 4,156 | |
Outflows (including realizations)(2) | (5,892) | (7,838) | |
Market Activity & Other(3) | 5,701 | 4,564 | |
Foreign Exchange(4) | 1,028 | (3,047) | |
Balance, End of Period | $76,860 | $63,291 |
TOTAL INVESTMENTS | |||||||||||
As of December 31, 2023 | |||||||||||
Global Investment Solutions (1)(8) | Vintage Year | Fund Size | Cumulative Invested Capital (2)(3) | Realized Value (3) | Remaining Fair Value (3) | Total Fair Value (3)(4) | MOIC (5) | Gross IRR (6)(10) | Net IRR (7)(10) | Net Accrued Carry/ (Giveback) (12) | |
(Reported in Local Currency, in Millions) | |||||||||||
Secondaries and Portfolio Finance | ASF VIII | 2023 | $5,546 | $792 | $13 | $1,065 | $1,078 | 1.4x | NM | NM | $12 |
ASF VII | 2020 | $6,769 | $5,160 | $939 | $6,096 | $7,035 | 1.4x | 25% | 19% | $76 | |
ASF VII - SMAs | 2020 | €2,016 | €1,539 | €340 | €1,844 | €2,184 | 1.4x | 25% | 21% | $29 | |
ASF VI | 2017 | $3,333 | $3,147 | $2,885 | $1,983 | $4,868 | 1.5x | 17% | 14% | $57 | |
ASF VI - SMAs | 2017 | €2,817 | €2,671 | €2,052 | €2,208 | €4,260 | 1.6x | 16% | 14% | $45 | |
ASF V | 2012 | $756 | $658 | $998 | $198 | $1,195 | 1.8x | 18% | 15% | $8 | |
ASF V - SMAs | 2012 | €3,916 | €4,063 | €6,787 | €809 | €7,596 | 1.9x | 21% | 20% | $15 | |
SMAs 2009-2011 | 2010 | €1,859 | €2,000 | €3,404 | €53 | €3,457 | 1.7x | 19% | 18% | $— | |
All Other Active Funds & Vehicles (9) | Various | $1,244 | $516 | $1,162 | $1,678 | 1.3x | 23% | 21% | $15 | ||
Fully Realized Funds & Vehicles | Various | €4,240 | €6,955 | €35 | €6,990 | 1.6x | 19% | 18% | $— | ||
Co-Investments | ACF IX | 2023 | $2,327 | $269 | $— | $268 | $268 | 1.0x | NM | NM | $— |
ACF VIII | 2021 | $3,614 | $3,043 | $37 | $3,598 | $3,635 | 1.2x | 12% | 9% | $17 | |
ACF VIII - SMAs | 2021 | $1,069 | $796 | $20 | $942 | $962 | 1.2x | 13% | 11% | $5 | |
ACF VII | 2017 | $1,688 | $1,633 | $764 | $2,365 | $3,129 | 1.9x | 18% | 15% | $54 | |
ACF VII - SMAs | 2017 | €1,452 | €1,415 | €548 | €1,966 | €2,515 | 1.8x | 17% | 15% | $43 | |
SMAs 2014-2016 | 2014 | €1,274 | €1,114 | €2,135 | €789 | €2,925 | 2.6x | 25% | 23% | $14 | |
SMAs 2012-2013 | 2012 | €1,124 | €1,061 | €2,724 | €293 | €3,018 | 2.8x | 28% | 26% | $2 | |
SMAs 2009-2010 | 2010 | €1,475 | €1,377 | €3,483 | €572 | €4,056 | 2.9x | 23% | 22% | $— | |
Strategic SMAs | Various | $3,528 | $1,028 | $4,834 | $5,861 | 1.7x | 20% | 18% | $58 | ||
All Other Active Funds & Vehicles (9) | Various | €442 | €583 | €105 | €687 | 1.6x | 16% | 14% | $2 | ||
Fully Realized Funds & Vehicles | Various | €5,710 | €9,834 | €1 | €9,835 | 1.7x | 14% | 13% | $— | ||
Primary Investments | SMAs 2021-2023 | 2021 | €4,349 | €631 | €12 | €696 | €708 | 1.1x | NM | NM | $— |
SMAs 2018-2020 | 2018 | $3,101 | $1,999 | $275 | $2,454 | $2,729 | 1.4x | 17% | 16% | $1 | |
SMAs 2015-2017 | 2015 | €2,501 | €2,411 | €2,074 | €2,588 | €4,662 | 1.9x | 22% | 21% | $10 | |
SMAs 2012-2014 | 2012 | €5,080 | €5,869 | €8,386 | €4,548 | €12,934 | 2.2x | 19% | 18% | $16 | |
SMAs 2009-2011 | 2009 | €4,877 | €5,709 | €9,817 | €2,530 | €12,347 | 2.2x | 17% | 17% | $1 | |
SMAs 2006-2008 | 2005 | €11,500 | €13,384 | €21,730 | €1,512 | €23,242 | 1.7x | 10% | 10% | $— | |
SMAs 2003-2005 | 2003 | €4,628 | €5,063 | €7,988 | €202 | €8,190 | 1.6x | 10% | 9% | $— | |
All Other Active Funds & Vehicles (9) | Various | €1,816 | €1,740 | €323 | €2,063 | 1.1x | 3% | 2% | $— | ||
Fully Realized Funds & Vehicles | Various | €4,942 | €8,042 | €40 | €8,082 | 1.6x | 12% | 11% | $— | ||
TOTAL GLOBAL INVESTMENT SOLUTIONS (USD) (11) | $94,695 | $116,606 | $48,328 | $164,934 | 1.7x | 14% | 13% | $481 |
Accrued Performance Allocations | Accrued Giveback Obligation | Net Accrued Performance Revenues | |||
(Dollars in millions) | |||||
Global Private Equity | $4,310.7 | $(18.4) | $4,292.3 | ||
Global Credit | 323.4 | (25.6) | 297.8 | ||
Global Investment Solutions | 1,535.8 | — | 1,535.8 | ||
Total | $6,169.9 | $(44.0) | $6,125.9 | ||
Plus: Accrued performance allocations from NGP Carry Funds | 484.4 | ||||
Less: Net accrued performance allocations presented as fee related performance revenues | (5.2) | ||||
Less: Accrued performance allocation-related compensation | (4,255.8) | ||||
Plus: Receivable for giveback obligations from current and former employees | 11.5 | ||||
Less: Deferred taxes on certain foreign accrued performance allocations | (27.1) | ||||
Less/Plus: Net accrued performance allocations/giveback obligations attributable to non-controlling interests in consolidated entities | 7.4 | ||||
Plus: Net accrued performance allocations attributable to Consolidated Funds, eliminated in consolidation | 9.1 | ||||
Net accrued performance revenues before timing differences | 2,350.2 | ||||
Less/Plus: Timing differences between the period when accrued performance allocations/giveback obligations are realized and the period they are collected/distributed | 28.6 | ||||
Net accrued performance revenues attributable to The Carlyle Group Inc. | $2,378.8 |
Carry Fund Appreciation/(Depreciation)(1) | Net Accrued Performance Revenues | |||||||
FY 2021 | FY 2022 | FY 2023 | ||||||
Overall Carry Fund Appreciation/(Depreciation) | 41% | 11% | 7% | |||||
Global Private Equity(2) | $1,777.5 | |||||||
Corporate Private Equity | 41% | 6% | 5% | 1,168.5 | ||||
Real Estate | 39% | 16% | (1)% | 158.4 | ||||
Infrastructure & Natural Resources | 34% | 48% | 8% | 451.6 | ||||
Global Credit Carry Funds | 22% | 3% | 12% | 117.9 | ||||
Global Investment Solutions Carry Funds | 48% | 6% | 10% | 483.4 | ||||
Net Accrued Performance Revenues | $2,378.8 |
Investments in Carlyle Funds | Investments in NGP(1) | Total | |||
(Dollars in millions) | |||||
Investments, excluding performance allocations | $2,930.7 | $854.7 | $3,785.4 | ||
Less: Amounts attributable to non-controlling interests in consolidated entities | (173.9) | — | (173.9) | ||
Plus: Investments in Consolidated Funds, eliminated in consolidation | 140.1 | — | 140.1 | ||
Less: Strategic equity method investments in NGP Management | — | (370.3) | (370.3) | ||
Less: Investment in NGP general partners - accrued performance allocations | — | (484.4) | (484.4) | ||
Total investments attributable to The Carlyle Group Inc. | $2,896.9 | $— | $2,896.9 |
Investments in Carlyle Funds, excluding CLOs: | |
Global Private Equity funds(1) | $892.1 |
Global Credit funds(2) | 1,069.7 |
Global Investment Solutions funds | 240.8 |
Total investments in Carlyle Funds, excluding CLOs | 2,202.6 |
Investments in CLOs | 559.2 |
Other investments | 135.1 |
Total investments attributable to The Carlyle Group Inc. | 2,896.9 |
CLO loans and other borrowings collateralized by investments attributable to The Carlyle Group Inc.(3) | (408.8) |
Total investments attributable to The Carlyle Group Inc., net of CLO loans and other borrowings | $2,488.1 |
Common Stock Dividends - Dividend Year 2023 | ||||
Quarter | Dividend per Common Share | Dividend to Common Stockholders | Record Date | Payment Date |
(Dollars in millions, except per share data) | ||||
Q1 2023 | $0.35 | $126.7 | May 16, 2023 | May 23, 2023 |
Q2 2023 | 0.35 | 126.3 | August 15, 2023 | August 23, 2023 |
Q3 2023 | 0.35 | 126.3 | November 21, 2023 | November 29, 2023 |
Q4 2023 | 0.35 | 126.7 | February 23, 2024 | March 1, 2024 |
Total | $1.40 | $506.0 |
Common Stock Dividends - Dividend Year 2022 | ||||
Quarter | Dividend per Common Share | Dividend to Common Stockholders | Record Date | Payment Date |
(Dollars in millions, except per share data) | ||||
Q1 2022 | $0.325 | $117.6 | May 10, 2022 | May 17, 2022 |
Q2 2022 | 0.325 | 118.3 | August 9, 2022 | August 16, 2022 |
Q3 2022 | 0.325 | 118.2 | November 18, 2022 | November 25, 2022 |
Q4 2022 | 0.325 | 118.4 | February 22, 2023 | March 1, 2023 |
Total | $1.30 | $472.5 |
Year Ended December 31, | |||
2023 | 2022 | ||
(Dollars in millions) | |||
Statements of Cash Flows Data | |||
Net cash provided by (used in) operating activities | $204.9 | $(379.3) | |
Net cash used in investing activities | (43.6) | (828.8) | |
Net cash (used in) provided by financing activities | (99.6) | 114.8 | |
Effect of foreign exchange rate changes | 18.9 | (20.3) | |
Net change in cash, cash equivalents and restricted cash | $80.6 | $(1,113.6) |
2024 | 2025-2026 | 2027-2028 | Thereafter | Total | |||||
(Dollars in millions) | |||||||||
Debt obligations(1) | $— | $71.0 | $95.4 | $2,140.3 | $2,306.7 | ||||
Interest payable(2) | 117.9 | 221.7 | 118.0 | 1,736.6 | 2,194.2 | ||||
Other consideration(3) | 185.5 | 37.0 | 30.3 | — | 252.8 | ||||
Operating lease obligations(4) | 66.9 | 124.1 | 121.4 | 286.5 | 598.9 | ||||
Capital commitments to Carlyle funds(5) | 3,742.8 | — | — | — | 3,742.8 | ||||
Tax receivable agreement payments(6) | 3.1 | 11.9 | 13.1 | 51.2 | 79.3 | ||||
Loans payable of Consolidated Funds(7) | 392.1 | 782.0 | 783.1 | 7,971.3 | 9,928.5 | ||||
Unfunded commitments of the CLOs(8) | 1.2 | — | — | — | 1.2 | ||||
Consolidated contractual obligations | 4,509.5 | 1,247.7 | 1,161.3 | 12,185.9 | 19,104.4 | ||||
Loans payable of Consolidated Funds(7) | (392.1) | (782.0) | (783.1) | (7,971.3) | (9,928.5) | ||||
Capital commitments to Carlyle funds(5) | (3,065.7) | — | — | — | (3,065.7) | ||||
Unfunded commitments of the CLOs(8) | (1.2) | — | — | — | (1.2) | ||||
Carlyle Operating Entities contractual obligations | $1,050.5 | $465.7 | $378.2 | $4,214.6 | $6,109.0 |
Year Ended Ended December 31, | |||
2023 | 2022 | ||
(Dollars in millions) | |||
Balance, beginning of period | 362,298,650 | 355,367,876 | |
Shares issued | 5,532,559 | 11,857,133 | |
Shares repurchased/retired | (6,505,037) | (4,926,359) | |
Balance, end of period | 361,326,172 | 362,298,650 |
10% Increase in Total Remaining Fair Value | 10% Decrease in Total Remaining Fair Value | ||
(Dollars in millions) | |||
Global Private Equity | $2,702.9 | $(1,417.8) | |
Global Credit | 189.8 | (264.1) | |
Global Investment Solutions | 343.7 | (352.8) | |
Total | $3,236.4 | $(2,034.7) |
Remaining Fair Value | |
(Dollars in millions) | |
Global Private Equity | $124,580 |
Global Credit | $171,960 |
Global Investment Solutions | $52,982 |
Description of the Matter | At December 31, 2023, the carrying value of the Company’s investments totaled approximately $10.0 billion. As discussed in Notes 2 and 5 to the consolidated financial statements, a significant input to the measurement of the Company’s principal equity method investments in the funds and accrued performance allocations, is management’s estimate of the fair value of the investments held by each fund. Management estimates the fair value of the funds’ investments, including investments in the equity of private operating companies, real estate properties and certain debt positions, by applying the methodologies outlined in Notes 2 and 5 and using unobservable inputs and assumptions. Auditing management’s estimates of the fair value of certain of the funds’ investments using significant unobservable inputs and assumptions was complex and judgmental because these investments exhibit higher estimation uncertainty. |
How We Addressed the Matter in Our Audit | We obtained an understanding, evaluated the design, and tested the operating effectiveness of controls over the funds’ investment valuation process. This included management's review controls over the assessment of the methodologies, significant inputs and assumptions included in the fair value estimates, as well as management’s review around the completeness, accuracy and reasonableness of the data used in these estimates. Our audit procedures related to a sample of investment valuations using significant unobservable inputs included, among others, assessing whether the valuation methodologies used were appropriate and testing the mathematical accuracy of the valuation models. For a sample of investment valuations, we obtained management’s valuation models and compared objective inputs used in the models to agreements or underlying source documents provided by the Company. We assessed the appropriateness of certain unobservable inputs and assumptions used in the valuation models by comparing them to underlying support or available market data and evaluating the appropriateness of adjustments. Our procedures varied based on the nature of the investment selected for testing. For example, for certain investments in the equity of private operating companies, we assessed the appropriateness of management’s determination of public market comparable companies and similar transactions. For these selected investments, we also evaluated adjustments applied to the selected earnings before interest, taxes, depreciation and amortization (EBITDA) multiple or discount rate derived from the comparable companies by considering investee specific and relevant market information. For certain investments, we independently developed fair value estimates, with the support of valuation specialists, using investee and market information and compared them to the funds’ fair value estimates. For a sample of investments that were sold during the year, we performed procedures to assess the historical reasonableness of management’s estimates. We also evaluated subsequent events and transactions and considered whether they corroborated or contradicted the year- end estimates. |
December 31, | |||
2023 | 2022 | ||
Assets | |||
Cash and cash equivalents | $ | $ | |
Cash and cash equivalents held at Consolidated Funds | |||
Restricted cash | |||
Corporate treasury investments | |||
Investments, including accrued performance allocations of $ 2023 and 2022, respectively | |||
Investments of Consolidated Funds | |||
Due from affiliates and other receivables, net | |||
Due from affiliates and other receivables of Consolidated Funds, net | |||
Fixed assets, net | |||
Lease right-of-use assets, net | |||
Deposits and other | |||
Intangible assets, net | |||
Deferred tax assets | |||
Total assets | $ | $ | |
Liabilities and equity | |||
Debt obligations | $ | $ | |
Loans payable of Consolidated Funds | |||
Accounts payable, accrued expenses and other liabilities | |||
Accrued compensation and benefits | |||
Due to affiliates | |||
Deferred revenue | |||
Deferred tax liabilities | |||
Other liabilities of Consolidated Funds | |||
Lease liabilities | |||
Accrued giveback obligations | |||
Total liabilities | |||
Commitments and contingencies | |||
Common stock, $ shares issued and outstanding as of December 31, 2023 and December 31, 2022, respectively) | |||
Additional paid-in capital | |||
Retained earnings | |||
Accumulated other comprehensive loss | ( | ( | |
Non-controlling interests in consolidated entities | |||
Total equity | |||
Total liabilities and equity | $ | $ |
Year Ended December 31, | |||||
2023 | 2022 | 2021 | |||
Revenues | |||||
Fund management fees | $ | $ | $ | ||
Incentive fees | |||||
Investment income | |||||
Performance allocations | ( | ||||
Principal investment income | |||||
Total investment income | |||||
Interest and other income | |||||
Interest and other income of Consolidated Funds | |||||
Total revenues | |||||
Expenses | |||||
Compensation and benefits | |||||
Cash-based compensation and benefits | |||||
Equity-based compensation | |||||
Performance allocations and incentive fee related compensation | |||||
Total compensation and benefits | |||||
General, administrative and other expenses | |||||
Interest | |||||
Interest and other expenses of Consolidated Funds | |||||
Other non-operating expenses | |||||
Total expenses | |||||
Other income (loss) | |||||
Net investment income (loss) of Consolidated Funds | ( | ||||
Income (loss) before provision for income taxes | ( | ||||
Provision (benefit) for income taxes | ( | ||||
Net income (loss) | ( | ||||
Net income attributable to non-controlling interests in consolidated entities | |||||
Net income (loss) attributable to The Carlyle Group Inc. | $( | $ | $ | ||
Net income (loss) attributable to The Carlyle Group Inc. per common share (see Note 13) | |||||
Basic | $( | $ | $ | ||
Diluted | $( | $ | $ | ||
Weighted-average common shares | |||||
Basic | |||||
Diluted |
Year Ended December 31, | |||||
2023 | 2022 | 2021 | |||
Net income (loss) | $( | $ | $ | ||
Other comprehensive income (loss), net of tax | |||||
Foreign currency translation adjustments, net of income tax (benefit) expense of $ $( | ( | ( | |||
Defined benefit plans, net | |||||
Unrealized net income (loss) for the period, net of income tax (benefit) expense of $( respectively | ( | ||||
Less: reclassification adjustment for unrecognized gain during the period included in base compensation expense, net of income tax (benefit) expense of $( $ respectively | ( | ||||
Other comprehensive income (loss) | ( | ( | |||
Comprehensive income (loss) | ( | ||||
Comprehensive income attributable to non-controlling interests in consolidated entities | |||||
Comprehensive income (loss) attributable to The Carlyle Group Inc. | $( | $ | $ |
Common Shares | Common Stock | Additional Paid-in Capital | Retained Earnings (Deficit) | Accumulated Other Comprehensive Income (Loss) | Non-controlling Interests in Consolidated Entities | Total Equity | |||||||
Balance at December 31, 2020 | $ | $ | $ | $( | $ | $ | |||||||
Shares repurchased | ( | — | — | ( | — | — | ( | ||||||
Equity-based compensation | — | — | — | — | |||||||||
Shares issued for equity-based awards | — | — | — | — | — | — | |||||||
Shares issued for performance allocations | — | — | — | — | |||||||||
Contributions | — | — | — | — | — | ||||||||
Dividends and distributions | — | — | — | ( | — | ( | ( | ||||||
Net income | — | — | — | — | |||||||||
Currency translation adjustments | — | — | — | — | ( | ( | ( | ||||||
Defined benefit plans, net | — | — | — | — | — | ||||||||
Balance at December 31, 2021 | $ | $ | $ | $( | $ | $ | |||||||
Shares repurchased | ( | $— | $— | $( | $— | $— | $( | ||||||
Equity-based compensation | — | — | — | — | — | ||||||||
Shares issued for equity-based awards | — | — | — | — | — | — | |||||||
Shares issued for performance allocations | — | — | — | — | |||||||||
Shares issued related to the acquisition of CBAM | — | — | — | — | |||||||||
Shares issued related to the acquisition of Abingworth | — | — | — | — | |||||||||
Contributions | — | — | — | — | — | ||||||||
Dividends and distributions | — | — | — | ( | — | ( | ( | ||||||
Net income | — | — | — | — | |||||||||
Deconsolidation of a Consolidated Entity | — | — | — | — | — | ( | ( | ||||||
Non-controlling interests related to the acquisition of Abingworth | — | — | — | — | — | ||||||||
Currency translation adjustments | — | — | — | — | ( | ( | ( | ||||||
Defined benefit plans, net | — | — | — | — | — | ||||||||
Balance at December 31, 2022 | $ | $ | $ | $( | $ | $ | |||||||
Shares repurchased | ( | — | — | ( | — | — | ( | ||||||
Equity-based compensation | — | — | — | — | — | ||||||||
Shares issued for equity-based awards | — | — | — | — | — | — | |||||||
Dividend-equivalent rights on certain equity- based awards | — | — | ( | — | — | ||||||||
Contributions | — | — | — | — | — | ||||||||
Dividends and distributions | — | — | — | ( | — | ( | ( | ||||||
Net income | — | — | — | ( | — | ( | |||||||
Deconsolidation of Consolidated Entities | — | — | — | — | — | ( | ( | ||||||
Currency translation adjustments | — | — | — | — | |||||||||
Defined benefit plans, net | — | — | — | — | ( | — | ( | ||||||
Balance at December 31, 2023 | $ | $ | $ | $( | $ | $ |
Year Ended December 31, | |||||
2023 | 2022 | 2021 | |||
Cash flows from operating activities | |||||
Net income (loss) | $( | $ | $ | ||
Adjustments to reconcile net income to net cash flows from operating activities: | |||||
Depreciation and amortization | |||||
Right-of-use asset impairment, net of broker fees | |||||
Equity-based compensation | |||||
Non-cash performance allocations and incentive fees, net | ( | ||||
Non-cash principal investment (income) loss | ( | ( | ( | ||
Other non-cash amounts | ( | ||||
Consolidated Funds related: | |||||
Realized/unrealized (gain) loss on investments of Consolidated Funds | ( | ( | |||
Realized/unrealized (gain) loss from loans payable of Consolidated Funds | ( | ||||
Purchases of investments by Consolidated Funds | ( | ( | ( | ||
Proceeds from sale and settlements of investments by Consolidated Funds | |||||
Non-cash interest income, net | ( | ( | ( | ||
Change in cash and cash equivalents held at Consolidated Funds | ( | ( | |||
Change in other receivables held at Consolidated Funds | ( | ( | |||
Change in other liabilities held at Consolidated Funds | ( | ||||
Other non-cash amounts of Consolidated Funds | |||||
Purchases of investments | ( | ( | ( | ||
Proceeds from the sale of investments | |||||
Payments of contingent consideration | ( | ( | ( | ||
Changes in deferred taxes, net | ( | ( | |||
Change in due from affiliates and other receivables | ( | ( | ( | ||
Change in deposits and other | ( | ( | |||
Change in accounts payable, accrued expenses and other liabilities | ( | ( | |||
Change in accrued compensation and benefits | ( | ||||
Change in due to affiliates | ( | ||||
Change in lease right-of-use assets and lease liabilities | ( | ( | |||
Change in deferred revenue | |||||
Net cash provided by (used in) operating activities | ( | ||||
Cash flows from investing activities | |||||
Purchases of corporate treasury investments | ( | ( | |||
Proceeds from corporate treasury investments | |||||
Purchases of fixed assets, net | ( | ( | ( | ||
Purchase of Abingworth, net of cash acquired | ( | ||||
Purchase of CBAM intangibles and investments | ( | ||||
Proceeds from sale of MRE, net of cash sold | |||||
Proceeds from sale of Brazil management entity, net of cash sold | |||||
Net cash used in investing activities | ( | ( | ( |
Year Ended December 31, | |||||
2023 | 2022 | 2021 | |||
Cash flows from financing activities | |||||
Borrowings under credit facilities | |||||
Repayments under credit facilities | ( | ||||
Issuance of | |||||
Repurchase of | ( | ||||
Proceeds from CLO borrowings, net of financing costs | |||||
Payments on CLO borrowings | ( | ( | ( | ||
Net borrowings on loans payable of Consolidated Funds | |||||
Payments of contingent consideration | ( | ||||
Dividends to common stockholders | ( | ( | ( | ||
Payment of deferred consideration for Carlyle Holdings units | ( | ( | ( | ||
Contributions from non-controlling interest holders | |||||
Distributions to non-controlling interest holders | ( | ( | ( | ||
Common shares issued for performance allocations | |||||
Common shares repurchased | ( | ( | ( | ||
Change in due to/from affiliates financing activities | ( | ( | ( | ||
Net cash (used in) provided by financing activities | ( | ( | |||
Effect of foreign exchange rate changes | ( | ( | |||
Increase (decrease) in cash, cash equivalents and restricted cash | ( | ||||
Cash, cash equivalents and restricted cash, beginning of period | |||||
Cash, cash equivalents and restricted cash, end of period | $ | $ | $ | ||
Supplemental cash disclosures | |||||
Cash paid for interest | $ | $ | $ | ||
Cash paid for income taxes | $ | $ | $ | ||
Supplemental non-cash disclosures | |||||
Issuance of common shares related to the acquisition of CBAM and Abingworth | $ | $ | $ | ||
Net asset impact of deconsolidation of Consolidated Funds | $( | $( | $( | ||
Reconciliation of cash, cash equivalents and restricted cash, end of period: | |||||
Cash and cash equivalents | $ | $ | $ | ||
Restricted cash | |||||
Total cash, cash equivalents and restricted cash, end of period | $ | $ | $ | ||
Cash and cash equivalents held at Consolidated Funds | $ | $ | $ |
As of December 31, | |||
2023 | 2022 | ||
(Dollars in millions) | |||
Investments | $ | $ | |
Accrued performance allocations | |||
Management fee receivables | |||
Total | $ | $ |
As of December 31, | |||
2023 | 2022 | ||
(Dollars in millions) | |||
Currency translation adjustments | $( | $( | |
Unrealized losses on defined benefit plans | ( | ( | |
Total | $( | $( |
Level I | Level II | Level III | Total | ||||
Assets | (Dollars in millions) | ||||||
Investments of Consolidated Funds(1): | |||||||
Equity securities(2) | $ | $ | $ | $ | |||
Bonds | |||||||
Loans | |||||||
Investments in CLOs and other: | |||||||
Investments in CLOs | |||||||
Other investments(3) | |||||||
Subtotal | $ | $ | $ | $ | |||
Investments measured at net asset value | |||||||
Total | $ | ||||||
Liabilities | |||||||
Loans payable of Consolidated Funds(4)(5) | $ | $ | $ | $ | |||
Total | $ | $ | $ | $ |
(Dollars in millions) | Level I | Level II | Level III | Total | |||
Assets | (Dollars in millions) | ||||||
Investments of Consolidated Funds(1): | |||||||
Equity securities(2) | $ | $ | $ | $ | |||
Bonds | |||||||
Loans | |||||||
Investments in CLOs and other: | |||||||
Investments in CLOs | |||||||
Other investments(3) | |||||||
Corporate treasury investments | |||||||
Commercial paper and other | |||||||
Foreign currency forward contracts | |||||||
Subtotal | $ | $ | $ | $ | |||
Investments measured at net asset value | |||||||
Total | $ | ||||||
Liabilities | |||||||
Loans payable of Consolidated Funds(4) | $ | $ | $ | $ | |||
Foreign currency forward contracts | |||||||
Total | $ | $ | $ | $ |
Financial Assets Year Ended December 31, 2023 | |||||||||||
Investments of Consolidated Funds | Investments in CLOs | Total | |||||||||
Equity securities | Bonds | Loans | Other investments | ||||||||
Balance, beginning of period | $ | $ | $ | $ | $ | $ | |||||
Deconsolidation of funds(1) | ( | ( | ( | ||||||||
Purchases | |||||||||||
Sales and distributions | ( | ( | ( | ( | ( | ( | |||||
Settlements | ( | ( | ( | ||||||||
Realized and unrealized gains (losses), net | |||||||||||
Included in earnings | ( | ||||||||||
Included in other comprehensive income | |||||||||||
Balance, end of period | $ | $ | $ | $ | $ | $ | |||||
Changes in unrealized gains (losses) included in earnings related to financial assets still held at the reporting date | $( | $ | $ | $ | $ | $ | |||||
Changes in unrealized gains (losses) included in other comprehensive income related to financial assets still held at the reporting date | $ | $ | $ | $ | $ | $ |
Financial Assets Year Ended December 31, 2022 | |||||||||||
Investments of Consolidated Funds | Investments in CLOs | Total | |||||||||
Equity securities | Bonds | Loans | Other investments | ||||||||
Balance, beginning of period | $ | $ | $ | $ | $ | $ | |||||
Deconsolidation of funds(2) | ( | ( | |||||||||
Purchases | |||||||||||
Sales and distributions | ( | ( | ( | ( | ( | ( | |||||
Settlements | ( | ( | ( | ||||||||
Realized and unrealized gains (losses), net | |||||||||||
Included in earnings | ( | ( | ( | ( | ( | ||||||
Included in other comprehensive income | ( | ( | ( | ( | ( | ||||||
Balance, end of period | $ | $ | $ | $ | $ | $ | |||||
Changes in unrealized gains (losses) included in earnings related to financial assets still held at the reporting date | $( | $( | $( | $( | $ | $( | |||||
Changes in unrealized gains (losses) included in other comprehensive income related to financial assets still held at the reporting date | $( | $( | $( | $( | $ | $( |
Financial Liabilities | |||
Loans Payable of Consolidated Funds | |||
Year Ended December 31, | |||
2023 | 2022 | ||
Balance, beginning of period | $ | $ | |
Borrowings | |||
Paydowns | ( | ( | |
Sales | ( | ( | |
Realized and unrealized (gains) losses, net | |||
Included in earnings | ( | ||
Included in other comprehensive income | ( | ||
Balance, end of period | $ | $ | |
Changes in unrealized (gains) losses included in earnings related to financial liabilities still held at the reporting date | $ | $( | |
Changes in unrealized (gains) losses included in other comprehensive income related to financial liabilities still held at the reporting date | $ | $( |
Fair Value at | Range (Weighted Average) | |||||||
(Dollars in millions) | December 31, 2023 | Valuation Technique(s) | Unobservable Input(s) | |||||
Assets | ||||||||
Investments of Consolidated Funds: | ||||||||
Equity securities | $ | Consensus Pricing | Indicative Quotes ($ per share) | |||||
Discounted Cash Flow | Discount Rates | |||||||
Terminal Growth Rate | ||||||||
Comparable Multiple | EBITDA Multiple | |||||||
TCF Multiple | ||||||||
Discounted Cash Flow | Discount Rates | |||||||
Terminal Growth Rate | ||||||||
Comparable Multiple | TCF Multiple | |||||||
Other(1) | N/A | N/A | ||||||
Bonds | Consensus Pricing | Indicative Quotes (% of Par) | ||||||
Loans | Consensus Pricing | Indicative Quotes (% of Par) | ||||||
Discounted Cash Flow | Discount Rates | |||||||
Constant Prepayment Rate | ||||||||
Constant Default Rate | ||||||||
Recovery Rate | ||||||||
Other(1) | N/A | N/A | ||||||
Investments in CLOs | ||||||||
Senior secured notes | Discounted Cash Flow with Consensus Pricing | Indicative Quotes (% of Par) | ||||||
Discount Margins (Basis Points) | ||||||||
Default Rates | ||||||||
Recovery Rates | ||||||||
Subordinated notes and preferred shares | Discounted Cash Flow with Consensus Pricing | Indicative Quotes (% of Par) | ||||||
Discount Rate | ||||||||
Default Rates | ||||||||
Recovery Rates | ||||||||
Other(1) | N/A | N/A | ||||||
Other investments: | ||||||||
BDC preferred shares | Market Yield Analysis | Market Yields | ||||||
Aviation subordinated notes | Discounted Cash Flow | Discount Rates | ||||||
Total | $ | |||||||
Liabilities | ||||||||
Loans payable of Consolidated Funds: | ||||||||
Senior secured notes | $ | Other(2) | N/A | N/A | ||||
Subordinated notes and preferred shares | Discounted Cash Flow with Consensus Pricing | Indicative Quotes (% of Par) | ||||||
Discount Rates | ||||||||
Default Rates | ||||||||
Recovery Rates | ||||||||
Other(1) | N/A | N/A | ||||||
Total | $ |
Fair Value at | Range (Weighted Average) | ||||||
(Dollars in millions) | December 31, 2022 | Valuation Technique(s) | Unobservable Input(s) | ||||
Assets | |||||||
Investments of Consolidated Funds: | |||||||
Equity securities | $ | Consensus Pricing | Indicative Quotes ($ per share) | ||||
Discounted Cash Flow | Discount Rates | ||||||
Terminal Growth Rate | |||||||
Comparable Multiple | EBITDA Multiple | ||||||
TCF Multiple | |||||||
Other(1) | N/A | N/A | |||||
Bonds | Consensus Pricing | Indicative Quotes (% of Par) | |||||
Loans | Consensus Pricing | Indicative Quotes (% of Par) | |||||
Discounted Cash Flow | Discount Rates | ||||||
Consensus Pricing | Indicative Quotes (% of Par) | ||||||
Other | Other(1) | N/A | N/A | ||||
Investments in CLOs | |||||||
Senior secured notes | Discounted Cash Flow with Consensus Pricing | Indicative Quotes (% of Par) | |||||
Discount Margins (Basis Points) | |||||||
Default Rates | |||||||
Recovery Rates | |||||||
Subordinated notes and preferred shares | Discounted Cash Flow with Consensus Pricing | Indicative Quotes (% of Par) | |||||
Discount Rate | |||||||
Default Rates | |||||||
Recovery Rates | |||||||
Other investments: | |||||||
BDC preferred shares | Market Yield Analysis | Market Yields | |||||
Aviation subordinated notes | Discounted Cash Flow | Discount Rates | |||||
Total | $ | ||||||
Liabilities | |||||||
Loans payable of Consolidated Funds: | |||||||
Senior secured notes | $ | Other(2) | N/A | N/A | |||
Subordinated notes and preferred shares | Discounted Cash Flow with Consensus Pricing | Indicative Quotes (% of Par) | |||||
Discount Rates | |||||||
Default Rates | |||||||
Recovery Rates | |||||||
Total | $ |
As of December 31, | |||
2023 | 2022 | ||
(Dollars in millions) | |||
Accrued performance allocations | $ | $ | |
Principal equity method investments, excluding performance allocations | |||
Principal investments in CLOs | |||
Other investments | |||
Total | $ | $ |
As of December 31, | |||
2023 | 2022 | ||
(Dollars in millions) | |||
Global Private Equity | $ | $ | |
Global Credit | |||
Global Investment Solutions | |||
Total | $ | $ |
As of December 31, | |||
2023 | 2022 | ||
(Dollars in millions) | |||
Global Private Equity | $( | $( | |
Global Credit | ( | ( | |
Total | $( | $( |
As of December 31, | |||
2023 | 2022 | ||
(Dollars in millions) | |||
Global Private Equity(1) | $ | $ | |
Global Credit(2) | |||
Global Investment Solutions | |||
Total | $ | $ |
Global Private Equity | Global Credit | Global Investment Solutions | Aggregate Totals | ||||||||||||||||||||
For the Year Ended December 31, | For the Year Ended December 31, | For the Year Ended December 31, | For the Year Ended December 31, | ||||||||||||||||||||
2023 | 2022 | 2021 | 2023 | 2022 | 2021 | 2023 | 2022 | 2021 | 2023 | 2022 | 2021 | ||||||||||||
Statement of operations information | |||||||||||||||||||||||
Investment income | $ | $ | $ | $ | $ | $ | $ | $ | $ | $ | $ | $ | |||||||||||
Expenses | |||||||||||||||||||||||
Net investment income (loss) | ( | ( | ( | ||||||||||||||||||||
Net realized and unrealized gain (loss) | ( | ||||||||||||||||||||||
Net income (loss) | $ | $ | $ | $ | $ | $ | $ | $ | $ | $ | $ | $ |
Global Private Equity | Global Credit | Global Investment Solutions | Aggregate Totals | ||||||||||||
As of December 31, | As of December 31, | As of December 31, | As of December 31, | ||||||||||||
2023 | 2022 | 2023 | 2022 | 2023 | 2022 | 2023 | 2022 | ||||||||
Balance sheet information | |||||||||||||||
Investments | $ | $ | $ | $ | $ | $ | $ | $ | |||||||
Total assets | $ | $ | $ | $ | $ | $ | $ | $ | |||||||
Debt | $ | $ | $ | $ | $ | $ | $ | $ | |||||||
Other liabilities | $ | $ | $ | $ | $ | $ | $ | $ | |||||||
Total liabilities | $ | $ | $ | $ | $ | $ | $ | $ | |||||||
Partners’ capital | $ | $ | $ | $ | $ | $ | $ | $ |
As of December 31, | |||
2023 | 2022 | ||
(Dollars in millions) | |||
Investment in NGP Management | $ | $ | |
Investments in NGP general partners - accrued performance allocations | |||
Principal investments in NGP funds | |||
Total investments in NGP | $ | $ |
Year Ended December 31, | |||||
2023 | 2022 | 2021 | |||
(Dollars in millions) | |||||
Management fee related revenues from NGP Management | $ | $ | $ | ||
Expenses related to the investment in NGP Management | ( | ( | ( | ||
Amortization of basis differences from the investment in NGP Management | ( | ( | |||
Net investment income from NGP Management | $ | $ | $ |
Year Ended December 31, | |||||
2023 | 2022 | 2021 | |||
(Dollars in millions) | |||||
Performance allocations | |||||
Realized | $ | $ | $ | ||
Unrealized | ( | ( | |||
( | |||||
Principal investment income (loss) from equity method investments (excluding performance allocations) | |||||
Realized | |||||
Unrealized | ( | ||||
Principal investment income (loss) from investments in CLOs and other investments | |||||
Realized | ( | ||||
Unrealized(1) | ( | ||||
( | |||||
Total | $ | $ | $ |
Year Ended December 31, | |||||
2023 | 2022 | 2021 | |||
(Dollars in millions) | |||||
Global Private Equity | $( | $ | $ | ||
Global Credit | |||||
Global Investment Solutions | |||||
Total | $( | $ | $ |
Year Ended December 31, 2023 | ||
(Dollars in millions) | ||
Global Private Equity | CP VI | $( |
Global Private Equity | CP VII | ( |
Year Ended December 31, 2022 | ||
(Dollars in millions) | ||
Global Private Equity | CP VI | $( |
Year Ended December 31, 2021 | ||
(Dollars in millions) | ||
Global Private Equity | CP VI | $ |
Global Private Equity | CP VII |
Year Ended December 31, | |||||
2023 | 2022 | 2021 | |||
(Dollars in millions) | |||||
Global Private Equity | $ | $ | $ | ||
Global Credit | ( | ( | |||
Global Investment Solutions | |||||
Total | $ | $ | $ |
Fair Value | Percentage of Investments of Consolidated Funds | ||||||
Geographic Region/Instrument Type/ Industry | December 31, | December 31, | |||||
Description or Investment Strategy | 2023 | 2022 | 2023 | 2022 | |||
(Dollars in millions) | |||||||
United States | |||||||
Equity securities: | |||||||
Infrastructure | $ | ||||||
Other | |||||||
Total equity securities (cost of $ 2023 and 2022, respectively) | |||||||
Partnership and LLC interests: | |||||||
Fund Investments | $ | $ | |||||
Total Partnership and LLC interests (cost of $ December 31, 2023 and 2022, respectively) | |||||||
Loans: | |||||||
Aerospace & Defense | $ | $ | |||||
Collateralized Debt Obligation | |||||||
Environmental Industries | |||||||
Education | |||||||
Total loans (cost of $ respectively) | |||||||
Assets of the CLOs: | |||||||
Bonds | $ | $ | |||||
Equity | |||||||
Loans | |||||||
Total assets of the CLOs (cost of $ December 31, 2023 and 2022, respectively) | |||||||
Total United States | $ | $ |
Europe | |||||||
Assets of the CLOs: | |||||||
Bonds | $ | $ | |||||
Equity | |||||||
Loans | |||||||
Total assets of the CLOs (cost of $ December 31, 2023 and 2022, respectively) | |||||||
Total Europe | $ | $ | |||||
Global | |||||||
Assets of the CLOs: | |||||||
Bonds | $ | $ | |||||
Loans | |||||||
Total assets of the CLOs (cost of $ December 31, 2023 and 2022, respectively) | |||||||
Total Global | $ | $ | |||||
Total investments of Consolidated Funds (cost of $ at December 31, 2023 and 2022, respectively) | $ | $ |
Year Ended December 31, | |||||
2023 | 2022 | 2021 | |||
(Dollars in millions) | |||||
Interest income from investments | $ | $ | $ | ||
Other income | |||||
Total | $ | $ | $ |
Year Ended December 31, | |||||
2023 | 2022 | 2021 | |||
(Dollars in millions) | |||||
Gains (losses) from investments of Consolidated Funds | $ | $( | $ | ||
Gains (losses) from liabilities of CLOs | ( | ( | |||
Total | $ | $( | $ |
Year Ended December 31, | |||||
2023 | 2022 | 2021 | |||
(Dollars in millions) | |||||
Realized gains (losses) | $( | $( | $ | ||
Net change in unrealized gains (losses) | ( | ||||
Total | $ | $( | $ |
As of December 31, | |||
2023 | 2022 | ||
(Dollars in millions) | |||
Acquired contractual rights | $ | $ | |
Accumulated amortization | ( | ( | |
Finite-lived intangible assets, net | |||
Goodwill | |||
Intangible Assets, net | $ | $ |
Year ending December 31, | |
2024 | $ |
2025 | |
2026 | |
2027 | |
2028 | |
Thereafter | |
$ |
As of December 31, | |||||||
2023 | 2022 | ||||||
Borrowing Outstanding | Carrying Value | Borrowing Outstanding | Carrying Value | ||||
(Dollars in millions) | |||||||
CLO Borrowings (See below) | $ | $ | $ | $ | |||
Total debt obligations | $ | $ | $ | $ |
Formation Date | Borrowing Outstanding December 31, 2023 | Borrowing Outstanding December 31, 2022 | Maturity Date(1) | Interest Rate as of December 31, 2023 | ||||||
February 28, 2017 | $ | $ | September 21, 2029 | (2) | ||||||
June 29, 2017 | July 20, 2030 | (4) | ||||||||
December 6, 2017 | January 15, 2031 | (5) | ||||||||
March 15, 2019 | March 15, 2032 | (3) | ||||||||
August 20, 2019 | August 15, 2032 | (3) | ||||||||
September 15, 2020 | April 15, 2033 | (3) | ||||||||
January 8, 2021 | January 15, 2034 | (3) | ||||||||
March 9, 2021 | August 15, 2030 | (3) | ||||||||
March 30, 2021 | March 15, 2032 | (3) | ||||||||
April 21, 2021 | April 15, 2033 | (3) | ||||||||
May 21, 2021 | November 17, 2031 | (3) | ||||||||
June 4, 2021 | January 16, 2034 | (3) | ||||||||
June 10, 2021 | November 17, 2031 | (3) | ||||||||
July 15, 2021 | July 15, 2034 | (3) | ||||||||
July 20, 2021 | July 20, 2031 | (3) | ||||||||
August 4, 2021 | August 15, 2032 | (3) | ||||||||
October 27, 2021 | October 15, 2035 | (3) | ||||||||
November 5, 2021 | January 14, 2034 | (3) | ||||||||
January 6, 2022 | February 15, 2035 | (3) | ||||||||
February 22, 2022 | November 10, 2035 | (3) | ||||||||
July 13, 2022 | January 13, 2035 | (3) | ||||||||
October 25, 2022 | October 25, 2035 | (3) | ||||||||
September 5, 2023 | August 28, 2031 | (3) | ||||||||
$ | $ |
Aggregate Principal Amount | Interest Expense | ||||||||||
Fair Value(1) As of December 31, | For The Years Ended December 31, | ||||||||||
2023 | 2022 | 2023 | 2022 | 2021 | |||||||
$ | $ | $ | $ | $ | $ | ||||||
$ | $ | $ |
As of December 31, 2023 | |||||||
Borrowing Outstanding | Fair Value | Weighted Average Interest Rate | Weighted Average Remaining Maturity in Years | ||||
Senior secured notes(1) | $ | $ | |||||
Subordinated notes(2) | N/A | (4) | |||||
Revolving credit facilities(3) | |||||||
Total | $ | $ |
As of December 31, 2022 | |||||||
Borrowing Outstanding | Fair Value | Weighted Average Interest Rate | Weighted Average Remaining Maturity in Years | ||||
Senior secured notes(1) | $ | $ | |||||
Subordinated notes | N/A | (4) | |||||
Revolving credit facilities(3) | |||||||
Total | $ | $ |
As of December 31, | |||
2023 | 2022 | ||
(Dollars in millions) | |||
Accrued performance allocations and incentive fee related compensation(1) | $ | $ | |
Accrued bonuses | |||
Employment-based contingent cash consideration(2) | |||
Accrued pension liability | |||
Other(3) | |||
Total | $ | $ |
Year Ended December 31, | |||||
2023 | 2022 | 2021 | |||
(Dollars in millions) | |||||
Realized | $ | $ | $ | ||
Unrealized(1) | ( | ||||
Total | $ | $ | $ |
Year Ended December 31, | |||
2023 | 2022 | ||
Operating lease cost | $ | $ | |
Sublease income | ( | ( | |
Total operating lease cost | $ | $ | |
Cash paid for amounts included in the measurement of operating lease liabilities | $ | $ | |
Weighted-average remaining lease term | |||
Weighted-average discount rate |
Year ending December 31, | |
2024 | $ |
2025 | |
2026 | |
2027 | |
2028 | |
Thereafter | |
Total lease payments | $ |
Less imputed interest | ( |
Total lease liabilities | $ |
As of December 31, | |||
2023 | 2022 | ||
(Dollars in millions) | |||
Accrued incentive fees | $ | $ | |
Unbilled receivable for giveback obligations from current and former employees | |||
Notes receivable and accrued interest from affiliates | |||
Management fee receivable, net | |||
Reimbursable expenses and other receivables from unconsolidated funds and affiliates, net | |||
Total | $ | $ |
As of December 31, | |||
2023 | 2022 | ||
(Dollars in millions) | |||
Due to affiliates of Consolidated Funds | $ | $ | |
Due to non-consolidated affiliates | |||
Amounts owed under the tax receivable agreement | |||
Deferred consideration for Carlyle Holdings units | |||
Other | |||
Total | $ | $ |
Year Ended December 31, | |||||
2023 | 2022 | 2021 | |||
(Dollars in millions) | |||||
U.S. domestic income (loss) | $( | $ | $ | ||
Foreign income | |||||
Total income (loss) before provision for income taxes | $( | $ | $ |
Year Ended December 31, | |||||
2023 | 2022 | 2021 | |||
(Dollars in millions) | |||||
Current | |||||
Federal income tax | $ | $ | $ | ||
State and local income tax | |||||
Foreign income tax | |||||
Total current | |||||
Deferred | |||||
Federal income tax | ( | ( | |||
State and local income tax | ( | ( | |||
Foreign income tax | ( | ( | |||
Total deferred | ( | ( | |||
Total provision (benefit) for income taxes | $( | $ | $ |
Year Ended December 31, | |||||
2023 | 2022 | 2021 | |||
(Dollars in millions) | |||||
Income (loss) before provision for income taxes | $( | $ | $ | ||
Provision (benefit) for income taxes | $( | $ | $ | ||
Effective income tax rate |
Year Ended December 31, | |||||
2023 | 2022 | 2021 | |||
Statutory U.S. federal income tax rate | |||||
State and local income taxes | |||||
Foreign income taxes(1) | ( | ( | |||
Income passed through to common unitholders and non-controlling interest holders(2) | ( | ( | |||
Equity-based compensation | ( | ( | ( | ||
Valuation allowance(3) | ( | ||||
Unrecognized tax benefits | ( | ||||
Other adjustments(3) | ( | ( | |||
Effective income tax rate |
As of December 31, | |||
2023 | 2022 | ||
(Dollars in millions) | |||
Deferred tax assets | |||
Federal foreign tax credit carryforward | $ | $ | |
State net operating loss carryforwards | |||
Tax basis goodwill and intangibles | |||
Depreciation and amortization | |||
Deferred restricted common unit compensation | |||
Lease liabilities | |||
Accrued compensation | |||
Other | |||
Deferred tax assets before valuation allowance | |||
Valuation allowance | ( | ( | |
Total deferred tax assets | $ | $ | |
Deferred tax liabilities(1) | |||
Unrealized appreciation on investments | $ | $ | |
Lease right-of-use assets | |||
Basis difference in investments | |||
Other | |||
Total deferred tax liabilities | $ | $ | |
Net deferred tax assets (liabilities) | $( | $( |
As of December 31, | |||||
2023 | 2022 | 2021 | |||
(Dollars in millions) | |||||
Balance at January 1 | $ | $ | $ | ||
Additions based on tax positions related to current year | |||||
Additions for tax positions of prior years | |||||
Reductions for tax position of prior years | ( | ( | ( | ||
Reductions due to lapse of statute of limitations | ( | ( | |||
Balance at December 31 | $ | $ | $ |
As of December 31, | |||
2023 | 2022 | ||
(Dollars in millions) | |||
Non-Carlyle interests in Consolidated Funds | $ | $ | |
Non-Carlyle interests in majority-owned subsidiaries | |||
Non-controlling interest in carried interest, giveback obligations and cash held for carried interest distributions | ( | ||
Non-controlling interests in consolidated entities | $ | $ |
Year Ended December 31, | |||||
2023 | 2022 | 2021 | |||
(Dollars in millions) | |||||
Non-Carlyle interests in Consolidated Funds | $ | $ | $ | ||
Non-Carlyle interests in majority-owned subsidiaries | |||||
Non-controlling interest in carried interest, giveback obligations and cash held for carried interest distributions | |||||
Non-controlling interests in income of consolidated entities | $ | $ | $ |
Year Ended December 31, 2023 | Year Ended December 31, 2022 | Year Ended December 31, 2021 | |||||||||
Basic | Diluted | Basic | Diluted | Basic | Diluted | ||||||
Net income (loss) attributable to common shares | $( | $( | $ | $ | $ | $ | |||||
Weighted-average common shares outstanding | |||||||||||
Net income (loss) per common share | $( | $( | $ | $ | $ | $ |
Year Ended December 31, 2023 | Year Ended December 31, 2022 | Year Ended December 31, 2021 | |||||||||
Basic | Diluted | Basic | Diluted | Basic | Diluted | ||||||
The Carlyle Group Inc. weighted-average common shares outstanding | |||||||||||
Unvested restricted stock units | |||||||||||
Issuable common shares and performance- vesting restricted stock units | |||||||||||
Weighted-average common shares outstanding |
Dividend Record Date | Dividend Payment Date | Dividend per Common Share | Dividend to Common Stockholders | |||
(Dollars in millions, except per share data) | ||||||
May 10, 2022 | May 17, 2022 | $ | $ | |||
August 9, 2022 | August 16, 2022 | |||||
November 18, 2022 | November 25, 2022 | |||||
February 22, 2023 | March 1, 2023 | |||||
Total 2022 Dividend Year | $ | $ | ||||
May 16, 2023 | May 23, 2023 | $ | $ | |||
August 15, 2023 | August 23, 2023 | |||||
November 21, 2023 | November 29, 2023 | |||||
February 23, 2024 | March 1, 2024 | |||||
Total 2023 Dividend Year | $ | $ |
The Carlyle Group, Inc. | ||||||||
Equity Settled Awards | ||||||||
Unvested Shares | Restricted Stock Units | Weighted- Average Grant Date Fair Value | Unvested Common Shares(1) | Weighted- Average Grant Date Fair Value | ||||
Balance, December 31, 2020 | $ | $ | ||||||
Granted(2) | $ | $ | ||||||
Vested | $ | $ | ||||||
Forfeited | $ | $ | ||||||
Balance, December 31, 2021 | $ | $ | ||||||
Granted | $ | $ | ||||||
Vested | $ | $ | ||||||
Forfeited | $ | $ | ||||||
Balance, December 31, 2022 | $ | $ | ||||||
Granted(3) | $ | $ | ||||||
Vested | $ | $ | ||||||
Forfeited | $ | $ | ||||||
Balance, December 31, 2023 | $ | $ |
Year Ended December 31, 2023 | |||||||
Global Private Equity | Global Credit | Global Investment Solutions | Total | ||||
(Dollars in millions) | |||||||
Segment Revenues | |||||||
Fund level fee revenues | |||||||
Fund management fees | $ | $ | $ | $ | |||
Portfolio advisory and transaction fees, net and other | |||||||
Fee related performance revenues | |||||||
Total fund level fee revenues | |||||||
Realized performance revenues | |||||||
Realized principal investment income | |||||||
Interest income | |||||||
Total revenues | |||||||
Segment Expenses | |||||||
Compensation and benefits | |||||||
Cash-based compensation and benefits | |||||||
Realized performance revenues related compensation | |||||||
Total compensation and benefits | |||||||
General, administrative, and other indirect expenses | |||||||
Depreciation and amortization expense | |||||||
Interest expense | |||||||
Total expenses | |||||||
Distributable Earnings | $ | $ | $ | $ | |||
(-) Realized Net Performance Revenues | |||||||
(-) Realized Principal Investment Income | |||||||
(+) Net Interest | |||||||
(=) Fee Related Earnings | $ | $ | $ | $ | |||
Segment assets as of December 31, 2023 | $ | $ | $ | $ |
Year Ended December 31, 2022 | |||||||
Global Private Equity | Global Credit | Global Investment Solutions | Total | ||||
(Dollars in millions) | |||||||
Segment Revenues | |||||||
Fund level fee revenues | |||||||
Fund management fees | $ | $ | $ | $ | |||
Portfolio advisory and transaction fees, net and other | |||||||
Fee related performance revenues | |||||||
Total fund level fee revenues | |||||||
Realized performance revenues | |||||||
Realized principal investment income | |||||||
Interest income | |||||||
Total revenues | |||||||
Segment Expenses | |||||||
Compensation and benefits | |||||||
Cash-based compensation and benefits | |||||||
Realized performance revenues related compensation | |||||||
Total compensation and benefits | |||||||
General, administrative, and other indirect expenses | |||||||
Depreciation and amortization expense | |||||||
Interest expense | |||||||
Total expenses | |||||||
Distributable Earnings | $ | $ | $ | $ | |||
(-) Realized Net Performance Revenues | |||||||
(-) Realized Principal Investment Income | |||||||
(+) Net Interest | |||||||
(=) Fee Related Earnings | $ | $ | $ | $ | |||
Segment assets as of December 31, 2022 | $ | $ | $ | $ |
Year Ended December 31, 2021 | |||||||
Global Private Equity(1) | Global Credit | Global Investment Solutions(2) | Total | ||||
(Dollars in millions) | |||||||
Segment Revenues | |||||||
Fund level fee revenues | |||||||
Fund management fees | $ | $ | $ | $ | |||
Portfolio advisory and transaction fees, net and other | |||||||
Fee related performance revenues | |||||||
Total fund level fee revenues | |||||||
Realized performance revenues | ( | ||||||
Realized principal investment income | |||||||
Interest income | |||||||
Total revenues | |||||||
Segment Expenses | |||||||
Compensation and benefits | |||||||
Cash-based compensation and benefits | |||||||
Realized performance revenues related compensation | ( | ||||||
Total compensation and benefits | |||||||
General, administrative, and other indirect expenses | |||||||
Depreciation and amortization expense | |||||||
Interest expense | |||||||
Total expenses | |||||||
Distributable Earnings | $ | $ | $ | $ | |||
(-) Realized net performance revenues | ( | ||||||
(-) Realized principal investment income | |||||||
(+) Net interest | |||||||
(=) Fee Related Earnings | $ | $ | $ | $ |
December 31, 2023 and the Year then Ended | |||||||||
Total Reportable Segments | Consolidated Funds | Reconciling Items | Carlyle Consolidated | ||||||
(Dollars in millions) | |||||||||
Revenues | $ | $ | $( | (a) | $ | ||||
Expenses | $ | $ | $ | (b) | $ | ||||
Other income | $ | $ | $ | (c) | $ | ||||
Distributable earnings | $ | $ | $( | (d) | $( | ||||
Total assets | $ | $ | $( | (e) | $ |
December 31, 2022 and the Year then Ended | |||||||||
Total Reportable Segments | Consolidated Funds | Reconciling Items | Carlyle Consolidated | ||||||
(Dollars in millions) | |||||||||
Revenues | $ | $ | $( | (a) | $ | ||||
Expenses | $ | $ | $ | (b) | $ | ||||
Other loss | $ | $( | $ | (c) | $( | ||||
Distributable earnings | $ | $ | $( | (d) | $ | ||||
Total assets | $ | $ | $( | (e) | $ |
December 31, 2021 and the Year then Ended | |||||||||
Total Reportable Segments | Consolidated Funds | Reconciling Items | Carlyle Consolidated | ||||||
(Dollars in millions) | |||||||||
Revenues | $ | $ | $ | (a) | $ | ||||
Expenses | $ | $ | $ | (b) | $ | ||||
Other income | $ | $ | $ | (c) | $ | ||||
Distributable earnings | $ | $ | $ | (d) | $ | ||||
Total assets | $ | $ | $( | (e) | $ |
Year Ended December 31, | |||||
2023 | 2022 | 2021 | |||
(Dollars in millions) | |||||
Unrealized performance and fee related performance revenues | $( | $( | $ | ||
Unrealized principal investment income | ( | ||||
Principal investment loss from dilution of indirect investment in Fortitude | ( | ( | |||
Adjustments related to expenses associated with investments in NGP Management and its affiliates | ( | ( | ( | ||
Tax expense associated with certain foreign performance revenues | |||||
Non-controlling interests and other adjustments to present certain costs on a net basis | |||||
Elimination of revenues of Consolidated Funds | ( | ( | ( | ||
$( | $( | $ |
Year Ended December 31, | |||||
2023 | 2022 | 2021 | |||
(Dollars in millions) | |||||
Total Reportable Segments - Fund level fee revenues | $ | $ | $ | ||
Adjustments(1) | ( | ( | ( | ||
Carlyle Consolidated - Fund management fees | $ | $ | $ |
Year Ended December 31, | |||||
2023 | 2022 | 2021 | |||
(Dollars in millions) | |||||
Unrealized performance and fee related performance revenue compensation expense | $ | $( | $ | ||
Equity-based compensation | |||||
Acquisition or disposition-related charges and amortization of intangibles and impairment | |||||
Tax (expense) benefit associated with certain foreign performance revenues related compensation | ( | ( | |||
Non-controlling interests and other adjustments to present certain costs on a net basis | |||||
Debt extinguishment costs | |||||
Right-of-use asset impairment | |||||
Other adjustments | |||||
Elimination of expenses of Consolidated Funds | ( | ( | ( | ||
$ | $ | $ |
Year Ended December 31, | |||||
2023 | 2022 | 2021 | |||
(Dollars in millions) | |||||
Income before provision for income taxes | $( | $ | $ | ||
Adjustments: | |||||
Net unrealized performance and fee related performance revenues | ( | ( | |||
Unrealized principal investment (income) loss | ( | ( | |||
Principal investment loss from dilution of indirect investment in Fortitude | |||||
Equity-based compensation(1) | |||||
Acquisition or disposition-related charges, including amortization of intangibles and impairment | |||||
Net income attributable to non-controlling interests in consolidated entities | ( | ( | ( | ||
Tax (expense) benefit associated with certain foreign performance revenues | ( | ( | |||
Debt extinguishment costs | |||||
Right-of-use impairment | |||||
Other adjustments | |||||
Distributable Earnings | $ | $ | $ | ||
Realized performance revenues, net of related compensation(2) | |||||
Realized principal investment income(2) | |||||
Net interest | |||||
Fee Related Earnings | $ | $ | $ |
Year Ended December 31, 2023 | |||||
Carlyle Consolidated | Adjustments(3) | Total Reportable Segments | |||
(Dollars in millions) | |||||
Performance revenues | $( | $ | $ | ||
Performance revenues related compensation expense | ( | ||||
Net performance revenues | $( | $ | $ | ||
Principal investment income (loss) | $ | $( | $ |
Year Ended December 31, 2022 | |||||
Carlyle Consolidated | Adjustments(3) | Total Reportable Segments | |||
(Dollars in millions) | |||||
Performance revenues | $ | $ | $ | ||
Performance revenues related compensation expense | |||||
Net performance revenues | $ | $ | $ | ||
Principal investment income (loss) | $ | $( | $ |
Year Ended December 31, 2021 | |||||
Carlyle Consolidated | Adjustments(3) | Total Reportable Segments | |||
(Dollars in millions) | |||||
Performance revenues | $ | $( | $ | ||
Performance revenues related compensation expense | ( | ||||
Net performance revenues | $ | $( | $ | ||
Principal investment income (loss) | $ | $( | $ |
Total Revenues | Total Assets | ||||||
Share | % | Share | % | ||||
(Dollars in millions) | |||||||
Year Ended December 31, 2023 | |||||||
Americas(1) | $ | $ | |||||
EMEA(2) | |||||||
Asia-Pacific(3) | |||||||
Total | $ | $ |
Total Revenues | Total Assets | ||||||
Share | % | Share | % | ||||
(Dollars in millions) | |||||||
Year Ended December 31, 2022 | |||||||
Americas(1) | $ | $ | |||||
EMEA(2) | |||||||
Asia-Pacific(3) | |||||||
Total | $ | $ |
Total Revenues | Total Assets | ||||||
Share | % | Share | % | ||||
(Dollars in millions) | |||||||
Year Ended December 31, 2021 | |||||||
Americas(1) | $ | $ | |||||
EMEA(2) | |||||||
Asia-Pacific(3) | |||||||
Total | $ | $ |
As of December 31, 2023 | |||||||
Consolidated Operating Entities | Consolidated Funds | Eliminations | Consolidated | ||||
(Dollars in millions) | |||||||
Assets | |||||||
Cash and cash equivalents | $ | $ | $ | $ | |||
Cash and cash equivalents held at Consolidated Funds | |||||||
Restricted cash | |||||||
Investments, including performance allocations of $ | ( | ||||||
Investments of Consolidated Funds | ( | ||||||
Due from affiliates and other receivables, net | ( | ||||||
Due from affiliates and other receivables of Consolidated Funds, net | |||||||
Fixed assets, net | |||||||
Lease right-of-use assets, net | |||||||
Deposits and other | |||||||
Intangible assets, net | |||||||
Deferred tax assets | |||||||
Total assets | $ | $ | $( | $ | |||
Liabilities and equity | |||||||
Debt obligations | $ | $ | $ | $ | |||
Loans payable of Consolidated Funds | ( | ||||||
Accounts payable, accrued expenses and other liabilities | |||||||
Accrued compensation and benefits | |||||||
Due to affiliates | |||||||
Deferred revenue | |||||||
Deferred tax liabilities | |||||||
Other liabilities of Consolidated Funds | |||||||
Lease liabilities | |||||||
Accrued giveback obligations | |||||||
Total liabilities | ( | ||||||
Common stock | |||||||
Additional paid-in capital | ( | ||||||
Retained earnings | |||||||
Accumulated other comprehensive loss | ( | ( | ( | ||||
Non-controlling interests in consolidated entities | |||||||
Total equity | ( | ||||||
Total liabilities and equity | $ | $ | $( | $ |
As of December 31, 2022 | |||||||
Consolidated Operating Entities | Consolidated Funds | Eliminations | Consolidated | ||||
(Dollars in millions) | |||||||
Assets | |||||||
Cash and cash equivalents | $ | $ | $ | $ | |||
Cash and cash equivalents held at Consolidated Funds | |||||||
Restricted cash | |||||||
Corporate treasury investments | |||||||
Investments, including performance allocations of $ | ( | ||||||
Investments of Consolidated Funds | |||||||
Due from affiliates and other receivables, net | ( | ||||||
Due from affiliates and other receivables of Consolidated Funds, net | |||||||
Fixed assets, net | |||||||
Lease right-of-use assets, net | |||||||
Deposits and other | |||||||
Intangible assets, net | |||||||
Deferred tax assets | |||||||
Total assets | $ | $ | $( | $ | |||
Liabilities and equity | |||||||
Debt obligations | $ | $ | $ | $ | |||
Loans payable of Consolidated Funds | ( | ||||||
Accounts payable, accrued expenses and other liabilities | |||||||
Accrued compensation and benefits | |||||||
Due to affiliates | ( | ||||||
Deferred revenue | |||||||
Deferred tax liabilities | |||||||
Other liabilities of Consolidated Funds | ( | ||||||
Lease liabilities | |||||||
Accrued giveback obligations | |||||||
Total liabilities | ( | ||||||
Common stock | |||||||
Additional paid-in capital | ( | ||||||
Retained earnings | |||||||
Accumulated other comprehensive loss | ( | ( | ( | ||||
Non-controlling interests in consolidated entities | |||||||
Total equity | ( | ||||||
Total liabilities and equity | $ | $ | $( | $ |
Year Ended December 31, 2023 | |||||||
Consolidated Operating Entities | Consolidated Funds | Eliminations | Consolidated | ||||
(Dollars in millions) | |||||||
Revenues | |||||||
Fund management fees | $ | $ | $( | $ | |||
Incentive fees | ( | ||||||
Investment income (loss) | |||||||
Performance allocations | ( | ( | ( | ||||
Principal investment income | ( | ||||||
Total investment income | ( | ||||||
Interest and other income | ( | ||||||
Interest and other income of Consolidated Funds | |||||||
Total revenues | ( | ||||||
Expenses | |||||||
Compensation and benefits | |||||||
Cash-based compensation and benefits | |||||||
Equity-based compensation | |||||||
Performance allocations and incentive fee related compensation | |||||||
Total compensation and benefits | |||||||
General, administrative and other expenses | |||||||
Interest | |||||||
Interest and other expenses of Consolidated Funds | ( | ||||||
Other non-operating expenses | |||||||
Total expenses | ( | ||||||
Other income | |||||||
Net investment income of Consolidated Funds | |||||||
Income (loss) before provision for income taxes | ( | ( | ( | ||||
Benefit for income taxes | ( | ( | |||||
Net income (loss) | ( | ( | ( | ||||
Net income attributable to non-controlling interests in consolidated entities | |||||||
Net income (loss) attributable to The Carlyle Group Inc. | $( | $ | $( | $( |
Year Ended December 31, 2022 | |||||||
Consolidated Operating Entities | Consolidated Funds | Eliminations | Consolidated | ||||
(Dollars in millions) | |||||||
Revenues | |||||||
Fund management fees | $ | $ | $( | $ | |||
Incentive fees | ( | ||||||
Investment income | |||||||
Performance allocations | ( | ||||||
Principal investment income | |||||||
Total investment income | |||||||
Interest and other income | ( | ||||||
Interest and other income of Consolidated Funds | |||||||
Total revenues | ( | ||||||
Expenses | |||||||
Compensation and benefits | |||||||
Cash-based compensation and benefits | |||||||
Equity-based compensation | |||||||
Performance allocations and incentive fee related compensation | |||||||
Total compensation and benefits | |||||||
General, administrative and other expenses | ( | ||||||
Interest | |||||||
Interest and other expenses of Consolidated Funds | ( | ||||||
Other non-operating expenses | |||||||
Total expenses | ( | ||||||
Other loss | |||||||
Net investment loss of Consolidated Funds | ( | ( | |||||
Income before provision for income taxes | |||||||
Provision for income taxes | |||||||
Net income | |||||||
Net income attributable to non-controlling interests in consolidated entities | |||||||
Net income attributable to The Carlyle Group Inc. | $ | $ | $( | $ |
Year Ended December 31, 2021 | |||||||
Consolidated Operating Entities | Consolidated Funds | Eliminations | Consolidated | ||||
(Dollars in millions) | |||||||
Revenues | |||||||
Fund management fees | $ | $ | $( | $ | |||
Incentive fees | |||||||
Investment income | |||||||
Performance allocations | |||||||
Principal investment income | ( | ||||||
Total investment income | ( | ||||||
Interest and other income | ( | ||||||
Interest and other income of Consolidated Funds | |||||||
Total revenues | ( | ||||||
Expenses | |||||||
Compensation and benefits | |||||||
Cash-based compensation and benefits | |||||||
Equity-based compensation | |||||||
Performance allocations and incentive fee related compensation | |||||||
Total compensation and benefits | |||||||
General, administrative and other expenses | ( | ||||||
Interest | |||||||
Interest and other expenses of Consolidated Funds | ( | ||||||
Other non-operating expenses | |||||||
Total expenses | ( | ||||||
Other income | |||||||
Net investment gains of Consolidated Funds | |||||||
Income before provision for income taxes | ( | ||||||
Provision for income taxes | |||||||
Net income | ( | ||||||
Net income attributable to non-controlling interests in consolidated entities | |||||||
Net income attributable to The Carlyle Group Inc. | $ | $ | $( | $ |
Year Ended December 31, | |||||
2023 | 2022 | 2021 | |||
(Dollars in millions) | |||||
Cash flows from operating activities | |||||
Net income (loss) | $( | $ | $ | ||
Adjustments to reconcile net income (loss) to net cash flows from operating activities: | |||||
Depreciation and amortization | |||||
Equity-based compensation | |||||
Right-of-use asset impairment, net of broker fees | |||||
Non-cash performance allocations and incentive fees, net | ( | ||||
Non-cash principal investment income | ( | ( | ( | ||
Other non-cash amounts | ( | ||||
Purchases of investments | ( | ( | ( | ||
Proceeds from the sale of investments | |||||
Payments of contingent consideration | ( | ( | ( | ||
Change in deferred taxes, net | ( | ( | |||
Change in due from affiliates and other receivables | ( | ( | ( | ||
Change in deposits and other | ( | ( | |||
Change in accounts payable, accrued expenses and other liabilities | ( | ( | |||
Change in accrued compensation and benefits | ( | ||||
Change in due to affiliates | ( | ||||
Change in lease right-of-use asset and lease liability | ( | ( | |||
Change in deferred revenue | |||||
Net cash provided by operating activities | |||||
Cash flows from investing activities | |||||
Purchases of corporate treasury investments | ( | ( | |||
Proceeds from corporate treasury investments | |||||
Purchases of fixed assets, net | ( | ( | ( | ||
Purchase of Abingworth, net of cash acquired | ( | ||||
Purchase of CBAM intangibles and investments | ( | ||||
Proceeds from sale of MRE, net of cash sold | |||||
Proceeds from sale of Brazil management entity, net of cash sold | |||||
Net cash used in investing activities | ( | ( | ( | ||
Cash flows from financing activities | |||||
Borrowings under credit facilities | |||||
Repayments under credit facilities | ( | ||||
Issuance of | |||||
Repurchase of | ( | ||||
Proceeds from CLO borrowings, net of financing costs | |||||
Payments on CLO borrowings | ( | ( | ( | ||
Payments of contingent consideration | ( | ||||
Dividends to common stockholders | ( | ( | ( | ||
Payment of deferred consideration for Carlyle Holdings units | ( | ( | ( | ||
Contributions from non-controlling interest holders | |||||
Distributions to non-controlling interest holders | ( | ( | ( | ||
Common shares issued for performance allocations | |||||
Common shares repurchased | ( | ( | ( | ||
Change in due to/from affiliates financing activities | ( | ( | ( | ||
Net cash used in financing activities | ( | ( | ( | ||
Effect of foreign exchange rate changes | ( | ( | |||
Increase (decrease) in cash, cash equivalents and restricted cash | ( | ||||
Cash, cash equivalents and restricted cash, beginning of period | |||||
Cash, cash equivalents and restricted cash, end of period | $ | $ | $ |
Supplemental non-cash disclosures | |||||
Issuance of common shares related to the acquisition of CBAM and Abingworth | $ | $ | $ | ||
Reconciliation of cash, cash equivalents and restricted cash, end of period: | |||||
Cash and cash equivalents | $ | $ | $ | ||
Restricted cash | |||||
Total cash, cash equivalents and restricted cash, end of period | $ | $ | $ | ||
Cash and cash equivalents held at Consolidated Funds | $ | $ | $ |
Report of Independent Registered Public Accounting Firm (PCAOB ID: | |
Consolidated Balance Sheets as of December 31, 2023 and 2022 | |
Consolidated Statements of Operations for the Years Ended December 31, 2023, 2022 and 2021 | |
Consolidated Statements of Comprehensive Income for the Years Ended December 31, 2023, 2022 and 2021 | |
Consolidated Statements of Changes in Equity for the Years Ended December 31, 2023, 2022 and 2021 | |
Consolidated Statements of Cash Flows for the Years Ended December 31, 2023, 2022 and 2021 | |
Notes to Consolidated Financial Statements |
Exhibit Index | ||
Exhibit No. | Description | |
3.1 | ||
3.2 | ||
4.1 | ||
4.2 | ||
4.3 | ||
4.4 | ||
4.5 | ||
4.6 | ||
4.7 | ||
4.8 | ||
4.9 | ||
4.10 | ||
4.11 | ||
4.12 | ||
4.13 | ||
4.14 | ||
4.15 | ||
4.16 | ||
4.17 | ||
4.18 |
10.1 | ||
10.2 | ||
Exhibit No. | Description |
10.3 | ||
10.4 | ||
10.5+ | ||
10.6+ | ||
10.7+ | ||
10.8+ | ||
10.9+ | ||
10.10+ | ||
10.11+ | ||
10.12 | ||
10.13 |
10.14 | ||
10.15 | ||
10.16 | ||
Exhibit No. | Description |
10.17 | ||
10.18* | ||
10.19+ | ||
10.20+ | ||
10.21+ | ||
10.22+ | ||
10.23+ | ||
10.24+ | ||
10.25+ | ||
10.26+ | ||
10.27+ | ||
10.28+ | ||
10.29+ | ||
10.30+ | ||
10.31+ | ||
10.32* | ||
21.1* | ||
22* | ||
23.1* | ||
31.1* | ||
Exhibit No. | Description |
31.2* | ||
32.1* | ||
32.2* | ||
97* | ||
101.INS | Inline XBRL Instance Document - the Instance Document does not appear in the Interactive Data File because its XBRL tags are embedded within the Inline XBRL document. | |
101.SCH | Inline XBRL Taxonomy Extension Schema Document. | |
101.CAL | Inline XBRL Taxonomy Extension Calculation Linkbase Document. | |
101.DEF | Inline XBRL Taxonomy Extension Definition Linkbase Document. | |
101.LAB | Inline XBRL Taxonomy Extension Labels Linkbase Document. | |
101.PRE | Inline XBRL Taxonomy Extension Presentation Linkbase Document. | |
104 | The cover page from The Carlyle Group Inc.’s Annual Report on Form 10-K for the fiscal year ended December 31, 2023, formatted in Inline XBRL (included within the Exhibit 101 attachments). |
Exhibit No. | Description |
The Carlyle Group Inc. | ||
By: | /s/ John C. Redett | |
Name: John C. Redett | ||
Title: Chief Financial Officer |
Signature | Title | |
/s/ Harvey M. Schwartz Harvey M. Schwartz | Chief Executive Officer and Director (principal executive officer) | |
/s/ John C. Redett John C. Redett | Chief Financial Officer (principal financial officer) | |
/s/ William E. Conway, Jr William E. Conway, Jr. | Co-Founder, Co-Chairman, and Director | |
/s/ David M. Rubenstein David M. Rubenstein | Co-Founder, Co-Chairman, and Director | |
/s/ Daniel A. D’Aniello Daniel A. D’Aniello | Co-Founder, Chairman Emeritus, and Director | |
/s/ Sharda Cherwoo Sharda Cherwoo | Director | |
/s/ Linda H. Filler Linda H. Filler | Director | |
/s/ Lawton W. Fitt Lawton W. Fitt | Director | |
/s/ James H. Hance, Jr. James H. Hance, Jr. | Director | |
/s/ Mark S. Ordan Mark S. Ordan | Director | |
/s/ Derica W. Rice Derica W. Rice | Director | |
/s/ Dr. Thomas S. Robertson Dr. Thomas S. Robertson | Director | |
/s/ William J. Shaw William J. Shaw | Director | |
/s/ Anthony Welters Anthony Welters | Director | |
/s/ Charles E. Andrews, Jr. Charles E. Andrews, Jr. | Chief Accounting Officer (principal accounting officer) | |